
1. Introduction
In this codelab you will learn how to use the Conversational Analytics (CA) API Python SDK with a BigQuery data source. You will learn how to create a new agent, how to leverage conversation state management, and how to send and stream responses from the API.
Prerequisites
- A basic understanding of Google Cloud and the Google Cloud console
- Basic skills in command line interface and Cloud Shell
- A basic proficiency in Python programming
What you'll learn
- How to use the Conversational Analytics API Python SDK with a BigQuery data source
- How to create a new agent using the CA API
- How to leverage conversation state management
- How to send and stream responses from the API
What you'll need
- A Google Cloud Account and Google Cloud project
- A web browser such as Chrome
2. Setup and requirements
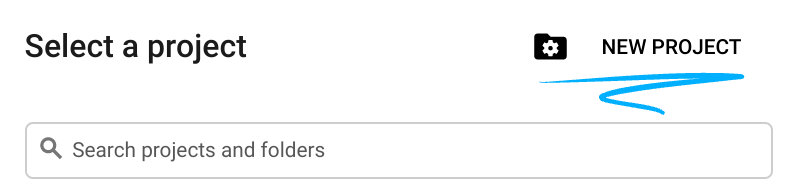
Choose a project
- Sign-in to the Google Cloud Console and create a new project or reuse an existing one. If you don't already have a Gmail or Google Workspace account, you must create one.

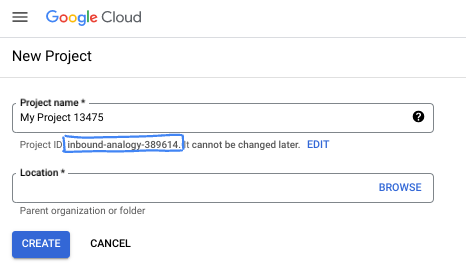
- The Project name is the display name for this project's participants. It is a character string not used by Google APIs. You can always update it.
- The Project ID is unique across all Google Cloud projects and is immutable (cannot be changed after it has been set). The Cloud Console auto-generates a unique string; usually you don't care what it is. In most codelabs, you'll need to reference your Project ID (typically identified as
PROJECT_ID). If you don't like the generated ID, you might generate another random one. Alternatively, you can try your own, and see if it's available. It can't be changed after this step and remains for the duration of the project. - For your information, there is a third value, a Project Number, which some APIs use. Learn more about all three of these values in the documentation.
- Next, you'll need to enable billing in the Cloud Console to use Cloud resources/APIs. Running through this codelab won't cost much, if anything at all. To shut down resources to avoid incurring billing beyond this tutorial, you can delete the resources you created or delete the project. New Google Cloud users are eligible for the $300 USD Free Trial program.
Start Cloud Shell
While Google Cloud can be operated remotely from your laptop, in this codelab you will be using Google Cloud Shell, a command line environment running in the Cloud.
From the Google Cloud Console, click the Cloud Shell icon on the top right toolbar:

It should only take a few moments to provision and connect to the environment. When it is finished, you should see something like this:
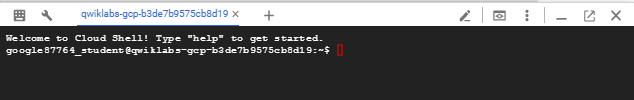
This virtual machine is loaded with all the development tools you'll need. It offers a persistent 5GB home directory, and runs on Google Cloud, greatly enhancing network performance and authentication. All of your work in this codelab can be done within a browser. You do not need to install anything.
3. Before you begin
Enable the required APIs
To use Google Cloud services, you must first activate their respective APIs for your project. You will be using the following Google Cloud services in this codelab:
- Data Analytics API with Gemini
- Gemini for Google Cloud
- BigQuery API
To enable these services, run the following commands in the Cloud Shell terminal:
gcloud services enable geminidataanalytics.googleapis.com
gcloud services enable cloudaicompanion.googleapis.com
gcloud services enable bigquery.googleapis.com
Install Python packages
Before starting any Python project, it's good practice to create a virtual environment. This isolates the project's dependencies, preventing conflicts with other projects or the system's global Python packages. In this section, you'll install uv from pip, as Cloud Shell already has pip available.
Install uv package
pip install uv
Verify if uv is installed correctly
uv --version
Expected output
If you see an output line with uv, you are good to proceed to the next step. Note that the version number may vary:

Create virtual environment and install packages
uv init ca-api-codelab
cd ca-api-codelab
uv venv --python 3.12
uv add google-cloud-geminidataanalytics pandas altair
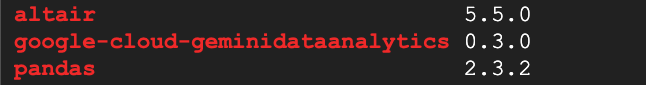
uv pip list | grep -E 'altair|pandas|google-cloud-geminidataanalytics'
Expected output
If you see output lines with the three packages, you are good to proceed to the next step. Note that the version numbers may vary:
Start Python
uv run python
Your screen should look like this:

4. Create an agent
Now that your development environment is set up and ready, it's time to lay the foundation for the Gemini Data Analytics API. The SDK simplifies this process, requiring just a few essential configurations to create your agent.
Set variables
Import the geminidataanalytics package and set our environment variables:
import os
from google.cloud import geminidataanalytics

data_agent_client = geminidataanalytics.DataAgentServiceClient()

location = "global"
billing_project = os.environ.get('DEVSHELL_PROJECT_ID')
data_agent_id = "google_trends_analytics_agent"
Set system instructions for the agent
The CA API reads BigQuery metadata to gain more context about the tables and columns that are being referenced. Since this public dataset does not have any column descriptions, you can provide extra context to the agent as a YAML-formatted string. Refer to the documentation for best practices and a template to use:
system_instruction = """
system_instruction:
  - You are a data analyst specializing in the Google Trends dataset.
  - When querying, always use the 'week' column for date-based filtering. This needs to be a Sunday. If you are doing week over week comparison, make sure you specify a date that is a Sunday.
  - The following columns should be ignored in all queries 'dma_id', 'refresh_date'
  - The 'dma_name' column represents the city and state for about 210 metro areas in the USA.
tables:
  top_terms:
    description: "Represents the 25 most popular search terms by weekly search volume in a given US metro area (DMA)."
    fields:
      term: "The search query string."
      week: "The start date of the week (Sunday) for which the ranking is valid."
      rank: "The term's popularity rank from 1 (most popular) to 25."
      score: "Relative search interest, where 100 is the peak popularity for the term in that week."
      dma_name: "The name of the US metro area, e.g., 'New York NY'."
  top_rising_terms:
    description: "Represents the 25 fastest-growing ('breakout') search terms by momentum in a given US metro area (DMA)."
    fields:
      term: "The surging search query string."
      week: "The start date of the week (Sunday) for which the ranking is valid."
      rank: "The term's breakout rank from 1 (top rising) to 25."
      percent_gain: "The percentage growth in search volume compared to the previous period."
      dma_name: "The name of the US metro area, e.g., 'Los Angeles CA'."
      score: "Relative search interest, where 100 is the peak popularity for the term in that week."
join_instructions:
  goal: "Find terms that are simultaneously popular and rising in the same week and metro area."
  method: "INNER JOIN the two tables on their common keys."
  keys:
    - "term"
    - "week"
    - "dma_name"
golden_queries:
  - natural_language_query: "Find all terms in the 'New York NY' area that were in both the top 25 and top 25 rising lists for the week of July 6th, 2025, and show their ranks and percent gain."
    sql_query: |
      SELECT
          top.term,
          top.rank AS top_25_rank,
          rising.rank AS rising_25_rank,
          rising.percent_gain
      FROM
          `bigquery-public-data.google_trends.top_terms` AS top
      INNER JOIN
          `bigquery-public-data.google_trends.top_rising_terms` AS rising
      ON
          top.term = rising.term
          AND top.week = rising.week
          AND top.dma_name = rising.dma_name
      WHERE
          top.week = '2025-07-06'
          AND top.dma_name = 'New York NY'
      ORDER BY
          top.rank;
"""
Set BigQuery Table Data sources
Now you can set the BigQuery table data sources. The CA API accepts BigQuery tables in an array:
# BigQuery table data sources
bq_top = geminidataanalytics.BigQueryTableReference(
    project_id="bigquery-public-data", dataset_id="google_trends", table_id="top_terms"
)
bq_rising = geminidataanalytics.BigQueryTableReference(
    project_id="bigquery-public-data", dataset_id="google_trends", table_id="top_rising_terms"
)
datasource_references = geminidataanalytics.DatasourceReferences(
    bq=geminidataanalytics.BigQueryTableReferences(table_references=[bq_top, bq_rising]))
Set context for stateful chat
You can create the new agent with the published context which brings together the system instructions, data source references, and any other options.
Note that you have the functionality to create stagingContext to test and validate changes before publishing. This lets a developer add versioning to a data agent by specifying the contextVersion in the chat request. For this codelab, you will just publish directly:
# Context setup for stateful chat
published_context = geminidataanalytics.Context(
    system_instruction=system_instruction,
    datasource_references=datasource_references,
    options=geminidataanalytics.ConversationOptions(
        analysis=geminidataanalytics.AnalysisOptions(
            python=geminidataanalytics.AnalysisOptions.Python(
                enabled=False
            )
        )
    ),
)

data_agent = geminidataanalytics.DataAgent(
    data_analytics_agent=geminidataanalytics.DataAnalyticsAgent(
        published_context=published_context
    ),
)

# Create the agent
data_agent_client.create_data_agent(request=geminidataanalytics.CreateDataAgentRequest(
    parent=f"projects/{billing_project}/locations/{location}",
    data_agent_id=data_agent_id,
    data_agent=data_agent,
))
You should see an output similar to below after creating the agent:

Get the Agent
Let's test the agent to make sure it's been created:
# Test the agent
request = geminidataanalytics.GetDataAgentRequest(
    name=data_agent_client.data_agent_path(
        billing_project, location, data_agent_id)
)
response = data_agent_client.get_data_agent(request=request)
print(response)
You should see the metadata on your new agent. This will include things like the created time and agent context on system instructions and data sources.
5. Create a conversation
You are now ready to create your first conversation! For this codelab, you will use a conversation reference for a stateful chat with your agent.
For reference, the CA API offers various ways to chat with different state and agent management options. Here's a quick summary of the 3 approaches:
State | Conversation History | Agent | Code | Description | |
Chat by using a conversation reference | Stateful | API managed | Yes | Continues a stateful conversation by sending a chat message that references an existing conversation and its associated agent context. For multi-turn conversations, Google Cloud stores and manages the conversation history. | |
Chat by using a data agent reference | Stateless | User managed | Yes | Sends a stateless chat message that references a saved data agent for context. For multi-turn conversations, your application must manage and provide the conversation history with each request. | |
Chat by using inline context | Stateless | User managed | No | Sends a stateless chat message by providing all context directly in the request, without using a saved data agent. For multi-turn conversations, your application must manage and provide the conversation history with each request. |
You will create a function to set up your conversation and provide a unique ID for the conversation:
def setup_conversation(conversation_id: str):
    data_chat_client = geminidataanalytics.DataChatServiceClient()
    conversation = geminidataanalytics.Conversation(
        agents=[data_chat_client.data_agent_path(
            billing_project, location, data_agent_id)],
    )
    request = geminidataanalytics.CreateConversationRequest(
        parent=f"projects/{billing_project}/locations/{location}",
        conversation_id=conversation_id,
        conversation=conversation,
    )
    try:
        data_chat_client.get_conversation(name=data_chat_client.conversation_path(
            billing_project, location, conversation_id))
        print(f"Conversation '{conversation_id}' already exists.")
    except Exception:
        response = data_chat_client.create_conversation(request=request)
        print("Conversation created successfully:")
        print(response)


conversation_id = "my_first_conversation"
setup_conversation(conversation_id=conversation_id)
You should see a message that the conversation has been created successfully.
6. Add utility functions
You are nearly ready to begin chatting with the agent. Before you do, let's add some utility functions to help format the messages so that it's easier to read and also render the visualizations. The CA API will send a vega specification that you can plot using the altair package:
# Utility functions for streaming and formatting responses
import altair as alt
import http.server
import pandas as pd
import proto
import socketserver
import threading

_server_thread = None
_httpd = None


# Prints a formatted section title
def display_section_title(text):
    print(f"\n--- {text.upper()} ---")


# Handles and displays data responses
def handle_data_response(resp):
    if "query" in resp:
        query = resp.query
        display_section_title("Retrieval query")
        print(f"Query name: {query.name}")
        print(f"Question: {query.question}")
        print("Data sources:")
        for datasource in query.datasources:
            display_datasource(datasource)
    elif "generated_sql" in resp:
        display_section_title("SQL generated")
        print(resp.generated_sql)
    elif "result" in resp:
        display_section_title("Data retrieved")
        fields = [field.name for field in resp.result.schema.fields]
        d = {field: [] for field in fields}
        for el in resp.result.data:
            for field in fields:
                d[field].append(el[field])
        print(pd.DataFrame(d))


# Starts a local web server to preview charts
def preview_in_browser(port: int = 8080):
    """Starts a web server in a background thread and waits for user to stop it."""
    global _server_thread, _httpd
    if _server_thread and _server_thread.is_alive():
        print(
            f"\n--> A new chart was generated. Refresh your browser at http://localhost:{port}")
        return
    Handler = http.server.SimpleHTTPRequestHandler
    socketserver.TCPServer.allow_reuse_address = True
    try:
        _httpd = socketserver.TCPServer(("", port), Handler)
    except OSError as e:
        print(f"❌ Could not start server on port {port}: {e}")
        return
    _server_thread = threading.Thread(target=_httpd.serve_forever)
    _server_thread.daemon = False
    _server_thread.start()
    print("\n" + "=" * 60)
    print(" 📈 CHART READY - PREVIEW IN BROWSER ".center(60))
    print("=" * 60)
    print(
        f"1. In the Cloud Shell toolbar, click 'Web Preview' and select port {port}.")
    print(f"2. Or, open your local browser to http://localhost:{port}")
    print("=" * 60)
    try:
        input(
            "\n--> Press Enter here after viewing all charts to shut down the server...\n\n")
    finally:
        print("Shutting down server...")
        _httpd.shutdown()
        _server_thread.join()
        _httpd, _server_thread = None, None
        print("Server stopped.")


# Handles chart responses
def handle_chart_response(resp, chart_generated_flag: list):
    def _value_to_dict(v):
        if isinstance(v, proto.marshal.collections.maps.MapComposite):
            return {k: _value_to_dict(v[k]) for k in v}
        elif isinstance(v, proto.marshal.collections.RepeatedComposite):
            return [_value_to_dict(el) for el in v]
        return v
    if "query" in resp:
        print(resp.query.instructions)
    elif "result" in resp:
        vega_config_dict = _value_to_dict(resp.result.vega_config)
        chart = alt.Chart.from_dict(vega_config_dict)
        chart_filename = "index.html"
        chart.save(chart_filename)
        if chart_generated_flag:
            chart_generated_flag[0] = True


# Displays the schema of a data source
def display_schema(data):
    fields = getattr(data, "fields")
    df = pd.DataFrame({
        "Column": [f.name for f in fields],
        "Type": [f.type for f in fields],
        "Description": [getattr(f, "description", "-") for f in fields],
        "Mode": [f.mode for f in fields],
    })
    print(df)


# Displays information about a BigQuery data source
def display_datasource(datasource):
    table_ref = datasource.bigquery_table_reference
    source_name = f"{table_ref.project_id}.{table_ref.dataset_id}.{table_ref.table_id}"
    print(source_name)
    display_schema(datasource.schema)


# Handles and displays schema resolution responses
def handle_schema_response(resp):
    if "query" in resp:
        print(resp.query.question)
    elif "result" in resp:
        display_section_title("Schema resolved")
        print("Data sources:")
        for datasource in resp.result.datasources:
            display_datasource(datasource)


# Handles and prints simple text responses
def handle_text_response(resp):
    parts = resp.parts
    print("".join(parts))


# Processes and displays different types of system messages
def show_message(msg, chart_generated_flag: list):
    m = msg.system_message
    if "text" in m:
        handle_text_response(getattr(m, "text"))
    elif "schema" in m:
        handle_schema_response(getattr(m, "schema"))
    elif "data" in m:
        handle_data_response(getattr(m, "data"))
    elif "chart" in m:
        handle_chart_response(getattr(m, "chart"), chart_generated_flag)
    print("\n")
7. Create a chat function
The final step is to create a chat function that you can reuse and call the show_message function for each chunk in the response stream:
def stream_chat_response(question: str):
    """
    Sends a chat request, processes the streaming response, and if a chart
    was generated, starts the preview server and waits for it to be closed.
    """
    data_chat_client = geminidataanalytics.DataChatServiceClient()
    chart_generated_flag = [False]
    messages = [
        geminidataanalytics.Message(
            user_message=geminidataanalytics.UserMessage(text=question)
        )
    ]
    conversation_reference = geminidataanalytics.ConversationReference(
        conversation=data_chat_client.conversation_path(
            billing_project, location, conversation_id
        ),
        data_agent_context=geminidataanalytics.DataAgentContext(
            data_agent=data_chat_client.data_agent_path(
                billing_project, location, data_agent_id
            ),
        ),
    )
    request = geminidataanalytics.ChatRequest(
        parent=f"projects/{billing_project}/locations/{location}",
        messages=messages,
        conversation_reference=conversation_reference,
    )
    stream = data_chat_client.chat(request=request)
    for response in stream:
        show_message(response, chart_generated_flag)
    if chart_generated_flag[0]:
        preview_in_browser()
The function stream_chat_response is now defined and ready to use with your prompts.
8. Start Chattin'
Question 1
You are now ready to begin asking questions! Let's see what this agent can do for starters:
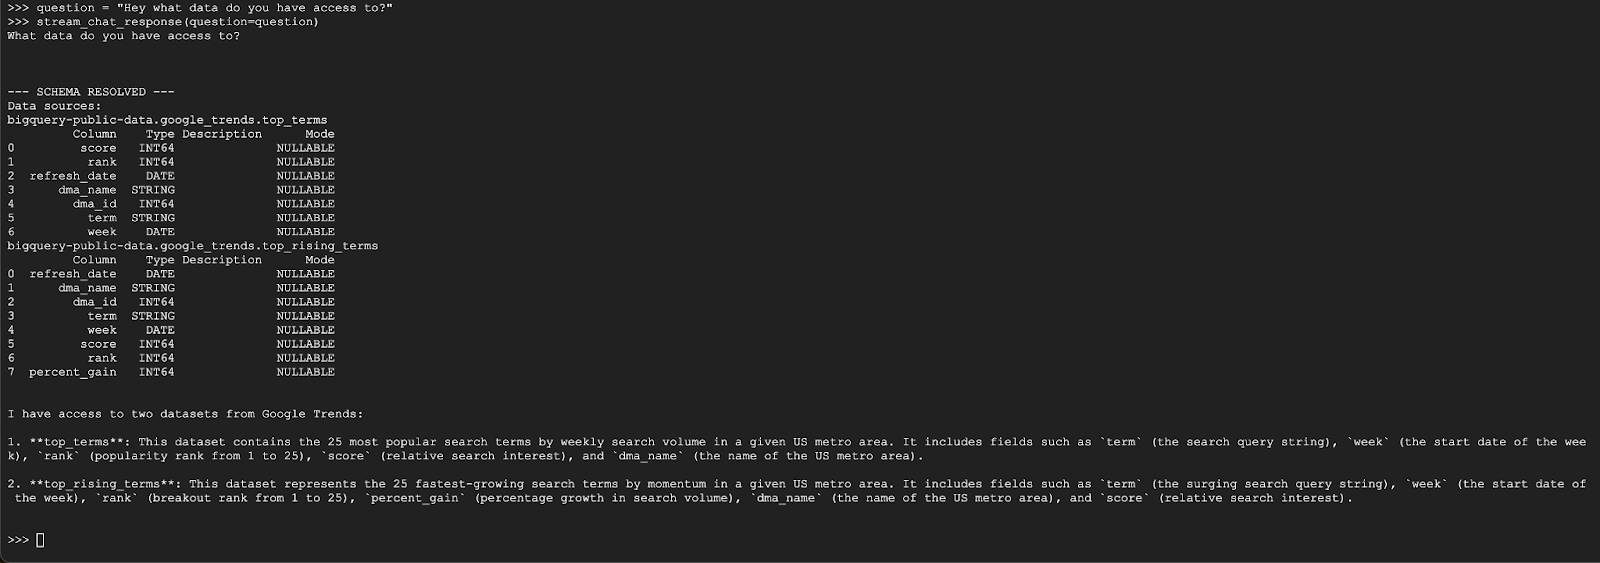
question = "Hey what data do you have access to?"
stream_chat_response(question=question)
The agent should respond with something similar to the below:
Question 2
Awesome, let's try and find more information about the latest popular search terms:
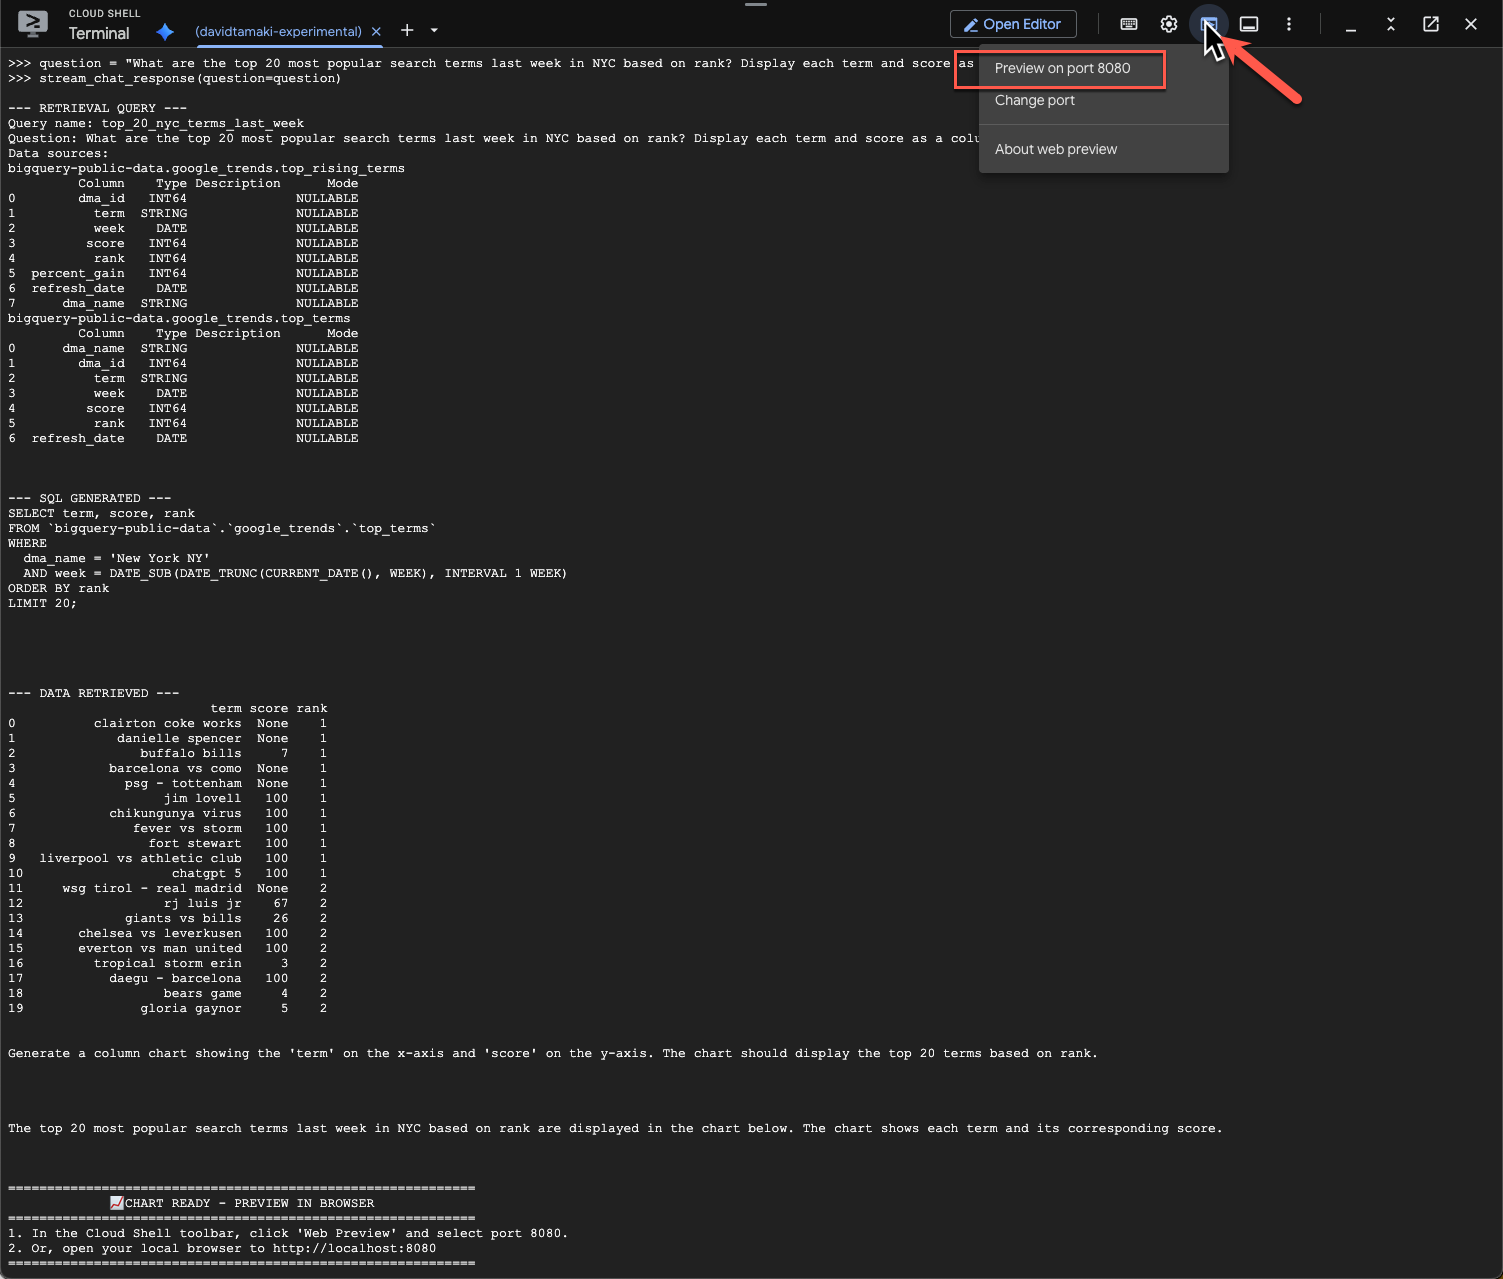
question = "What are the top 20 most popular search terms last week in NYC based on rank? Display each term and score as a column chart"
stream_chat_response(question=question)
This will take some time to run. You should see the agent run through various steps and stream updates, from retrieving the schema and metadata, writing the SQL query, getting the results, specifying visualization instructions, and summarizing the results.
To view the chart, go to the Cloud Shell toolbar, click ‘Web Preview' and select port 8080:
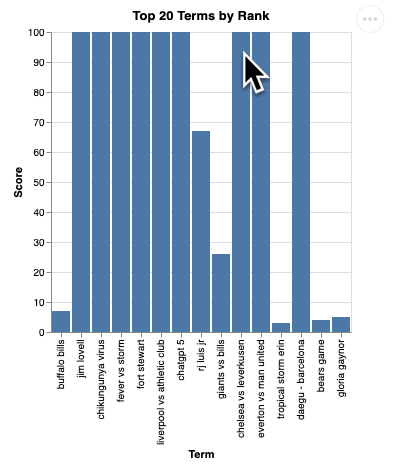
You should see a rendering of the visualization like this:
Press Enter to shut down the server and continue.
Question 3
Let's try a follow up question and dig deeper into these results:
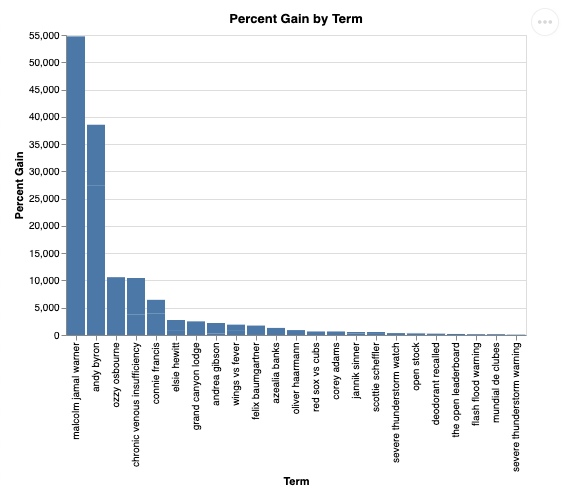
question = "What was the percent gain in growth for these search terms from the week before?"
stream_chat_response(question=question)
You should see something similar to the below. In this case the agent has generated a query to join the 2 tables to find the percentage gain. Note that your query may look slightly different:
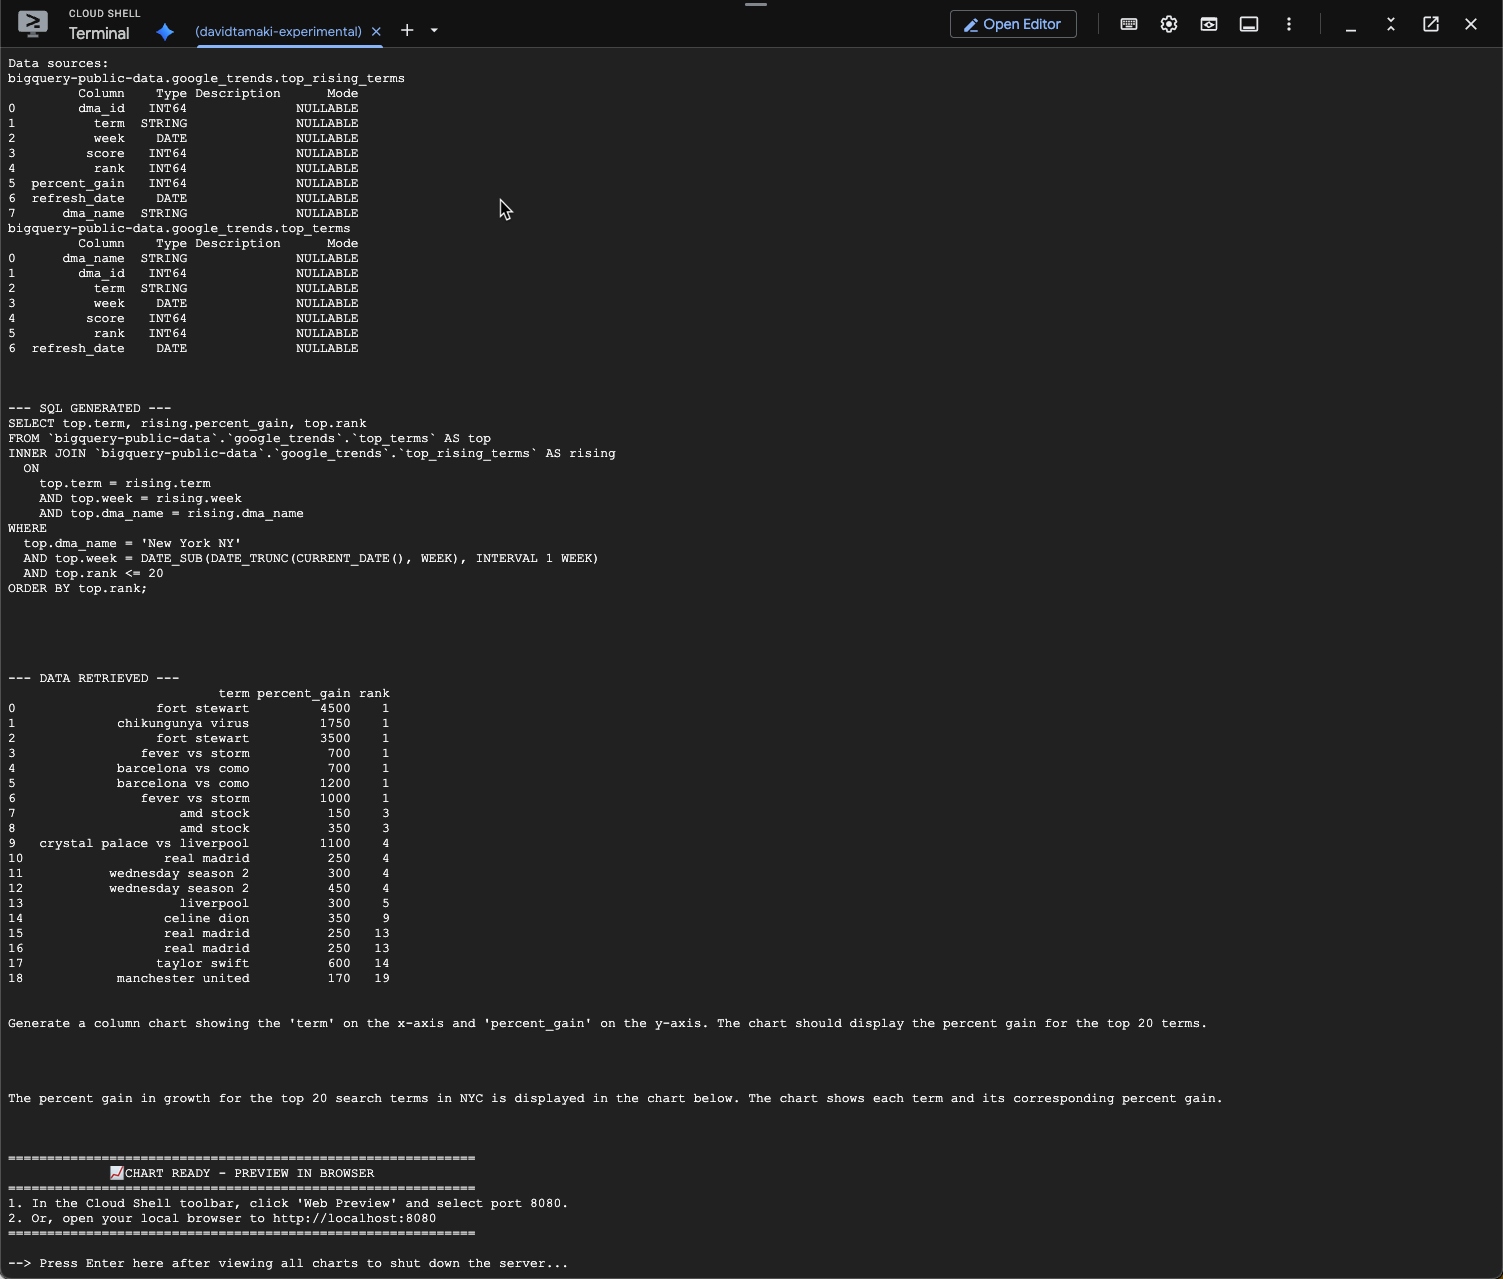
And visualized it will look like this:
9. Cleanup
Since this codelab doesn't involve any long-running products, simply stopping your active Python session by entering exit() in the terminal is sufficient.
Delete Project Folders and Files
If you want to remove the code from your Cloud Shell environment, use the following commands:
cd ~
rm -rf ca-api-codelab
Disable APIs
To disable the APIs that were enabled earlier, run this command
gcloud services disable geminidataanalytics.googleapis.com
gcloud services disable cloudaicompanion.googleapis.com
gcloud services disable bigquery.googleapis.com
10. Conclusion
Congratulations, you've successfully built a simple Conversational Analytics Agent using the CA SDK. Check out the reference materials to learn more!