
1. はじめに
この Codelab では、BigQuery データソースで Conversational Analytics(CA)API Python SDK を使用する方法について説明します。新しいエージェントの作成方法、会話状態管理の活用方法、API からレスポンスを送信してストリーミングする方法について説明します。
前提条件
- Google Cloud と Google Cloud コンソールの基本的な知識
- コマンドライン インターフェースと Cloud Shell の基本的なスキル
- Python プログラミングの基本的なスキル
学習内容
- BigQuery データソースで Conversational Analytics API Python SDK を使用する方法
- CA API を使用して新しいエージェントを作成する方法
- 会話状態管理を活用する方法
- API からレスポンスを送信してストリーミングする方法
必要なもの
- Google Cloud アカウントと Google Cloud プロジェクト
- ウェブブラウザ(Chrome など)
2. 設定と要件
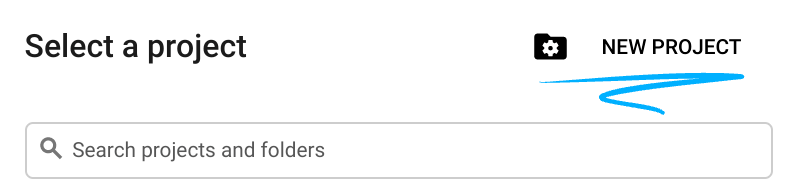
プロジェクトを選択する
- Google Cloud Console にログインして、プロジェクトを新規作成するか、既存のプロジェクトを再利用します。Gmail アカウントも Google Workspace アカウントもまだお持ちでない場合は、アカウントを作成してください。

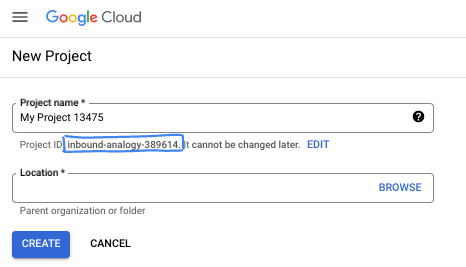
- プロジェクト名は、このプロジェクトの参加者に表示される名称です。Google API では使用されない文字列です。いつでも更新できます。
- プロジェクト ID は、すべての Google Cloud プロジェクトにおいて一意でなければならず、不変です(設定後は変更できません)。Cloud コンソールでは一意の文字列が自動生成されます。通常は、この内容を意識する必要はありません。ほとんどの Codelab では、プロジェクト ID(通常は
PROJECT_IDと識別されます)を参照する必要があります。生成された ID が好みではない場合は、ランダムに別の ID を生成できます。または、ご自身で試して、利用可能かどうかを確認することもできます。このステップ以降は変更できず、プロジェクトを通して同じ ID になります。 - なお、3 つ目の値として、一部の API が使用するプロジェクト番号があります。これら 3 つの値について詳しくは、こちらのドキュメントをご覧ください。
- 次に、Cloud のリソースや API を使用するために、Cloud コンソールで課金を有効にする必要があります。この Codelab の操作をすべて行って、費用が生じたとしても、少額です。このチュートリアルの終了後に請求が発生しないようにリソースをシャットダウンするには、作成したリソースを削除するか、プロジェクトを削除します。Google Cloud の新規ユーザーは、300 米ドル分の無料トライアル プログラムをご利用いただけます。
Cloud Shell を起動する
Google Cloud はノートパソコンからリモートで操作できますが、この Codelab では、Google Cloud Shell(Cloud 上で動作するコマンドライン環境)を使用します。
Google Cloud Console で、右上のツールバーにある Cloud Shell アイコンをクリックします。

プロビジョニングと環境への接続にはそれほど時間はかかりません。完了すると、次のように表示されます。
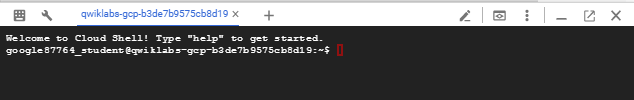
この仮想マシンには、必要な開発ツールがすべて用意されています。永続的なホーム ディレクトリが 5 GB 用意されており、Google Cloud で稼働します。そのため、ネットワークのパフォーマンスと認証機能が大幅に向上しています。この Codelab での作業はすべて、ブラウザ内から実行できます。インストールは不要です。
3. 始める前に
必要な API を有効にします。
Google Cloud サービスを使用するには、まずプロジェクトでそれぞれの API を有効にする必要があります。この Codelab では、次の Google Cloud サービスを使用します。
- Data Analytics API with Gemini
- Gemini for Google Cloud
- BigQuery API
これらのサービスを有効にするには、Cloud Shell ターミナルで次のコマンドを実行します。
gcloud services enable geminidataanalytics.googleapis.com
gcloud services enable cloudaicompanion.googleapis.com
gcloud services enable bigquery.googleapis.com
Python パッケージをインストールする
Python プロジェクトを開始する前に、仮想環境を作成することをおすすめします。これにより、プロジェクトの依存関係が分離され、他のプロジェクトやシステムのグローバル Python パッケージとの競合が回避されます。このセクションでは、Cloud Shell で pip がすでに使用可能になっているため、pip から uv をインストールします。
uv パッケージをインストールする
pip install uv
uv が正しくインストールされているかどうかを確認する
uv --version
予想される出力
出力行に uv が含まれている場合は、次のステップに進みます。バージョン番号は異なる場合があります。

仮想環境を作成してパッケージをインストールする
uv init ca-api-codelab
cd ca-api-codelab
uv venv --python 3.12
uv add google-cloud-geminidataanalytics pandas altair
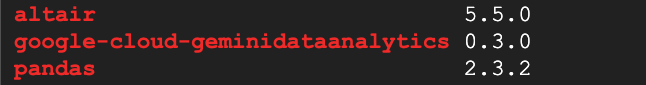
uv pip list | grep -E 'altair|pandas|google-cloud-geminidataanalytics'
予想される出力
3 つのパッケージを含む出力行が表示されたら、次のステップに進みます。バージョン番号は異なる場合があります。
Python を起動する
uv run python
画面は次のようになります。

4. エージェントを作成する
開発環境のセットアップが完了したら、Gemini Data Analytics API の基盤を構築します。SDK を使用すると、このプロセスが簡素化され、エージェントの作成に必要な構成はごくわずかになります。
変数を設定する
geminidataanalytics パッケージをインポートし、環境変数を設定します。
import os
from google.cloud import geminidataanalytics

data_agent_client = geminidataanalytics.DataAgentServiceClient()

location = "global"
billing_project = os.environ.get('DEVSHELL_PROJECT_ID')
data_agent_id = "google_trends_analytics_agent"
エージェントのシステム指示を設定する
CA API は BigQuery メタデータを読み取り、参照されているテーブルと列に関するコンテキストをより多く取得します。この公開データセットには列の説明がないため、YAML 形式の文字列としてエージェントに追加のコンテキストを指定できます。ベスト プラクティスと使用するテンプレートについては、ドキュメントを参照してください。
system_instruction = """
system_instruction:
  - You are a data analyst specializing in the Google Trends dataset.
  - When querying, always use the 'week' column for date-based filtering. This needs to be a Sunday. If you are doing week over week comparison, make sure you specify a date that is a Sunday.
  - The following columns should be ignored in all queries 'dma_id', 'refresh_date'
  - The 'dma_name' column represents the city and state for about 210 metro areas in the USA.
tables:
  top_terms:
    description: "Represents the 25 most popular search terms by weekly search volume in a given US metro area (DMA)."
    fields:
      term: "The search query string."
      week: "The start date of the week (Sunday) for which the ranking is valid."
      rank: "The term's popularity rank from 1 (most popular) to 25."
      score: "Relative search interest, where 100 is the peak popularity for the term in that week."
      dma_name: "The name of the US metro area, e.g., 'New York NY'."
  top_rising_terms:
    description: "Represents the 25 fastest-growing ('breakout') search terms by momentum in a given US metro area (DMA)."
    fields:
      term: "The surging search query string."
      week: "The start date of the week (Sunday) for which the ranking is valid."
      rank: "The term's breakout rank from 1 (top rising) to 25."
      percent_gain: "The percentage growth in search volume compared to the previous period."
      dma_name: "The name of the US metro area, e.g., 'Los Angeles CA'."
      score: "Relative search interest, where 100 is the peak popularity for the term in that week."
join_instructions:
  goal: "Find terms that are simultaneously popular and rising in the same week and metro area."
  method: "INNER JOIN the two tables on their common keys."
  keys:
    - "term"
    - "week"
    - "dma_name"
golden_queries:
  - natural_language_query: "Find all terms in the 'New York NY' area that were in both the top 25 and top 25 rising lists for the week of July 6th, 2025, and show their ranks and percent gain."
    sql_query: |
      SELECT
          top.term,
          top.rank AS top_25_rank,
          rising.rank AS rising_25_rank,
          rising.percent_gain
      FROM
          `bigquery-public-data.google_trends.top_terms` AS top
      INNER JOIN
          `bigquery-public-data.google_trends.top_rising_terms` AS rising
      ON
          top.term = rising.term
          AND top.week = rising.week
          AND top.dma_name = rising.dma_name
      WHERE
          top.week = '2025-07-06'
          AND top.dma_name = 'New York NY'
      ORDER BY
          top.rank;
"""
BigQuery テーブルのデータソースを設定する
これで、BigQuery テーブルのデータソースを設定できます。CA API は、配列内の BigQuery テーブルを受け入れます。
# BigQuery table data sources
bq_top = geminidataanalytics.BigQueryTableReference(
    project_id="bigquery-public-data", dataset_id="google_trends", table_id="top_terms"
)
bq_rising = geminidataanalytics.BigQueryTableReference(
    project_id="bigquery-public-data", dataset_id="google_trends", table_id="top_rising_terms"
)
datasource_references = geminidataanalytics.DatasourceReferences(
    bq=geminidataanalytics.BigQueryTableReferences(table_references=[bq_top, bq_rising]))
ステートフル チャットのコンテキストを設定する
公開されたコンテキストを使用して新しいエージェントを作成できます。これにより、システム指示、データソース参照、その他のオプションがまとめられます。
公開前に変更をテストして検証するための stagingContext を作成する機能があります。これにより、デベロッパーはチャット リクエストで contextVersion を指定して、データ エージェントにバージョン管理を追加できます。この Codelab では、直接公開します。
# Context setup for stateful chat
published_context = geminidataanalytics.Context(
    system_instruction=system_instruction,
    datasource_references=datasource_references,
    options=geminidataanalytics.ConversationOptions(
        analysis=geminidataanalytics.AnalysisOptions(
            python=geminidataanalytics.AnalysisOptions.Python(
                enabled=False
            )
        )
    ),
)

data_agent = geminidataanalytics.DataAgent(
    data_analytics_agent=geminidataanalytics.DataAnalyticsAgent(
        published_context=published_context
    ),
)

# Create the agent
data_agent_client.create_data_agent(request=geminidataanalytics.CreateDataAgentRequest(
    parent=f"projects/{billing_project}/locations/{location}",
    data_agent_id=data_agent_id,
    data_agent=data_agent,
))
エージェントを作成すると、次のような出力が表示されます。

エージェントを取得する
エージェントが作成されたことを確認するために、エージェントをテストします。
# Test the agent
request = geminidataanalytics.GetDataAgentRequest(
    name=data_agent_client.data_agent_path(
        billing_project, location, data_agent_id)
)
response = data_agent_client.get_data_agent(request=request)
print(response)
新しいエージェントのメタデータが表示されます。これには、システム指示とデータソースの作成時刻やエージェント コンテキストなどが含まれます。
5. 会話を作成する
これで、最初の会話を作成する準備が整いました。この Codelab では、エージェントとのステートフル チャットに会話参照を使用します。
参考までに、CA API には、さまざまな状態とエージェント管理オプションでチャットを行うためのさまざまな方法が用意されています。3 つのアプローチの概要は次のとおりです。
州名 | 会話の履歴 | エージェント | コード | 説明 | |
会話を参照してチャットする | ステートフル | API 管理 | はい | 既存の会話とその関連するエージェント コンテキストを参照するチャット メッセージを送信して、ステートフルな会話を継続します。マルチターンの会話の場合、Google Cloud が会話履歴を保存して管理します。 | |
データ エージェントを参照してチャットする | ステートレス | ユーザーが管理 | はい | コンテキストの保存済みデータ エージェントを参照するステートレス チャット メッセージを送信します。マルチターンの会話では、アプリケーションが会話履歴を管理し、各リクエストで会話履歴を提供する必要があります。 | |
インライン コンテキストを使用してチャットする | ステートレス | ユーザーが管理 | いいえ | 保存されたデータ エージェントは使用せず、リクエストでコンテキストを直接提供してステートレスなチャット メッセージを送信します。マルチターンの会話では、アプリケーションが会話履歴を管理し、各リクエストで会話履歴を提供する必要があります。 |
会話を設定し、会話に一意の ID を提供する関数を作成します。
def setup_conversation(conversation_id: str):
    data_chat_client = geminidataanalytics.DataChatServiceClient()
    conversation = geminidataanalytics.Conversation(
        agents=[data_chat_client.data_agent_path(
            billing_project, location, data_agent_id)],
    )
    request = geminidataanalytics.CreateConversationRequest(
        parent=f"projects/{billing_project}/locations/{location}",
        conversation_id=conversation_id,
        conversation=conversation,
    )
    try:
        data_chat_client.get_conversation(name=data_chat_client.conversation_path(
            billing_project, location, conversation_id))
        print(f"Conversation '{conversation_id}' already exists.")
    except Exception:
        response = data_chat_client.create_conversation(request=request)
        print("Conversation created successfully:")
        print(response)


conversation_id = "my_first_conversation"
setup_conversation(conversation_id=conversation_id)
会話が正常に作成されたことを示すメッセージが表示されます。
6. ユーティリティ関数を追加する
エージェントとのチャットを開始する準備がほぼ整いました。その前に、メッセージの形式を整えて読みやすくし、可視化をレンダリングするのに役立つユーティリティ関数を追加しましょう。CA API は、altair パッケージを使用してプロットできる vega 仕様を送信します。
# Utility functions for streaming and formatting responses
import altair as alt
import http.server
import pandas as pd
import proto
import socketserver
import threading

_server_thread = None
_httpd = None


# Prints a formatted section title
def display_section_title(text):
    print(f"\n--- {text.upper()} ---")


# Handles and displays data responses
def handle_data_response(resp):
    if "query" in resp:
        query = resp.query
        display_section_title("Retrieval query")
        print(f"Query name: {query.name}")
        print(f"Question: {query.question}")
        print("Data sources:")
        for datasource in query.datasources:
            display_datasource(datasource)
    elif "generated_sql" in resp:
        display_section_title("SQL generated")
        print(resp.generated_sql)
    elif "result" in resp:
        display_section_title("Data retrieved")
        fields = [field.name for field in resp.result.schema.fields]
        d = {field: [] for field in fields}
        for el in resp.result.data:
            for field in fields:
                d[field].append(el[field])
        print(pd.DataFrame(d))


# Starts a local web server to preview charts
def preview_in_browser(port: int = 8080):
    """Starts a web server in a background thread and waits for user to stop it."""
    global _server_thread, _httpd
    if _server_thread and _server_thread.is_alive():
        print(
            f"\n--> A new chart was generated. Refresh your browser at http://localhost:{port}")
        return
    Handler = http.server.SimpleHTTPRequestHandler
    socketserver.TCPServer.allow_reuse_address = True
    try:
        _httpd = socketserver.TCPServer(("", port), Handler)
    except OSError as e:
        print(f"❌ Could not start server on port {port}: {e}")
        return
    _server_thread = threading.Thread(target=_httpd.serve_forever)
    _server_thread.daemon = False
    _server_thread.start()
    print("\n" + "=" * 60)
    print(" 📈 CHART READY - PREVIEW IN BROWSER ".center(60))
    print("=" * 60)
    print(
        f"1. In the Cloud Shell toolbar, click 'Web Preview' and select port {port}.")
    print(f"2. Or, open your local browser to http://localhost:{port}")
    print("=" * 60)
    try:
        input(
            "\n--> Press Enter here after viewing all charts to shut down the server...\n\n")
    finally:
        print("Shutting down server...")
        _httpd.shutdown()
        _server_thread.join()
        _httpd, _server_thread = None, None
        print("Server stopped.")


# Handles chart responses
def handle_chart_response(resp, chart_generated_flag: list):
    def _value_to_dict(v):
        if isinstance(v, proto.marshal.collections.maps.MapComposite):
            return {k: _value_to_dict(v[k]) for k in v}
        elif isinstance(v, proto.marshal.collections.RepeatedComposite):
            return [_value_to_dict(el) for el in v]
        return v
    if "query" in resp:
        print(resp.query.instructions)
    elif "result" in resp:
        vega_config_dict = _value_to_dict(resp.result.vega_config)
        chart = alt.Chart.from_dict(vega_config_dict)
        chart_filename = "index.html"
        chart.save(chart_filename)
        if chart_generated_flag:
            chart_generated_flag[0] = True


# Displays the schema of a data source
def display_schema(data):
    fields = getattr(data, "fields")
    df = pd.DataFrame({
        "Column": [f.name for f in fields],
        "Type": [f.type for f in fields],
        "Description": [getattr(f, "description", "-") for f in fields],
        "Mode": [f.mode for f in fields],
    })
    print(df)


# Displays information about a BigQuery data source
def display_datasource(datasource):
    table_ref = datasource.bigquery_table_reference
    source_name = f"{table_ref.project_id}.{table_ref.dataset_id}.{table_ref.table_id}"
    print(source_name)
    display_schema(datasource.schema)


# Handles and displays schema resolution responses
def handle_schema_response(resp):
    if "query" in resp:
        print(resp.query.question)
    elif "result" in resp:
        display_section_title("Schema resolved")
        print("Data sources:")
        for datasource in resp.result.datasources:
            display_datasource(datasource)


# Handles and prints simple text responses
def handle_text_response(resp):
    parts = resp.parts
    print("".join(parts))


# Processes and displays different types of system messages
def show_message(msg, chart_generated_flag: list):
    m = msg.system_message
    if "text" in m:
        handle_text_response(getattr(m, "text"))
    elif "schema" in m:
        handle_schema_response(getattr(m, "schema"))
    elif "data" in m:
        handle_data_response(getattr(m, "data"))
    elif "chart" in m:
        handle_chart_response(getattr(m, "chart"), chart_generated_flag)
    print("\n")
7. チャット機能を作成する
最後のステップは、再利用可能なチャット関数を作成し、レスポンス ストリーム内の各チャンクに対して show_message 関数を呼び出すことです。
def stream_chat_response(question: str):
    """
    Sends a chat request, processes the streaming response, and if a chart
    was generated, starts the preview server and waits for it to be closed.
    """
    data_chat_client = geminidataanalytics.DataChatServiceClient()
    chart_generated_flag = [False]
    messages = [
        geminidataanalytics.Message(
            user_message=geminidataanalytics.UserMessage(text=question)
        )
    ]
    conversation_reference = geminidataanalytics.ConversationReference(
        conversation=data_chat_client.conversation_path(
            billing_project, location, conversation_id
        ),
        data_agent_context=geminidataanalytics.DataAgentContext(
            data_agent=data_chat_client.data_agent_path(
                billing_project, location, data_agent_id
            ),
        ),
    )
    request = geminidataanalytics.ChatRequest(
        parent=f"projects/{billing_project}/locations/{location}",
        messages=messages,
        conversation_reference=conversation_reference,
    )
    stream = data_chat_client.chat(request=request)
    for response in stream:
        show_message(response, chart_generated_flag)
    if chart_generated_flag[0]:
        preview_in_browser()
これで、関数 stream_chat_response が定義され、プロンプトで使用できるようになりました。
8. チャットを開始
問題 1
これで、質問を開始する準備が整いました。このエージェントが最初にできることは次のとおりです。
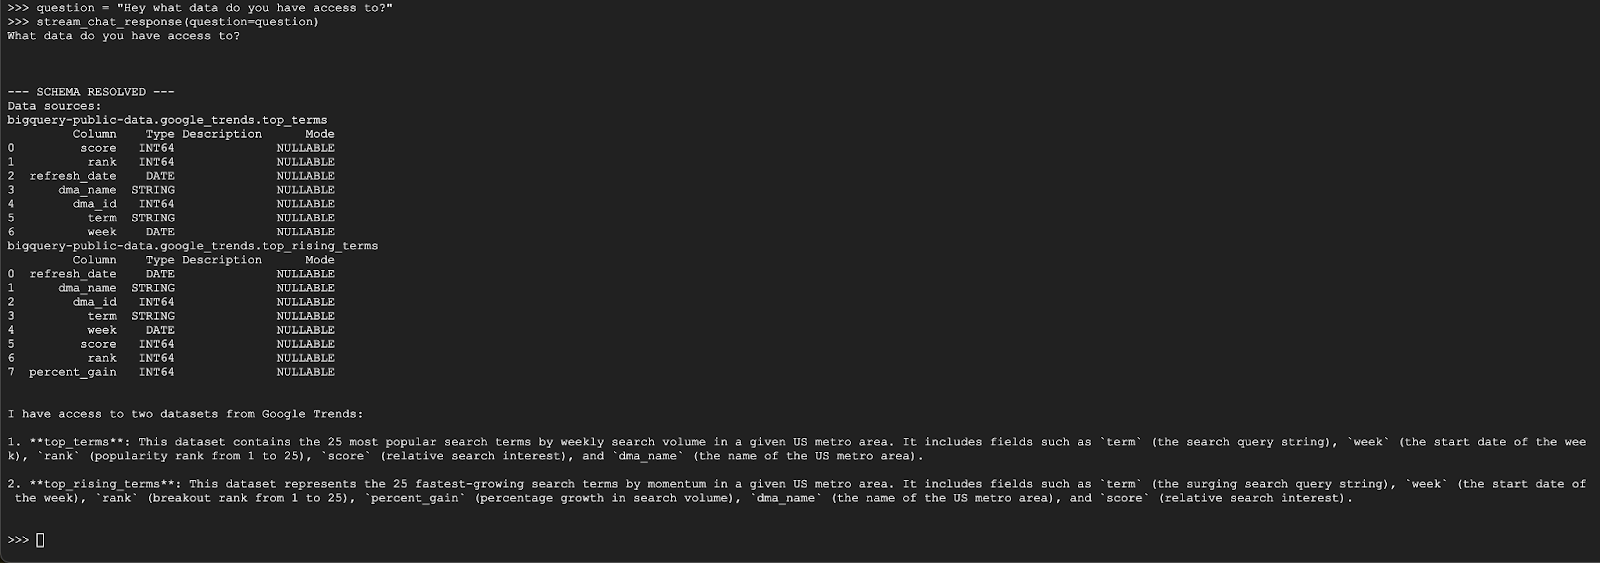
question = "Hey what data do you have access to?"
stream_chat_response(question=question)
エージェントは次のような回答をします。
問題 2
最新の人気の検索キーワードについて、さらに詳しく調べてみましょう。
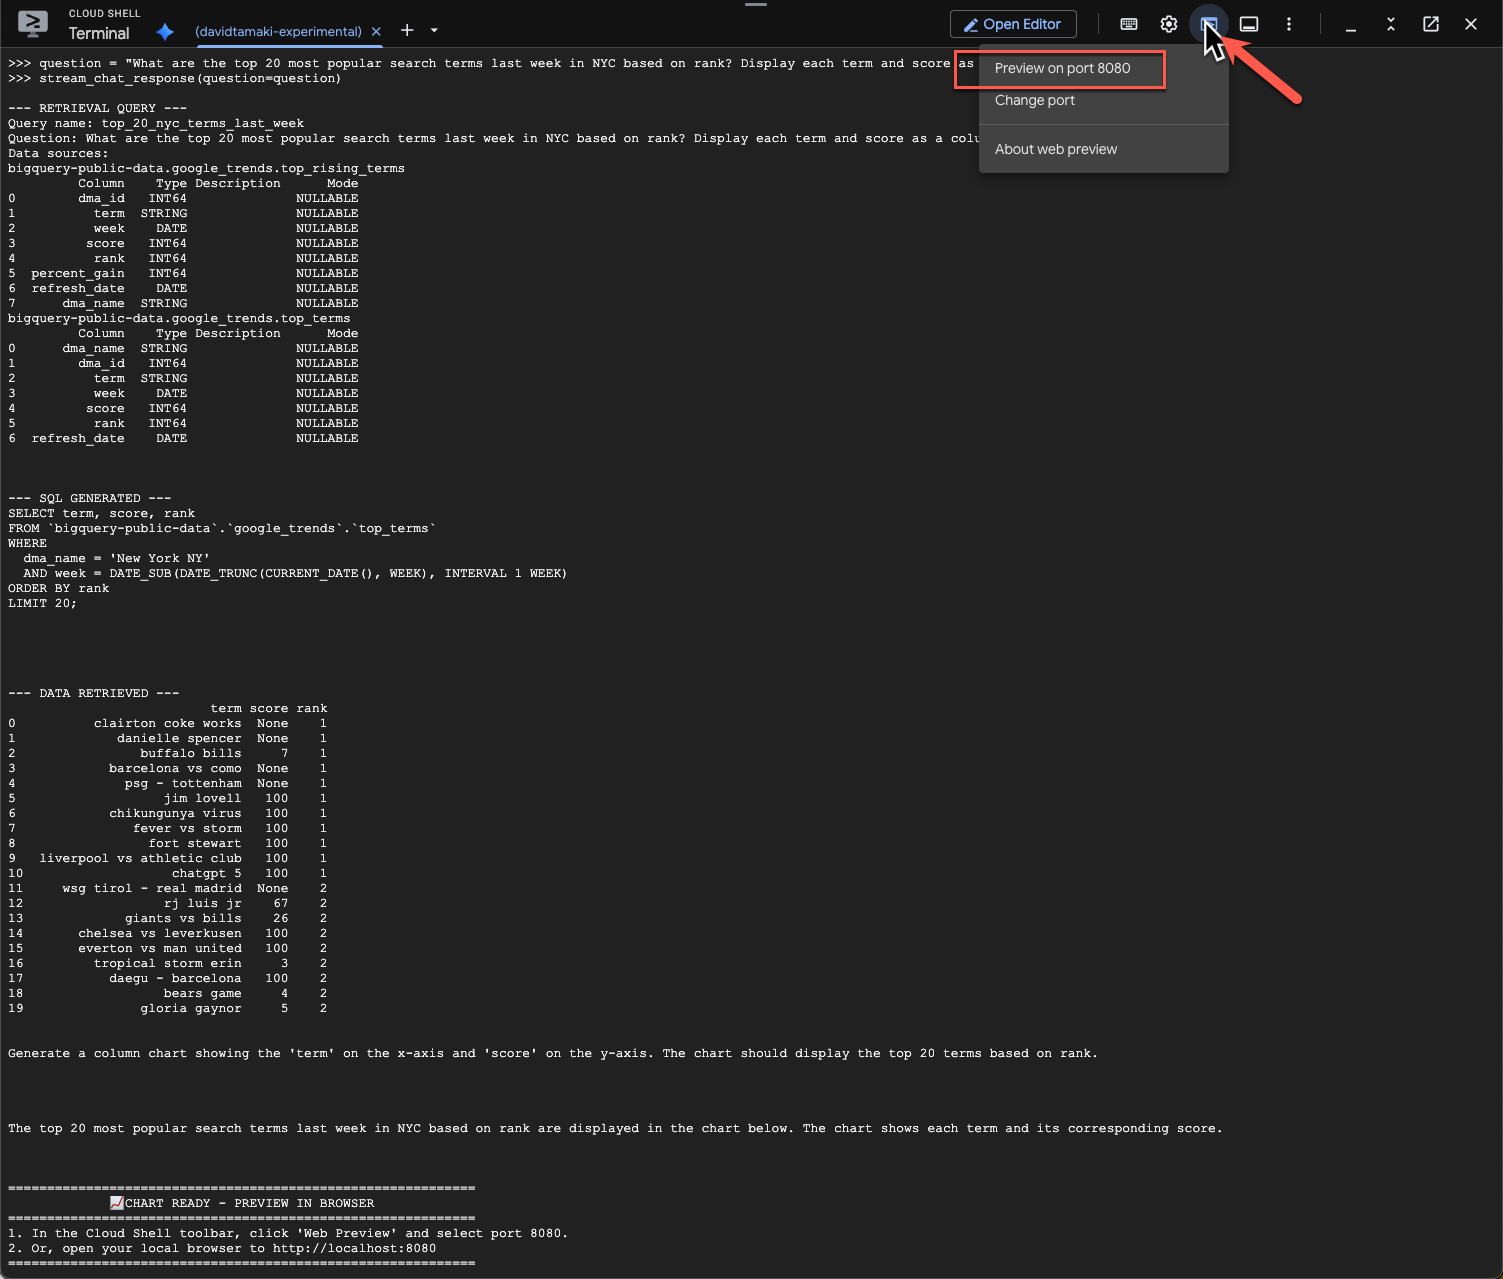
question = "What are the top 20 most popular search terms last week in NYC based on rank? Display each term and score as a column chart"
stream_chat_response(question=question)
このコマンドの実行にはしばらく時間がかかります。エージェントがさまざまな手順を実行し、スキーマとメタデータの取得、SQL クエリの作成、結果の取得、可視化手順の指定、結果の要約などの更新をストリーミングする様子が表示されます。
グラフを表示するには、Cloud Shell ツールバーで [ウェブでプレビュー] をクリックし、ポート 8080 を選択します。
次のようなビジュアリゼーションのレンダリングが表示されます。
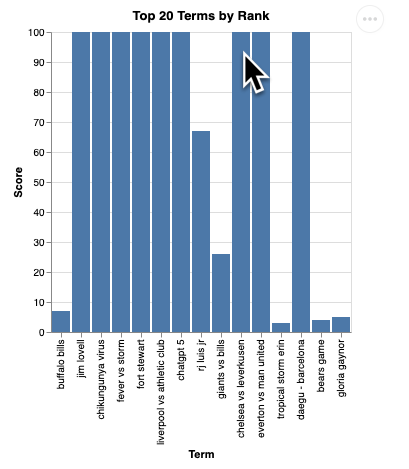
Enter キーを押してサーバーをシャットダウンし、続行します。
問題 3
フォローアップの質問をして、これらの結果をさらに詳しく見てみましょう。
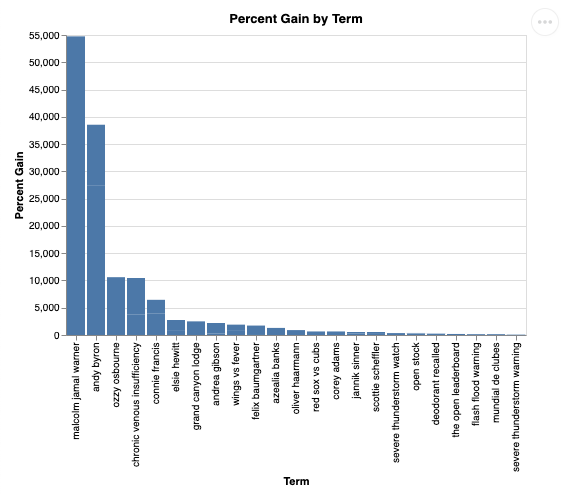
question = "What was the percent gain in growth for these search terms from the week before?"
stream_chat_response(question=question)
次のような内容が表示されます。この場合、エージェントは 2 つのテーブルを結合して増加率を求めるクエリを生成しました。クエリは次のように若干異なる場合があります。
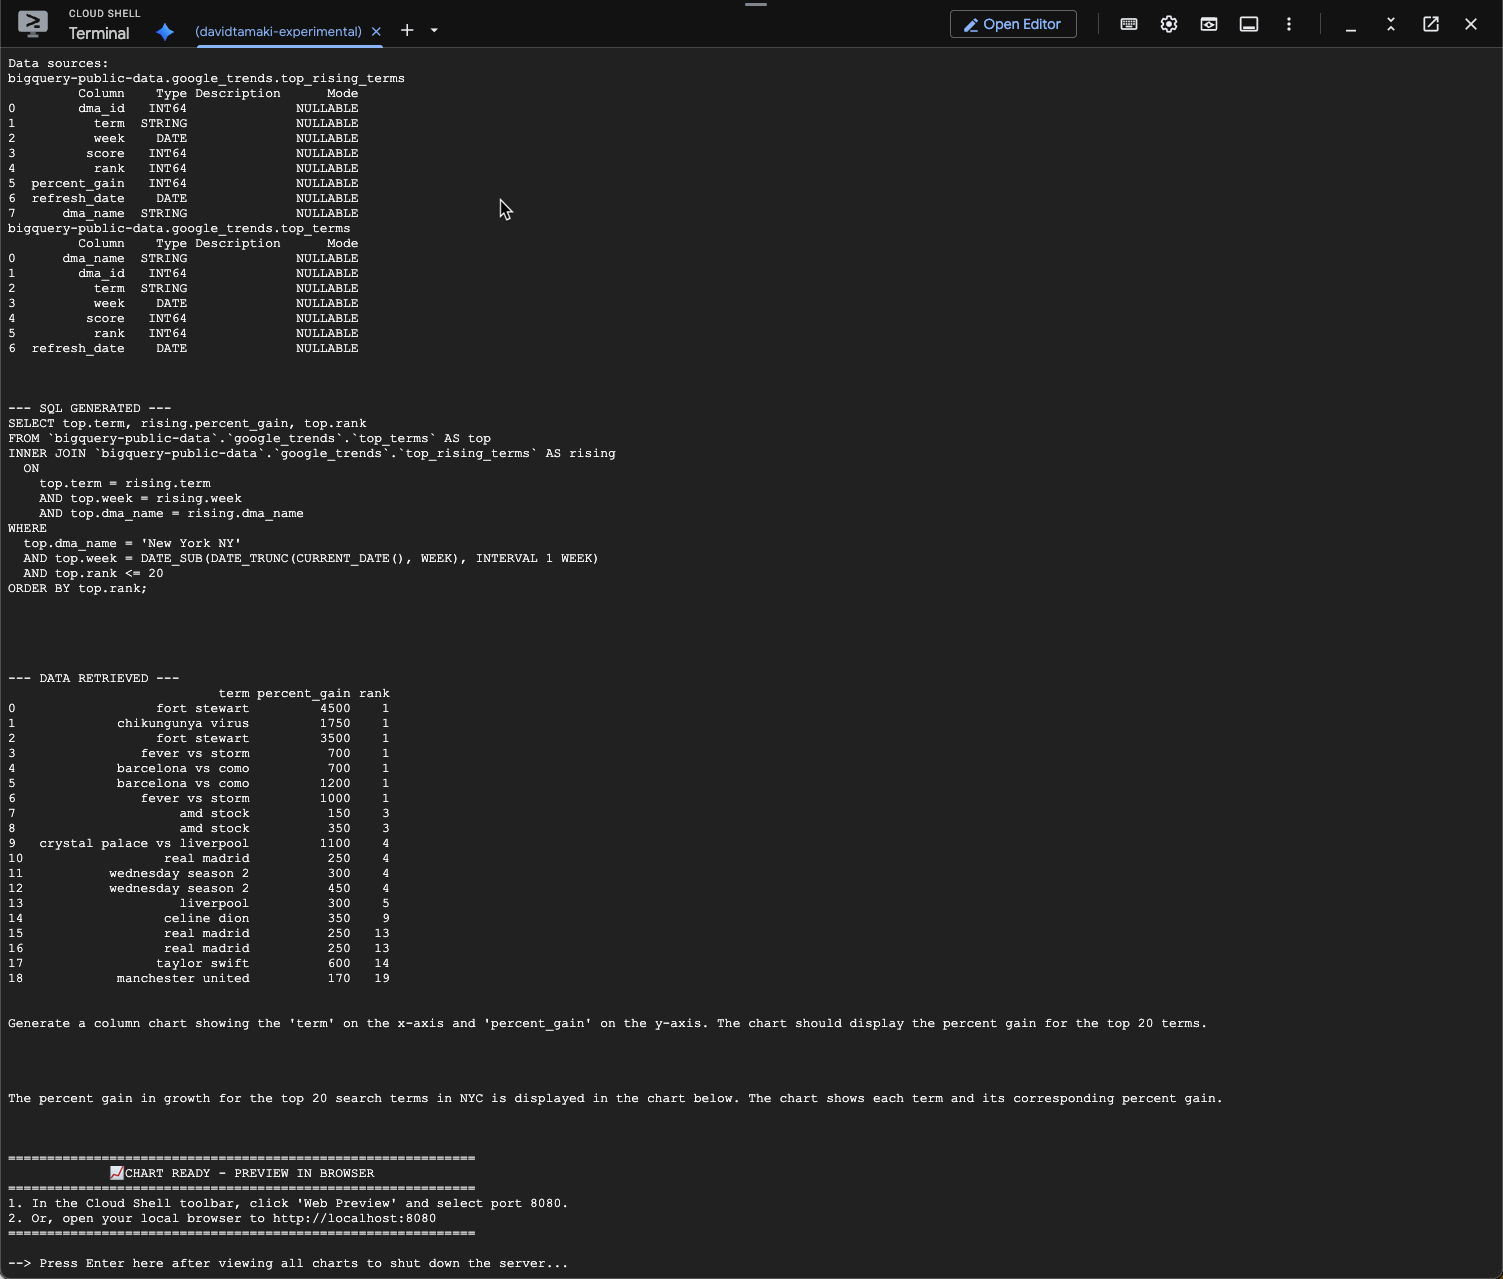
可視化すると次のようになります。
9. クリーンアップ
この Codelab には長時間実行されるプロダクトは含まれていないため、ターミナルに exit() と入力してアクティブな Python セッションを停止するだけで十分です。
プロジェクトのフォルダとファイルを削除する
Cloud Shell 環境からコードを削除する場合は、次のコマンドを使用します。
cd ~
rm -rf ca-api-codelab
API を無効にする
以前に有効にした API を無効にするには、次のコマンドを実行します。
gcloud services disable geminidataanalytics.googleapis.com
gcloud services disable cloudaicompanion.googleapis.com
gcloud services disable bigquery.googleapis.com
10. まとめ
お疲れさまでした。これで、CA SDK を使用してシンプルな会話分析エージェントを作成できました。詳細については、参考資料をご覧ください。