
1. 소개
이 Codelab에서는 BigQuery 데이터 소스와 함께 대화형 분석 (CA) API Python SDK를 사용하는 방법을 알아봅니다. 새 에이전트를 만드는 방법, 대화 상태 관리를 활용하는 방법, API에서 응답을 보내고 스트리밍하는 방법을 알아봅니다.
기본 요건
- Google Cloud 및 Google Cloud 콘솔에 대한 기본적인 이해
- 명령줄 인터페이스 및 Cloud Shell의 기본 기술
- Python 프로그래밍에 대한 기본적인 숙련도
학습할 내용
- BigQuery 데이터 소스와 함께 Conversational Analytics API Python SDK를 사용하는 방법
- CA API를 사용하여 새 에이전트를 만드는 방법
- 대화 상태 관리 활용 방법
- API에서 응답을 전송하고 스트리밍하는 방법
필요한 항목
- Google Cloud 계정 및 Google Cloud 프로젝트
- 웹브라우저(예: Chrome)
2. 설정 및 요건
프로젝트 선택
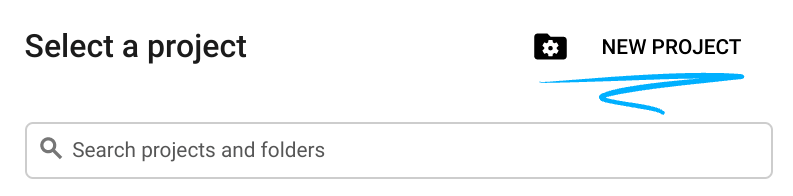
- Google Cloud Console에 로그인하여 새 프로젝트를 만들거나 기존 프로젝트를 재사용합니다. 아직 Gmail이나 Google Workspace 계정이 없는 경우 계정을 만들어야 합니다.

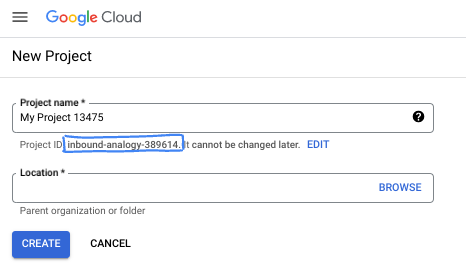
- 프로젝트 이름은 이 프로젝트 참가자의 표시 이름입니다. 이는 Google API에서 사용하지 않는 문자열이며 언제든지 업데이트할 수 있습니다.
- 프로젝트 ID는 모든 Google Cloud 프로젝트에서 고유하며, 변경할 수 없습니다(설정된 후에는 변경할 수 없음). Cloud 콘솔은 고유한 문자열을 자동으로 생성합니다. 일반적으로는 신경 쓰지 않아도 됩니다. 대부분의 Codelab에서는 프로젝트 ID (일반적으로
PROJECT_ID로 식별됨)를 참조해야 합니다. 생성된 ID가 마음에 들지 않으면 다른 임의 ID를 생성할 수 있습니다. 또는 직접 시도해 보고 사용 가능한지 확인할 수도 있습니다. 이 단계 이후에는 변경할 수 없으며 프로젝트 기간 동안 유지됩니다. - 참고로 세 번째 값은 일부 API에서 사용하는 프로젝트 번호입니다. 이 세 가지 값에 대한 자세한 내용은 문서를 참고하세요.
- 다음으로 Cloud 리소스/API를 사용하려면 Cloud 콘솔에서 결제를 사용 설정해야 합니다. 이 Codelab 실행에는 많은 비용이 들지 않습니다. 이 튜토리얼이 끝난 후에 요금이 청구되지 않도록 리소스를 종료하려면 만든 리소스 또는 프로젝트를 삭제하면 됩니다. Google Cloud 신규 사용자는 300달러(USD) 상당의 무료 체험판 프로그램에 참여할 수 있습니다.
Cloud Shell 시작
Google Cloud를 노트북에서 원격으로 실행할 수 있지만, 이 Codelab에서는 Cloud에서 실행되는 명령줄 환경인 Google Cloud Shell을 사용합니다.
Google Cloud Console의 오른쪽 상단 툴바에 있는 Cloud Shell 아이콘을 클릭합니다.

환경을 프로비저닝하고 연결하는 데 몇 분 정도 소요됩니다. 완료되면 다음과 같이 표시됩니다.
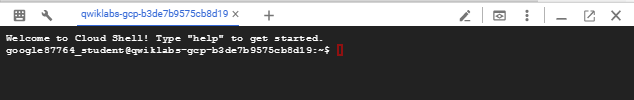
가상 머신에는 필요한 개발 도구가 모두 들어있습니다. 영구적인 5GB 홈 디렉터리를 제공하고 Google Cloud에서 실행되므로 네트워크 성능과 인증이 크게 개선됩니다. 이 Codelab의 모든 작업은 브라우저 내에서 수행할 수 있습니다. 아무것도 설치할 필요가 없습니다.
3. 시작하기 전에
필요한 API 사용 설정
Google Cloud 서비스를 사용하려면 먼저 프로젝트에 대해 해당 API를 활성화해야 합니다. 이 Codelab에서는 다음 Google Cloud 서비스를 사용합니다.
- Gemini 기반 Data Analytics API
- Google Cloud를 위한 Gemini
- BigQuery API
이러한 서비스를 사용 설정하려면 Cloud Shell 터미널에서 다음 명령어를 실행합니다.
gcloud services enable geminidataanalytics.googleapis.com
gcloud services enable cloudaicompanion.googleapis.com
gcloud services enable bigquery.googleapis.com
Python 패키지 설치
Python 프로젝트를 시작하기 전에 가상 환경을 만드는 것이 좋습니다. 이렇게 하면 프로젝트의 종속 항목이 격리되어 다른 프로젝트나 시스템의 전역 Python 패키지와의 충돌을 방지할 수 있습니다. 이 섹션에서는 Cloud Shell에 pip가 이미 제공되므로 pip에서 uv를 설치합니다.
uv 패키지 설치
pip install uv
uv가 올바르게 설치되었는지 확인
uv --version
예상 출력
uv가 포함된 출력 줄이 표시되면 다음 단계로 진행해도 됩니다. 버전 번호는 다를 수 있습니다.

가상 환경 생성 및 패키지 설치
uv init ca-api-codelab
cd ca-api-codelab
uv venv --python 3.12
uv add google-cloud-geminidataanalytics pandas altair
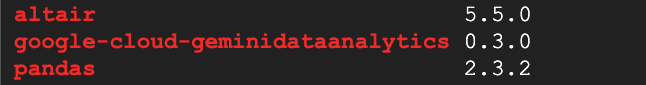
uv pip list | grep -E 'altair|pandas|google-cloud-geminidataanalytics'
예상 출력
세 패키지가 포함된 출력 줄이 표시되면 다음 단계로 진행해도 됩니다. 버전 번호는 다를 수 있습니다.
Python 시작
uv run python
화면에는 다음과 같이 표시됩니다.

4. 에이전트 만들기
이제 개발 환경이 설정되었으므로 Gemini Data Analytics API의 기반을 마련할 차례입니다. SDK는 이 프로세스를 간소화하여 몇 가지 필수 구성만으로 에이전트를 만들 수 있습니다.
변수 설정
geminidataanalytics 패키지를 가져오고 환경 변수를 설정합니다.
import os
from google.cloud import geminidataanalytics

data_agent_client = geminidataanalytics.DataAgentServiceClient()

location = "global"
billing_project = os.environ.get('DEVSHELL_PROJECT_ID')
data_agent_id = "google_trends_analytics_agent"
에이전트의 시스템 요청 사항 설정
CA API는 BigQuery 메타데이터를 읽어 참조되는 테이블과 열에 관한 추가 컨텍스트를 파악합니다. 이 공개 데이터 세트에는 열 설명이 없으므로 YAML 형식 문자열로 에이전트에 추가 컨텍스트를 제공할 수 있습니다. 권장사항과 사용할 템플릿은 문서를 참고하세요.
system_instruction = """
system_instruction:
  - You are a data analyst specializing in the Google Trends dataset.
  - When querying, always use the 'week' column for date-based filtering. This needs to be a Sunday. If you are doing week over week comparison, make sure you specify a date that is a Sunday.
  - The following columns should be ignored in all queries 'dma_id', 'refresh_date'
  - The 'dma_name' column represents the city and state for about 210 metro areas in the USA.
tables:
  top_terms:
    description: "Represents the 25 most popular search terms by weekly search volume in a given US metro area (DMA)."
    fields:
      term: "The search query string."
      week: "The start date of the week (Sunday) for which the ranking is valid."
      rank: "The term's popularity rank from 1 (most popular) to 25."
      score: "Relative search interest, where 100 is the peak popularity for the term in that week."
      dma_name: "The name of the US metro area, e.g., 'New York NY'."
  top_rising_terms:
    description: "Represents the 25 fastest-growing ('breakout') search terms by momentum in a given US metro area (DMA)."
    fields:
      term: "The surging search query string."
      week: "The start date of the week (Sunday) for which the ranking is valid."
      rank: "The term's breakout rank from 1 (top rising) to 25."
      percent_gain: "The percentage growth in search volume compared to the previous period."
      dma_name: "The name of the US metro area, e.g., 'Los Angeles CA'."
      score: "Relative search interest, where 100 is the peak popularity for the term in that week."
join_instructions:
  goal: "Find terms that are simultaneously popular and rising in the same week and metro area."
  method: "INNER JOIN the two tables on their common keys."
  keys:
    - "term"
    - "week"
    - "dma_name"
golden_queries:
  - natural_language_query: "Find all terms in the 'New York NY' area that were in both the top 25 and top 25 rising lists for the week of July 6th, 2025, and show their ranks and percent gain."
    sql_query: |
      SELECT
          top.term,
          top.rank AS top_25_rank,
          rising.rank AS rising_25_rank,
          rising.percent_gain
      FROM
          `bigquery-public-data.google_trends.top_terms` AS top
      INNER JOIN
          `bigquery-public-data.google_trends.top_rising_terms` AS rising
      ON
          top.term = rising.term
          AND top.week = rising.week
          AND top.dma_name = rising.dma_name
      WHERE
          top.week = '2025-07-06'
          AND top.dma_name = 'New York NY'
      ORDER BY
          top.rank;
"""
BigQuery 테이블 데이터 소스 설정
이제 BigQuery 테이블 데이터 소스를 설정할 수 있습니다. CA API는 배열의 BigQuery 테이블을 허용합니다.
# BigQuery table data sources
bq_top = geminidataanalytics.BigQueryTableReference(
    project_id="bigquery-public-data", dataset_id="google_trends", table_id="top_terms"
)
bq_rising = geminidataanalytics.BigQueryTableReference(
    project_id="bigquery-public-data", dataset_id="google_trends", table_id="top_rising_terms"
)
datasource_references = geminidataanalytics.DatasourceReferences(
    bq=geminidataanalytics.BigQueryTableReferences(table_references=[bq_top, bq_rising]))
스테이트풀 채팅의 컨텍스트 설정
게시된 컨텍스트를 사용하여 새 에이전트를 만들 수 있습니다. 컨텍스트는 시스템 요청 사항, 데이터 소스 참조, 기타 옵션을 함께 가져옵니다.
게시 전에 변경사항을 테스트하고 검증하기 위해 stagingContext를 만드는 기능이 있습니다. 이를 통해 개발자는 채팅 요청에서 contextVersion을 지정하여 데이터 에이전트에 버전 관리를 추가할 수 있습니다. 이 Codelab에서는 직접 게시합니다.
# Context setup for stateful chat
published_context = geminidataanalytics.Context(
    system_instruction=system_instruction,
    datasource_references=datasource_references,
    options=geminidataanalytics.ConversationOptions(
        analysis=geminidataanalytics.AnalysisOptions(
            python=geminidataanalytics.AnalysisOptions.Python(
                enabled=False
            )
        )
    ),
)

data_agent = geminidataanalytics.DataAgent(
    data_analytics_agent=geminidataanalytics.DataAnalyticsAgent(
        published_context=published_context
    ),
)

# Create the agent
data_agent_client.create_data_agent(request=geminidataanalytics.CreateDataAgentRequest(
    parent=f"projects/{billing_project}/locations/{location}",
    data_agent_id=data_agent_id,
    data_agent=data_agent,
))
에이전트를 만든 후에는 다음과 비슷한 출력이 표시됩니다.

에이전트 가져오기
에이전트가 생성되었는지 테스트해 보겠습니다.
# Test the agent
request = geminidataanalytics.GetDataAgentRequest(
    name=data_agent_client.data_agent_path(
        billing_project, location, data_agent_id)
)
response = data_agent_client.get_data_agent(request=request)
print(response)
새 에이전트에 메타데이터가 표시됩니다. 여기에는 시스템 요청 사항 및 데이터 소스의 생성 시간과 에이전트 컨텍스트가 포함됩니다.
5. 대화 만들기
이제 첫 번째 대화를 만들 준비가 되었습니다. 이 Codelab에서는 에이전트와의 스테이트풀(Stateful) 채팅에 대화 참조를 사용합니다.
참고로 CA API는 다양한 상태 및 상담사 관리 옵션으로 채팅할 수 있는 다양한 방법을 제공합니다. 3가지 접근 방식을 간략하게 요약하면 다음과 같습니다.
상태 | 대화 기록 | Agent | 코드 | 설명 | |
대화 참조를 사용하여 채팅 | 스테이트풀(Stateful) | API 관리 | 예 | 기존 대화와 연결된 에이전트 컨텍스트를 참조하는 채팅 메시지를 전송하여 스테이트풀(Stateful) 대화를 계속합니다. 멀티턴 대화의 경우 Google Cloud에서 대화 기록을 저장하고 관리합니다. | |
데이터 에이전트 참조를 사용하여 채팅 | 스테이트리스(Stateless) | 사용자 관리 | 예 | 컨텍스트를 위해 저장된 데이터 에이전트를 참조하는 스테이트리스(Stateless) 채팅 메시지를 전송합니다. 멀티턴 대화의 경우 애플리케이션이 각 요청과 함께 대화 기록을 관리하고 제공해야 합니다. | |
인라인 컨텍스트를 사용하여 채팅 | 스테이트리스(Stateless) | 사용자 관리 | 아니요 | 저장된 데이터 에이전트를 사용하지 않고 요청에 모든 컨텍스트를 직접 제공하여 스테이트리스(Stateless) 채팅 메시지를 전송합니다. 멀티턴 대화의 경우 애플리케이션이 각 요청과 함께 대화 기록을 관리하고 제공해야 합니다. |
대화를 설정하고 대화의 고유 ID를 제공하는 함수를 만듭니다.
def setup_conversation(conversation_id: str):
    data_chat_client = geminidataanalytics.DataChatServiceClient()
    conversation = geminidataanalytics.Conversation(
        agents=[data_chat_client.data_agent_path(
            billing_project, location, data_agent_id)],
    )
    request = geminidataanalytics.CreateConversationRequest(
        parent=f"projects/{billing_project}/locations/{location}",
        conversation_id=conversation_id,
        conversation=conversation,
    )
    try:
        data_chat_client.get_conversation(name=data_chat_client.conversation_path(
            billing_project, location, conversation_id))
        print(f"Conversation '{conversation_id}' already exists.")
    except Exception:
        response = data_chat_client.create_conversation(request=request)
        print("Conversation created successfully:")
        print(response)


conversation_id = "my_first_conversation"
setup_conversation(conversation_id=conversation_id)
대화가 생성되었다는 메시지가 표시됩니다.
6. 유틸리티 함수 추가
상담사와 채팅을 시작할 준비가 거의 다 되었습니다. 그 전에 메시지를 더 쉽게 읽을 수 있도록 서식을 지정하고 시각화도 렌더링하는 데 도움이 되는 유틸리티 함수를 추가해 보겠습니다. CA API는 altair 패키지를 사용하여 플롯할 수 있는 vega 사양을 전송합니다.
# Utility functions for streaming and formatting responses
import altair as alt
import http.server
import pandas as pd
import proto
import socketserver
import threading

_server_thread = None
_httpd = None


# Prints a formatted section title
def display_section_title(text):
    print(f"\n--- {text.upper()} ---")


# Handles and displays data responses
def handle_data_response(resp):
    if "query" in resp:
        query = resp.query
        display_section_title("Retrieval query")
        print(f"Query name: {query.name}")
        print(f"Question: {query.question}")
        print("Data sources:")
        for datasource in query.datasources:
            display_datasource(datasource)
    elif "generated_sql" in resp:
        display_section_title("SQL generated")
        print(resp.generated_sql)
    elif "result" in resp:
        display_section_title("Data retrieved")
        fields = [field.name for field in resp.result.schema.fields]
        d = {field: [] for field in fields}
        for el in resp.result.data:
            for field in fields:
                d[field].append(el[field])
        print(pd.DataFrame(d))


# Starts a local web server to preview charts
def preview_in_browser(port: int = 8080):
    """Starts a web server in a background thread and waits for user to stop it."""
    global _server_thread, _httpd
    if _server_thread and _server_thread.is_alive():
        print(
            f"\n--> A new chart was generated. Refresh your browser at http://localhost:{port}")
        return
    Handler = http.server.SimpleHTTPRequestHandler
    socketserver.TCPServer.allow_reuse_address = True
    try:
        _httpd = socketserver.TCPServer(("", port), Handler)
    except OSError as e:
        print(f"❌ Could not start server on port {port}: {e}")
        return
    _server_thread = threading.Thread(target=_httpd.serve_forever)
    _server_thread.daemon = False
    _server_thread.start()
    print("\n" + "=" * 60)
    print(" 📈 CHART READY - PREVIEW IN BROWSER ".center(60))
    print("=" * 60)
    print(
        f"1. In the Cloud Shell toolbar, click 'Web Preview' and select port {port}.")
    print(f"2. Or, open your local browser to http://localhost:{port}")
    print("=" * 60)
    try:
        input(
            "\n--> Press Enter here after viewing all charts to shut down the server...\n\n")
    finally:
        print("Shutting down server...")
        _httpd.shutdown()
        _server_thread.join()
        _httpd, _server_thread = None, None
        print("Server stopped.")


# Handles chart responses
def handle_chart_response(resp, chart_generated_flag: list):
    def _value_to_dict(v):
        if isinstance(v, proto.marshal.collections.maps.MapComposite):
            return {k: _value_to_dict(v[k]) for k in v}
        elif isinstance(v, proto.marshal.collections.RepeatedComposite):
            return [_value_to_dict(el) for el in v]
        return v
    if "query" in resp:
        print(resp.query.instructions)
    elif "result" in resp:
        vega_config_dict = _value_to_dict(resp.result.vega_config)
        chart = alt.Chart.from_dict(vega_config_dict)
        chart_filename = "index.html"
        chart.save(chart_filename)
        if chart_generated_flag:
            chart_generated_flag[0] = True


# Displays the schema of a data source
def display_schema(data):
    fields = getattr(data, "fields")
    df = pd.DataFrame({
        "Column": [f.name for f in fields],
        "Type": [f.type for f in fields],
        "Description": [getattr(f, "description", "-") for f in fields],
        "Mode": [f.mode for f in fields],
    })
    print(df)


# Displays information about a BigQuery data source
def display_datasource(datasource):
    table_ref = datasource.bigquery_table_reference
    source_name = f"{table_ref.project_id}.{table_ref.dataset_id}.{table_ref.table_id}"
    print(source_name)
    display_schema(datasource.schema)


# Handles and displays schema resolution responses
def handle_schema_response(resp):
    if "query" in resp:
        print(resp.query.question)
    elif "result" in resp:
        display_section_title("Schema resolved")
        print("Data sources:")
        for datasource in resp.result.datasources:
            display_datasource(datasource)


# Handles and prints simple text responses
def handle_text_response(resp):
    parts = resp.parts
    print("".join(parts))


# Processes and displays different types of system messages
def show_message(msg, chart_generated_flag: list):
    m = msg.system_message
    if "text" in m:
        handle_text_response(getattr(m, "text"))
    elif "schema" in m:
        handle_schema_response(getattr(m, "schema"))
    elif "data" in m:
        handle_data_response(getattr(m, "data"))
    elif "chart" in m:
        handle_chart_response(getattr(m, "chart"), chart_generated_flag)
    print("\n")
7. 채팅 기능 만들기
마지막 단계는 재사용할 수 있는 채팅 함수를 만들고 응답 스트림의 각 청크에 대해 show_message 함수를 호출하는 것입니다.
def stream_chat_response(question: str):
    """
    Sends a chat request, processes the streaming response, and if a chart
    was generated, starts the preview server and waits for it to be closed.
    """
    data_chat_client = geminidataanalytics.DataChatServiceClient()
    chart_generated_flag = [False]
    messages = [
        geminidataanalytics.Message(
            user_message=geminidataanalytics.UserMessage(text=question)
        )
    ]
    conversation_reference = geminidataanalytics.ConversationReference(
        conversation=data_chat_client.conversation_path(
            billing_project, location, conversation_id
        ),
        data_agent_context=geminidataanalytics.DataAgentContext(
            data_agent=data_chat_client.data_agent_path(
                billing_project, location, data_agent_id
            ),
        ),
    )
    request = geminidataanalytics.ChatRequest(
        parent=f"projects/{billing_project}/locations/{location}",
        messages=messages,
        conversation_reference=conversation_reference,
    )
    stream = data_chat_client.chat(request=request)
    for response in stream:
        show_message(response, chart_generated_flag)
    if chart_generated_flag[0]:
        preview_in_browser()
이제 stream_chat_response 함수가 정의되었으며 프롬프트와 함께 사용할 수 있습니다.
8. 채팅 시작
질문 1
이제 질문을 시작할 준비가 되었습니다. 이 에이전트가 할 수 있는 작업을 살펴보겠습니다.
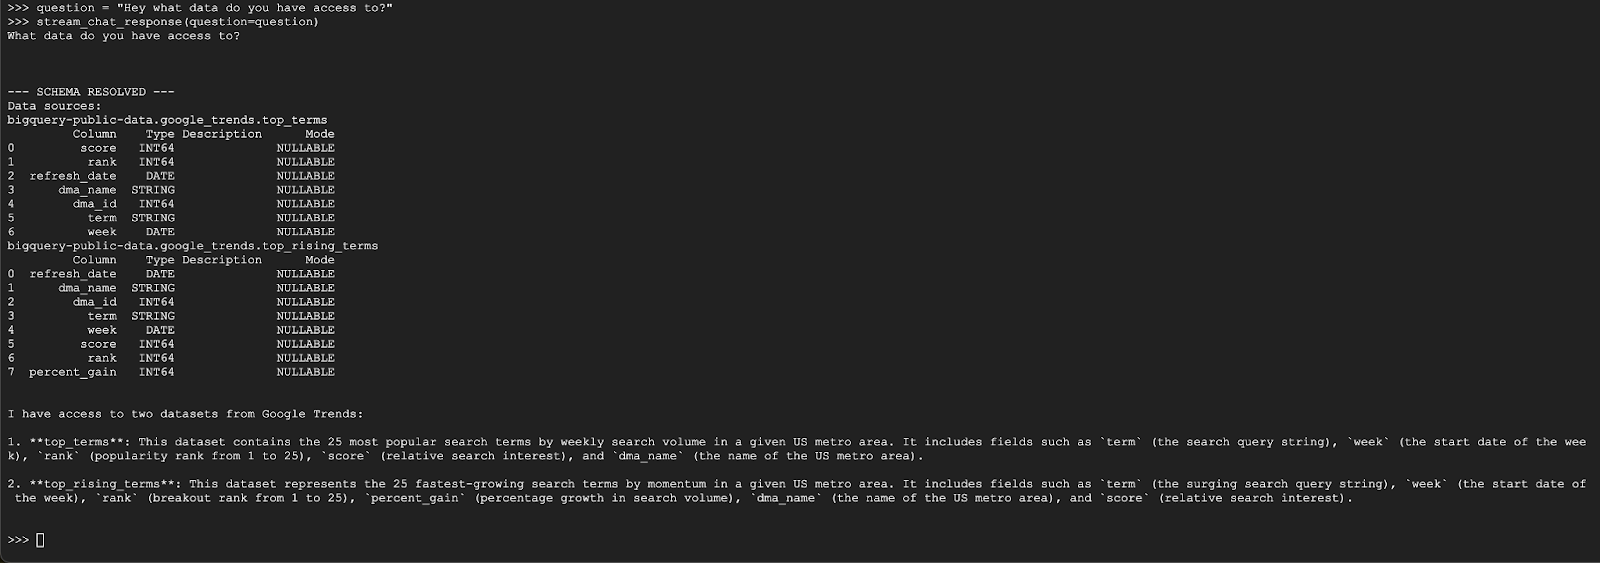
question = "Hey what data do you have access to?"
stream_chat_response(question=question)
상담사는 다음과 유사한 내용으로 응답해야 합니다.
질문 2
좋습니다. 최신 인기 검색어에 대해 자세히 알아보겠습니다.
question = "What are the top 20 most popular search terms last week in NYC based on rank? Display each term and score as a column chart"
stream_chat_response(question=question)
실행하는 데 시간이 다소 걸립니다. 스키마와 메타데이터를 가져오고, SQL 쿼리를 작성하고, 결과를 가져오고, 시각화 안내를 지정하고, 결과를 요약하는 등 다양한 단계를 거치며 업데이트를 스트리밍하는 에이전트가 표시됩니다.
차트를 보려면 Cloud Shell 툴바로 이동하여 '웹 미리보기'를 클릭하고 포트 8080을 선택합니다.
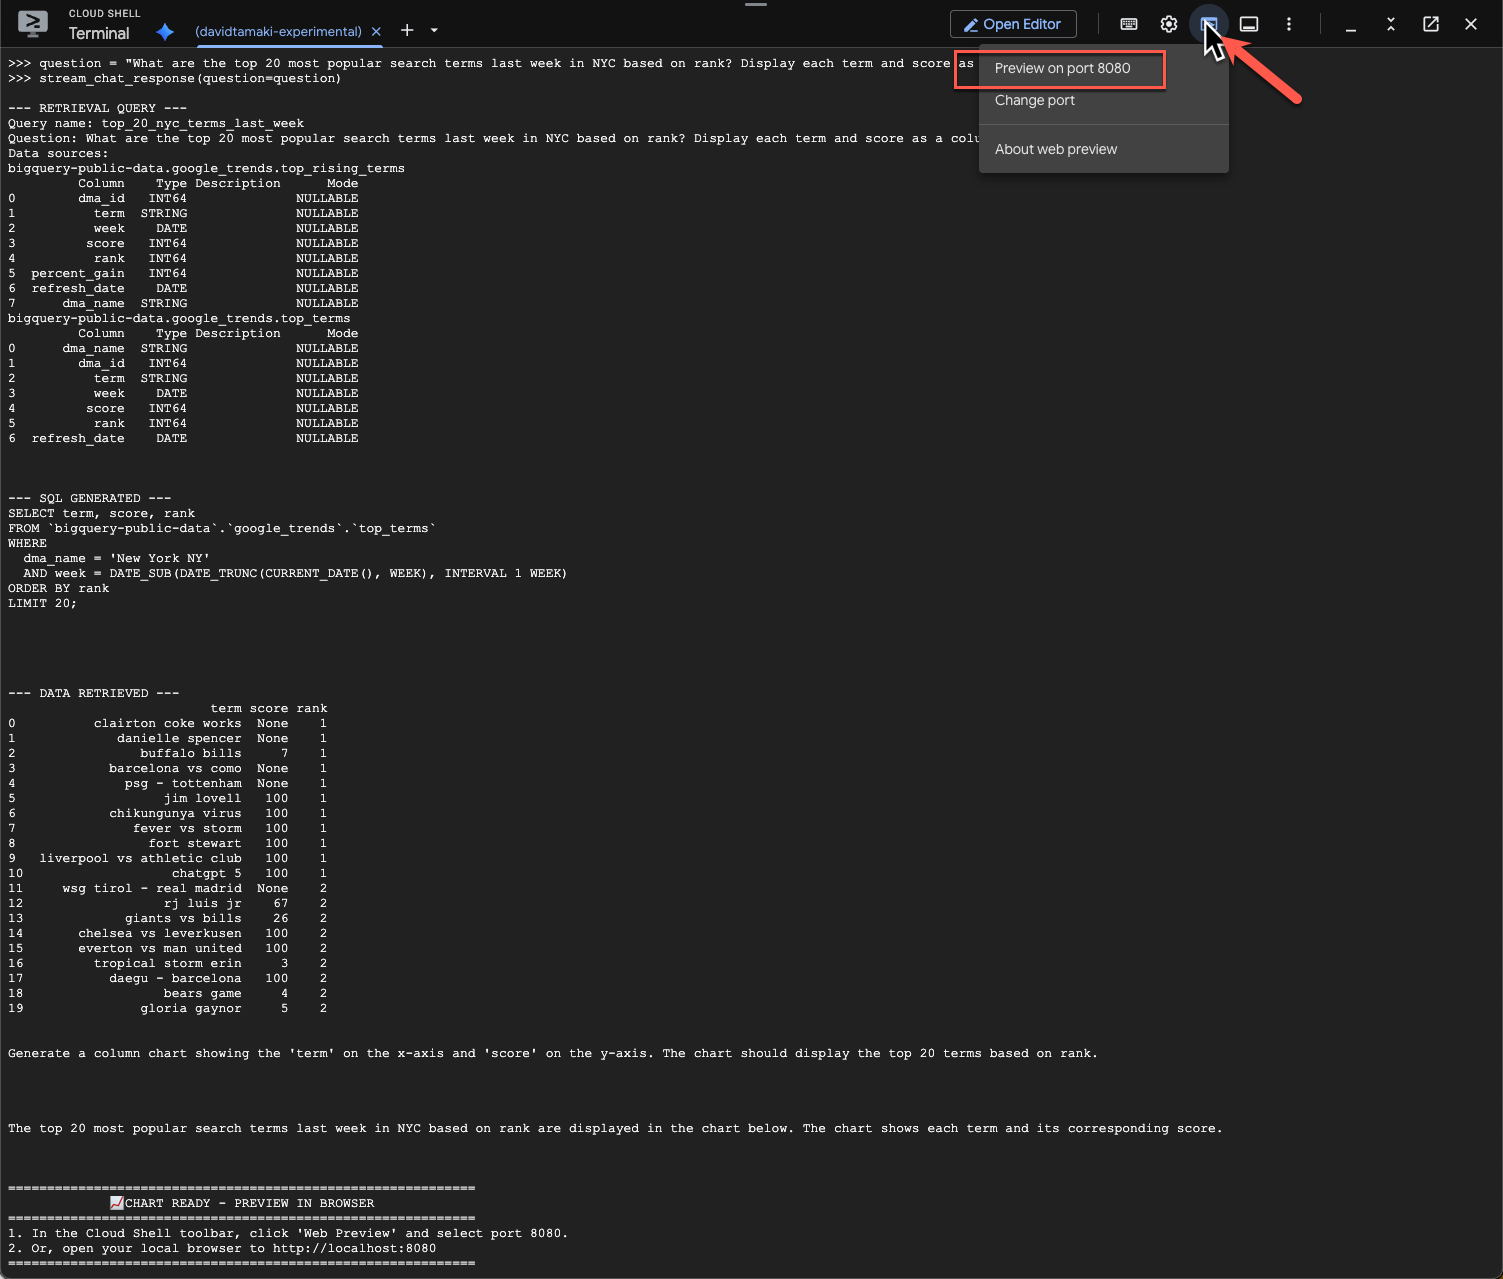
다음과 같은 시각화 렌더링이 표시됩니다.
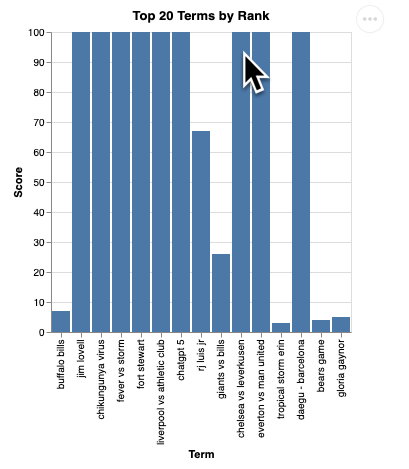
Enter 키를 눌러 서버를 종료하고 계속합니다.
질문 3
후속 질문을 통해 결과를 자세히 살펴보겠습니다.
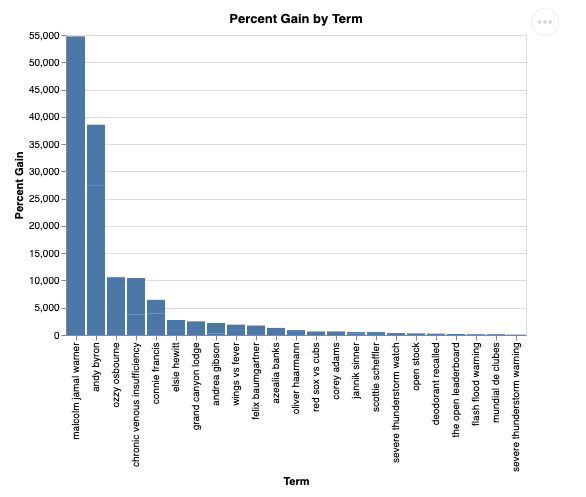
question = "What was the percent gain in growth for these search terms from the week before?"
stream_chat_response(question=question)
아래와 비슷한 내용이 표시됩니다. 이 경우 상담사는 2개의 표를 조인하여 증가율을 찾는 쿼리를 생성했습니다. 쿼리는 약간 다르게 보일 수 있습니다.
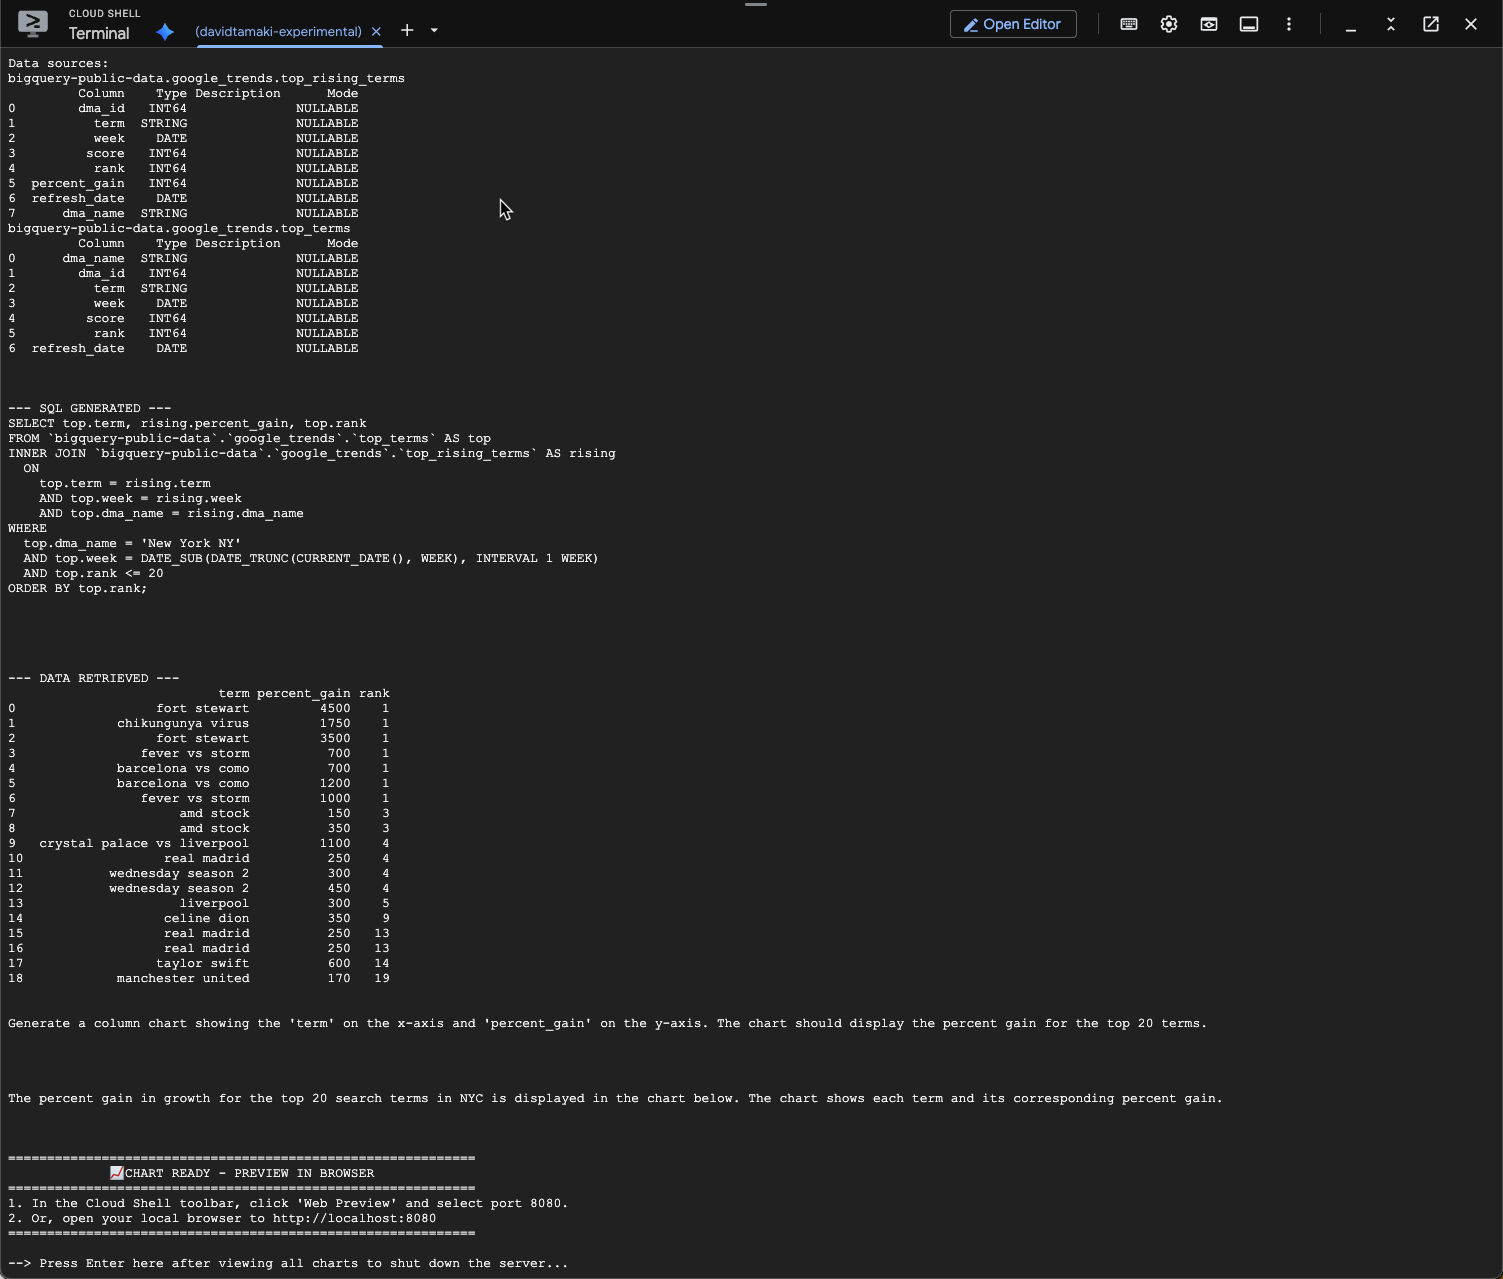
시각화하면 다음과 같습니다.
9. 삭제
이 Codelab에는 장기 실행 제품이 포함되어 있지 않으므로 터미널에 exit()를 입력하여 활성 Python 세션을 중지하면 됩니다.
프로젝트 폴더 및 파일 삭제
Cloud Shell 환경에서 코드를 삭제하려면 다음 명령어를 사용하세요.
cd ~
rm -rf ca-api-codelab
API 사용 중지
이전에 사용 설정된 API를 사용 중지하려면 다음 명령어를 실행합니다.
gcloud services disable geminidataanalytics.googleapis.com
gcloud services disable cloudaicompanion.googleapis.com
gcloud services disable bigquery.googleapis.com
10. 결론
축하합니다. CA SDK를 사용하여 간단한 대화형 분석 에이전트를 빌드했습니다. 참고 자료를 확인하여 자세히 알아보세요.