
1. 简介
在此 Codelab 中,您将学习如何将 对话式分析 (CA) API Python SDK 与 BigQuery 数据源搭配使用。您将了解如何创建新代理、如何利用对话状态管理功能,以及如何通过 API 发送和流式传输响应。
前提条件
- 对 Google Cloud 和 Google Cloud 控制台有基本的了解
- 具备命令行界面和 Cloud Shell 方面的基本技能
- 具备 Python 编程基础知识
学习内容
- 如何将对话式分析 API Python SDK 与 BigQuery 数据源搭配使用
- 如何使用 CA API 创建新代理
- 如何利用对话状态管理
- 如何发送和流式传输来自 API 的响应
所需条件
- Google Cloud 账号和 Google Cloud 项目
- 网络浏览器,例如 Chrome
2. 设置和要求
选择项目
- 登录 Google Cloud 控制台,然后创建一个新项目或重复使用现有项目。如果您还没有 Gmail 或 Google Workspace 账号,则必须创建一个。


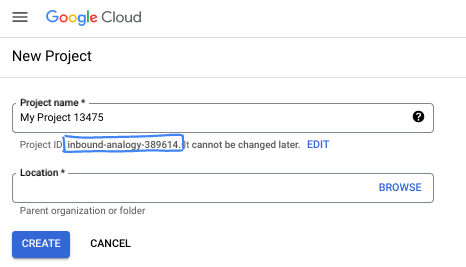
- 项目名称是此项目参与者的显示名称。它是 Google API 尚未使用的字符串。您可以随时对其进行更新。
- 项目 ID 在所有 Google Cloud 项目中是唯一的,并且是不可变的(一经设置便无法更改)。Cloud 控制台会自动生成一个唯一字符串;通常情况下,您无需关注该字符串。在大多数 Codelab 中,您都需要引用项目 ID(通常用
PROJECT_ID标识)。如果您不喜欢生成的 ID,可以再随机生成一个 ID。或者,您也可以尝试自己的项目 ID,看看是否可用。完成此步骤后便无法更改该 ID,并且此 ID 在项目期间会一直保留。 - 此外,还有第三个值,即部分 API 使用的项目编号,供您参考。如需详细了解所有这三个值,请参阅文档。
- 接下来,您需要在 Cloud 控制台中启用结算功能,以便使用 Cloud 资源/API。运行此 Codelab 应该不会产生太多的费用(如果有的话)。若要关闭资源以避免产生超出本教程范围的结算费用,您可以删除自己创建的资源或删除项目。Google Cloud 新用户符合参与 300 美元免费试用计划的条件。
启动 Cloud Shell
虽然可以通过笔记本电脑对 Google Cloud 进行远程操作,但在此 Codelab 中,您将使用 Google Cloud Shell,这是一个在云端运行的命令行环境。
在 Google Cloud 控制台 中,点击右上角工具栏中的 Cloud Shell 图标:

预配和连接到环境应该只需要片刻时间。完成后,您应该会看到如下内容:
这个虚拟机已加载了您需要的所有开发工具。它提供了一个持久的 5 GB 主目录,并且在 Google Cloud 中运行,大大增强了网络性能和身份验证功能。您在此 Codelab 中的所有工作都可以在浏览器中完成。您无需安装任何程序。
3. 准备工作
启用所需的 API
如需使用 Google Cloud 服务,您必须先为项目启用其各自的 API。在本 Codelab 中,您将使用以下 Google Cloud 服务:
- Data Analytics API with Gemini
- Gemini for Google Cloud
- BigQuery API
如需启用这些服务,请在 Cloud Shell 终端中运行以下命令:
gcloud services enable geminidataanalytics.googleapis.com
gcloud services enable cloudaicompanion.googleapis.com
gcloud services enable bigquery.googleapis.com
安装 Python 软件包
在开始任何 Python 项目之前,最好先创建一个虚拟环境。这样可隔离项目的依赖项,防止与其他项目或系统的全局 Python 软件包发生冲突。在本部分中,您将通过 pip 安装 uv,因为 Cloud Shell 已提供 pip。
安装 uv 软件包
pip install uv
验证 uv 是否已正确安装
uv --version
预期输出
如果您看到包含“uv”的输出行,则可以继续执行下一步。请注意,版本号可能会有所不同:

创建虚拟环境并安装软件包
uv init ca-api-codelab
cd ca-api-codelab
uv venv --python 3.12
uv add google-cloud-geminidataanalytics pandas altair
uv pip list | grep -E 'altair|pandas|google-cloud-geminidataanalytics'
预期输出
如果您看到输出行中包含这三个软件包,则可以继续执行下一步。请注意,版本号可能会有所不同:

启动 Python
uv run python
您的屏幕应如下所示:

4. 创建代理
现在,您的开发环境已设置完毕并准备就绪,接下来可以为 Gemini Data Analytics API 奠定基础了。该 SDK 简化了此流程,只需进行一些基本配置即可创建代理。
设置变量
导入 geminidataanalytics 软件包并设置环境变量:
import os
from google.cloud import geminidataanalytics

data_agent_client = geminidataanalytics.DataAgentServiceClient()

location = "global"
billing_project = os.environ.get('DEVSHELL_PROJECT_ID')
data_agent_id = "google_trends_analytics_agent"
为智能体设置系统指令
CA API 会读取 BigQuery 元数据,以获取有关所引用表和列的更多上下文信息。由于此公开数据集没有任何列说明,您可以以 YAML 格式的字符串向代理提供额外的上下文。如需了解最佳实践和要使用的模板,请参阅相关文档:
system_instruction = """
system_instruction:
  - You are a data analyst specializing in the Google Trends dataset.
  - When querying, always use the 'week' column for date-based filtering. This needs to be a Sunday. If you are doing week over week comparison, make sure you specify a date that is a Sunday.
  - The following columns should be ignored in all queries 'dma_id', 'refresh_date'
  - The 'dma_name' column represents the city and state for about 210 metro areas in the USA.
tables:
  top_terms:
    description: "Represents the 25 most popular search terms by weekly search volume in a given US metro area (DMA)."
    fields:
      term: "The search query string."
      week: "The start date of the week (Sunday) for which the ranking is valid."
      rank: "The term's popularity rank from 1 (most popular) to 25."
      score: "Relative search interest, where 100 is the peak popularity for the term in that week."
      dma_name: "The name of the US metro area, e.g., 'New York NY'."
  top_rising_terms:
    description: "Represents the 25 fastest-growing ('breakout') search terms by momentum in a given US metro area (DMA)."
    fields:
      term: "The surging search query string."
      week: "The start date of the week (Sunday) for which the ranking is valid."
      rank: "The term's breakout rank from 1 (top rising) to 25."
      percent_gain: "The percentage growth in search volume compared to the previous period."
      dma_name: "The name of the US metro area, e.g., 'Los Angeles CA'."
      score: "Relative search interest, where 100 is the peak popularity for the term in that week."
join_instructions:
  goal: "Find terms that are simultaneously popular and rising in the same week and metro area."
  method: "INNER JOIN the two tables on their common keys."
  keys:
    - "term"
    - "week"
    - "dma_name"
golden_queries:
  - natural_language_query: "Find all terms in the 'New York NY' area that were in both the top 25 and top 25 rising lists for the week of July 6th, 2025, and show their ranks and percent gain."
    sql_query: |
      SELECT
          top.term,
          top.rank AS top_25_rank,
          rising.rank AS rising_25_rank,
          rising.percent_gain
      FROM
          `bigquery-public-data.google_trends.top_terms` AS top
      INNER JOIN
          `bigquery-public-data.google_trends.top_rising_terms` AS rising
      ON
          top.term = rising.term
          AND top.week = rising.week
          AND top.dma_name = rising.dma_name
      WHERE
          top.week = '2025-07-06'
          AND top.dma_name = 'New York NY'
      ORDER BY
          top.rank;
"""
设置 BigQuery 表数据源
现在,您可以设置 BigQuery 表数据源。CA API 接受数组形式的 BigQuery 表:
# BigQuery table data sources
bq_top = geminidataanalytics.BigQueryTableReference(
    project_id="bigquery-public-data", dataset_id="google_trends", table_id="top_terms"
)
bq_rising = geminidataanalytics.BigQueryTableReference(
    project_id="bigquery-public-data", dataset_id="google_trends", table_id="top_rising_terms"
)
datasource_references = geminidataanalytics.DatasourceReferences(
    bq=geminidataanalytics.BigQueryTableReferences(table_references=[bq_top, bq_rising]))
为有状态聊天设置上下文
您可以根据已发布的上下文创建新智能体,该上下文将系统指令、数据源引用和任何其他选项整合在一起。
请注意,您可以使用 stagingContext 在发布之前测试和验证更改。这样一来,开发者就可以通过在聊天请求中指定 contextVersion,为数据代理添加版本控制。在此 Codelab 中,您只需直接发布:
# Context setup for stateful chat
published_context = geminidataanalytics.Context(
    system_instruction=system_instruction,
    datasource_references=datasource_references,
    options=geminidataanalytics.ConversationOptions(
        analysis=geminidataanalytics.AnalysisOptions(
            python=geminidataanalytics.AnalysisOptions.Python(
                enabled=False
            )
        )
    ),
)

data_agent = geminidataanalytics.DataAgent(
    data_analytics_agent=geminidataanalytics.DataAnalyticsAgent(
        published_context=published_context
    ),
)

# Create the agent
data_agent_client.create_data_agent(request=geminidataanalytics.CreateDataAgentRequest(
    parent=f"projects/{billing_project}/locations/{location}",
    data_agent_id=data_agent_id,
    data_agent=data_agent,
))
创建代理后,您应该会看到类似于以下内容的输出:

获取 Agent
我们来测试一下代理,确保它已创建:
# Test the agent
request = geminidataanalytics.GetDataAgentRequest(
    name=data_agent_client.data_agent_path(
        billing_project, location, data_agent_id)
)
response = data_agent_client.get_data_agent(request=request)
print(response)
您应该会看到新代理上的元数据。这包括创建时间以及系统指令和数据源方面的智能体上下文。
5. 创建对话
您现在可以创建第一个对话了!在本 Codelab 中,您将使用对话引用与代理进行有状态聊天。
作为参考,CA API 提供了多种聊天方式,以及不同的状态和智能体管理选项。下面简要总结了这 3 种方法:
状态 | 对话历史记录 | Agent | 代码 | Description | |
使用对话引用进行对话 | 有状态 | API 管理 | 是 | 通过发送引用现有对话及其关联代理上下文的对话消息,继续进行有状态对话。对于多轮对话,Google Cloud 会存储和管理对话记录。 | |
使用数据代理引用进行对话 | 无状态 | 用户管理 | 是 | 发送引用已保存的数据代理以获取上下文的无状态对话消息。对于多轮对话,您的应用必须管理对话记录,并在每次请求中提供该记录。 | |
使用内嵌上下文进行对话 | 无状态 | 用户管理 | 否 | 通过直接在请求中提供所有上下文来发送无状态对话消息,而不使用已保存的数据代理。对于多轮对话,您的应用必须管理对话记录,并在每次请求中提供该记录。 |
您将创建一个函数来设置对话并为对话提供唯一 ID:
def setup_conversation(conversation_id: str):
    data_chat_client = geminidataanalytics.DataChatServiceClient()
    conversation = geminidataanalytics.Conversation(
        agents=[data_chat_client.data_agent_path(
            billing_project, location, data_agent_id)],
    )
    request = geminidataanalytics.CreateConversationRequest(
        parent=f"projects/{billing_project}/locations/{location}",
        conversation_id=conversation_id,
        conversation=conversation,
    )
    try:
        data_chat_client.get_conversation(name=data_chat_client.conversation_path(
            billing_project, location, conversation_id))
        print(f"Conversation '{conversation_id}' already exists.")
    except Exception:
        response = data_chat_client.create_conversation(request=request)
        print("Conversation created successfully:")
        print(response)


conversation_id = "my_first_conversation"
setup_conversation(conversation_id=conversation_id)
您应该会看到一条消息,告知您对话已成功创建。
6. 添加实用函数
您即将可以开始与智能体对话。在此之前,我们先添加一些实用函数来帮助设置消息格式,以便更轻松地读取消息并呈现可视化图表。CA API 将发送一个 vega 规范,您可以使用 altair 软件包绘制该规范:
# Utility functions for streaming and formatting responses
import altair as alt
import http.server
import pandas as pd
import proto
import socketserver
import threading

_server_thread = None
_httpd = None


# Prints a formatted section title
def display_section_title(text):
    print(f"\n--- {text.upper()} ---")


# Handles and displays data responses
def handle_data_response(resp):
    if "query" in resp:
        query = resp.query
        display_section_title("Retrieval query")
        print(f"Query name: {query.name}")
        print(f"Question: {query.question}")
        print("Data sources:")
        for datasource in query.datasources:
            display_datasource(datasource)
    elif "generated_sql" in resp:
        display_section_title("SQL generated")
        print(resp.generated_sql)
    elif "result" in resp:
        display_section_title("Data retrieved")
        fields = [field.name for field in resp.result.schema.fields]
        d = {field: [] for field in fields}
        for el in resp.result.data:
            for field in fields:
                d[field].append(el[field])
        print(pd.DataFrame(d))


# Starts a local web server to preview charts
def preview_in_browser(port: int = 8080):
    """Starts a web server in a background thread and waits for user to stop it."""
    global _server_thread, _httpd
    if _server_thread and _server_thread.is_alive():
        print(
            f"\n--> A new chart was generated. Refresh your browser at http://localhost:{port}")
        return
    Handler = http.server.SimpleHTTPRequestHandler
    socketserver.TCPServer.allow_reuse_address = True
    try:
        _httpd = socketserver.TCPServer(("", port), Handler)
    except OSError as e:
        print(f"❌ Could not start server on port {port}: {e}")
        return
    _server_thread = threading.Thread(target=_httpd.serve_forever)
    _server_thread.daemon = False
    _server_thread.start()
    print("\n" + "=" * 60)
    print(" 📈 CHART READY - PREVIEW IN BROWSER ".center(60))
    print("=" * 60)
    print(
        f"1. In the Cloud Shell toolbar, click 'Web Preview' and select port {port}.")
    print(f"2. Or, open your local browser to http://localhost:{port}")
    print("=" * 60)
    try:
        input(
            "\n--> Press Enter here after viewing all charts to shut down the server...\n\n")
    finally:
        print("Shutting down server...")
        _httpd.shutdown()
        _server_thread.join()
        _httpd, _server_thread = None, None
        print("Server stopped.")


# Handles chart responses
def handle_chart_response(resp, chart_generated_flag: list):
    def _value_to_dict(v):
        if isinstance(v, proto.marshal.collections.maps.MapComposite):
            return {k: _value_to_dict(v[k]) for k in v}
        elif isinstance(v, proto.marshal.collections.RepeatedComposite):
            return [_value_to_dict(el) for el in v]
        return v
    if "query" in resp:
        print(resp.query.instructions)
    elif "result" in resp:
        vega_config_dict = _value_to_dict(resp.result.vega_config)
        chart = alt.Chart.from_dict(vega_config_dict)
        chart_filename = "index.html"
        chart.save(chart_filename)
        if chart_generated_flag:
            chart_generated_flag[0] = True


# Displays the schema of a data source
def display_schema(data):
    fields = getattr(data, "fields")
    df = pd.DataFrame({
        "Column": [f.name for f in fields],
        "Type": [f.type for f in fields],
        "Description": [getattr(f, "description", "-") for f in fields],
        "Mode": [f.mode for f in fields],
    })
    print(df)


# Displays information about a BigQuery data source
def display_datasource(datasource):
    table_ref = datasource.bigquery_table_reference
    source_name = f"{table_ref.project_id}.{table_ref.dataset_id}.{table_ref.table_id}"
    print(source_name)
    display_schema(datasource.schema)


# Handles and displays schema resolution responses
def handle_schema_response(resp):
    if "query" in resp:
        print(resp.query.question)
    elif "result" in resp:
        display_section_title("Schema resolved")
        print("Data sources:")
        for datasource in resp.result.datasources:
            display_datasource(datasource)


# Handles and prints simple text responses
def handle_text_response(resp):
    parts = resp.parts
    print("".join(parts))


# Processes and displays different types of system messages
def show_message(msg, chart_generated_flag: list):
    m = msg.system_message
    if "text" in m:
        handle_text_response(getattr(m, "text"))
    elif "schema" in m:
        handle_schema_response(getattr(m, "schema"))
    elif "data" in m:
        handle_data_response(getattr(m, "data"))
    elif "chart" in m:
        handle_chart_response(getattr(m, "chart"), chart_generated_flag)
    print("\n")
7. 创建聊天功能
最后一步是创建一个可重用的聊天函数,并针对响应流中的每个块调用 show_message 函数:
def stream_chat_response(question: str):
    """
    Sends a chat request, processes the streaming response, and if a chart
    was generated, starts the preview server and waits for it to be closed.
    """
    data_chat_client = geminidataanalytics.DataChatServiceClient()
    chart_generated_flag = [False]
    messages = [
        geminidataanalytics.Message(
            user_message=geminidataanalytics.UserMessage(text=question)
        )
    ]
    conversation_reference = geminidataanalytics.ConversationReference(
        conversation=data_chat_client.conversation_path(
            billing_project, location, conversation_id
        ),
        data_agent_context=geminidataanalytics.DataAgentContext(
            data_agent=data_chat_client.data_agent_path(
                billing_project, location, data_agent_id
            ),
        ),
    )
    request = geminidataanalytics.ChatRequest(
        parent=f"projects/{billing_project}/locations/{location}",
        messages=messages,
        conversation_reference=conversation_reference,
    )
    stream = data_chat_client.chat(request=request)
    for response in stream:
        show_message(response, chart_generated_flag)
    if chart_generated_flag[0]:
        preview_in_browser()
函数 stream_chat_response 现已定义,可用于您的提示。
8. 开始 Chattin'
问题 1
现在,您可以开始提问了!我们先来看看这个代理可以做什么:
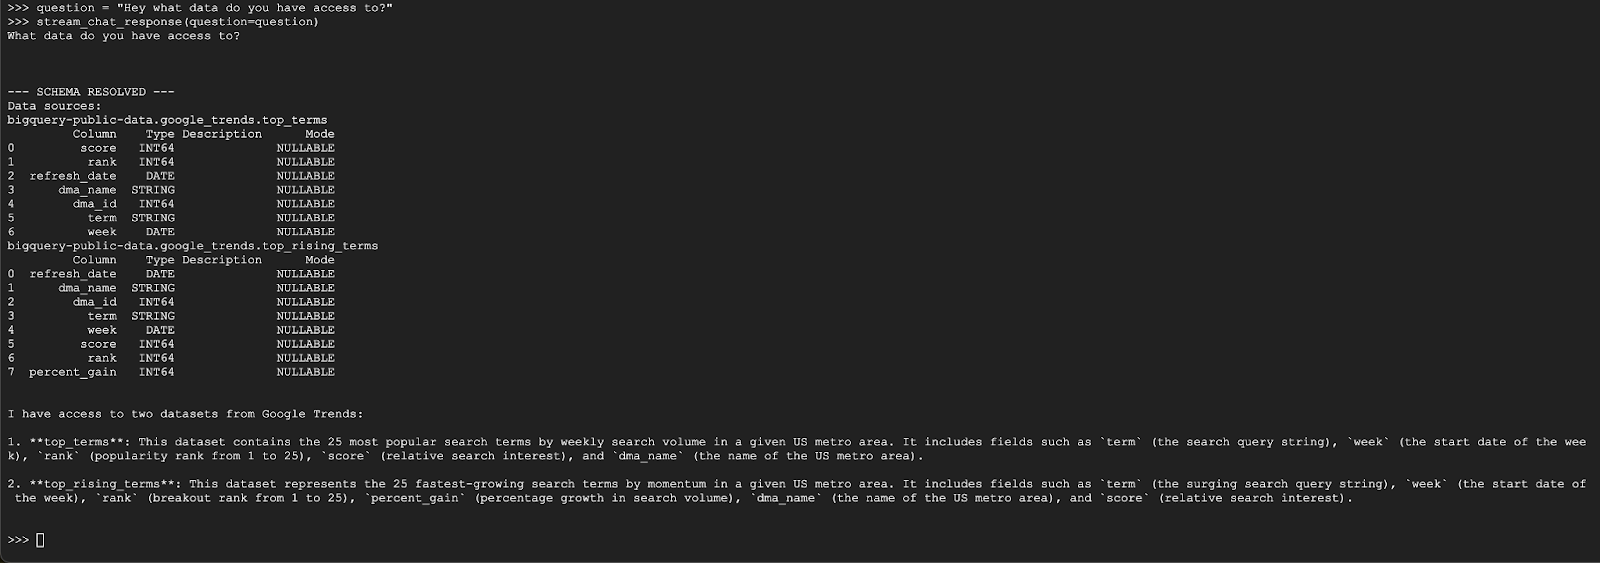
question = "Hey what data do you have access to?"
stream_chat_response(question=question)
代理应回复类似以下内容:
问题 2
太棒了,我们来尝试查找有关最新热门搜索字词的更多信息:
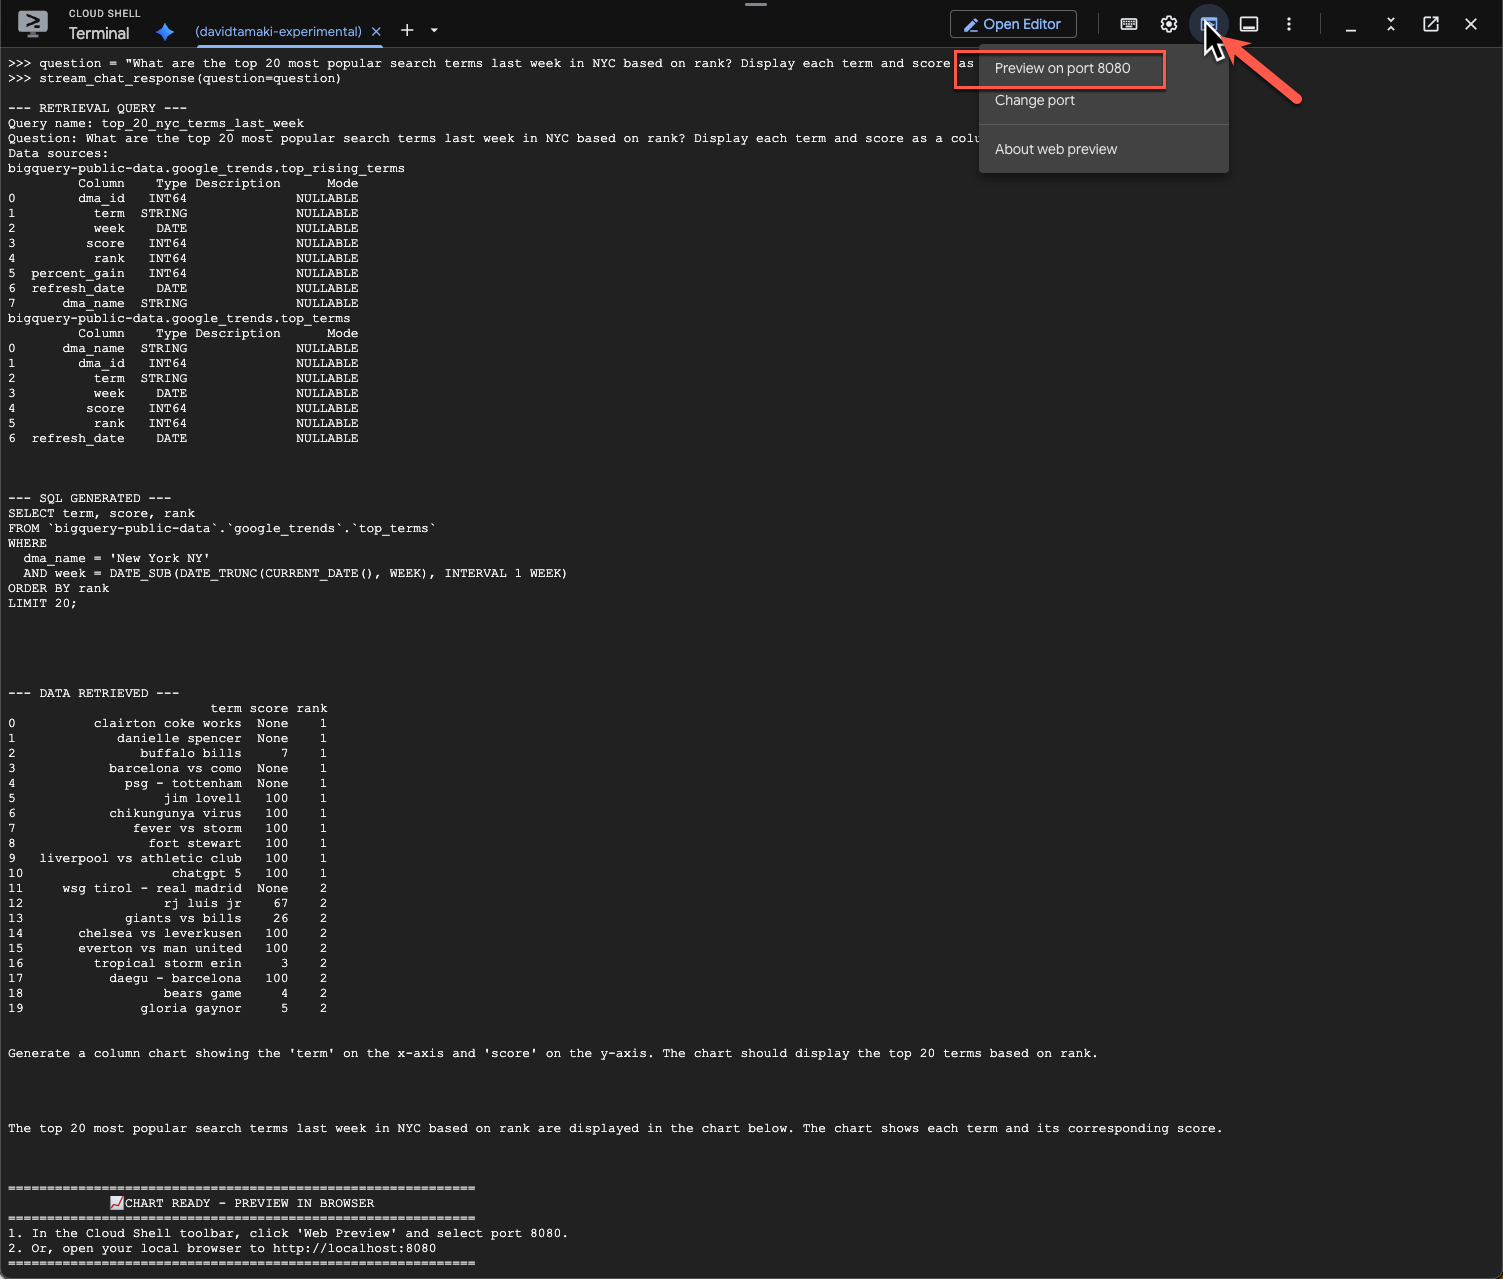
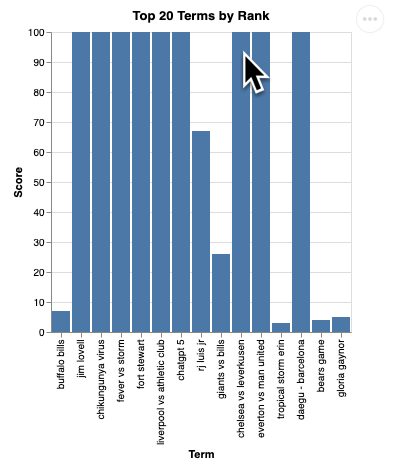
question = "What are the top 20 most popular search terms last week in NYC based on rank? Display each term and score as a column chart"
stream_chat_response(question=question)
这需要一些时间才能运行。您应该会看到代理逐步运行并流式传输更新,包括检索架构和元数据、编写 SQL 查询、获取结果、指定可视化指令和总结结果。
如需查看图表,请前往 Cloud Shell 工具栏,点击“网页预览”,然后选择端口 8080:
您应该会看到如下所示的可视化图表渲染效果:
按 Enter 键关闭服务器并继续。
问题 3
我们来尝试一个后续问题,深入了解这些结果:
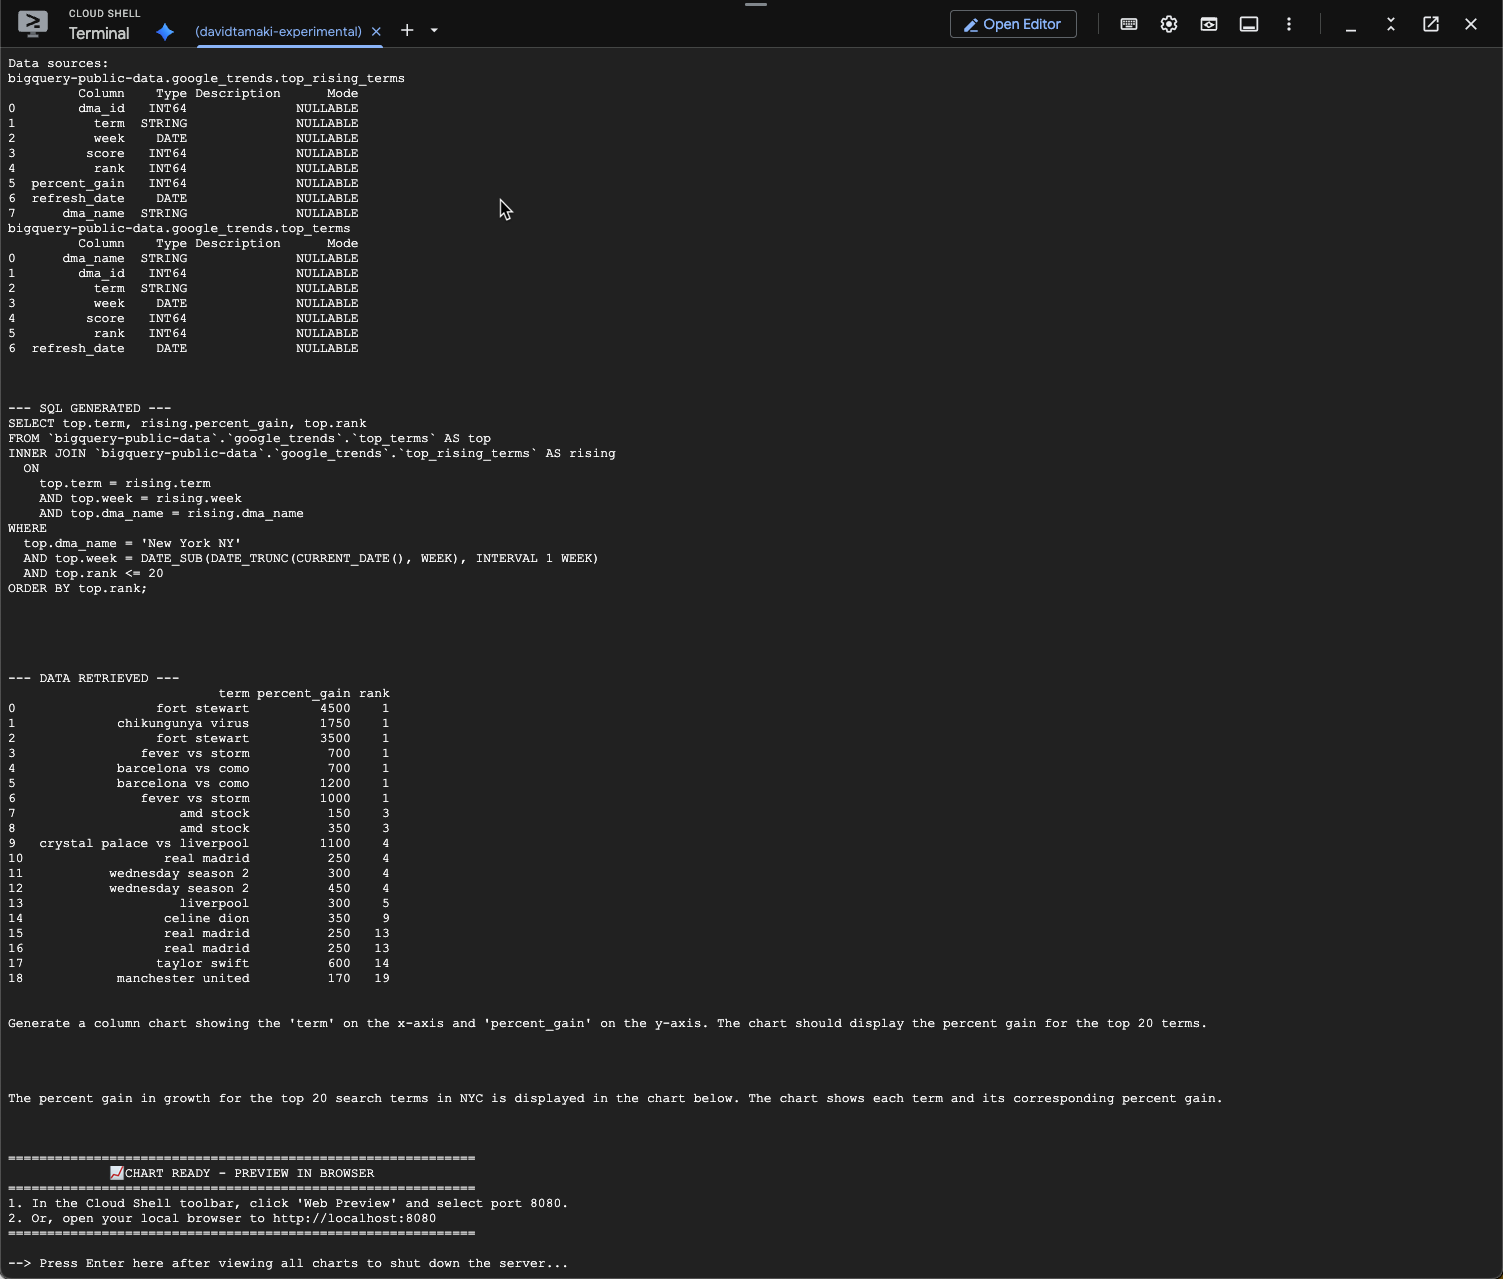
question = "What was the percent gain in growth for these search terms from the week before?"
stream_chat_response(question=question)
您应该会看到类似以下所示的内容。在这种情况下,代理已生成一个查询,用于联接这两个表以查找增幅百分比。请注意,您的查询可能略有不同:
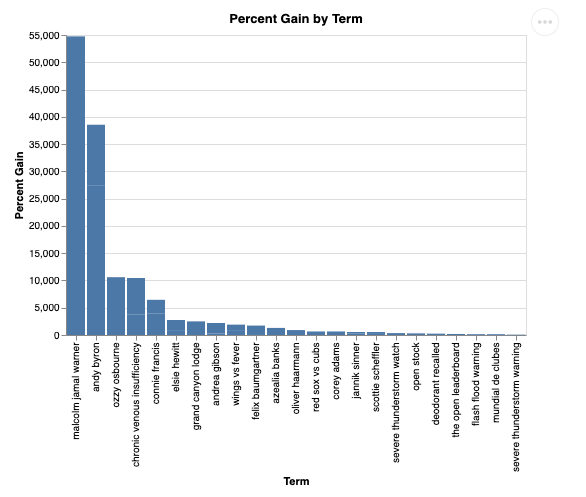
可视化后,效果如下所示:
9. 清理
由于此 Codelab 不涉及任何长时间运行的产品,因此只需在终端中输入 exit() 即可停止有效的 Python 会话。
删除项目文件夹和文件
如果您想从 Cloud Shell 环境中移除代码,请使用以下命令:
cd ~
rm -rf ca-api-codelab
停用 API
如需停用之前启用的 API,请运行以下命令
gcloud services disable geminidataanalytics.googleapis.com
gcloud services disable cloudaicompanion.googleapis.com
gcloud services disable bigquery.googleapis.com
10. 总结
恭喜!您已成功使用 CA SDK 构建了一个简单的对话式分析代理。查看参考资料,了解更多信息!