
1. 簡介
在本程式碼研究室中,您將瞭解如何搭配 BigQuery 資料來源使用 Conversational Analytics (CA) API Python SDK。您將瞭解如何建立新代理程式、如何善用對話狀態管理功能,以及如何透過 API 傳送及串流回應。
必要條件
- 對 Google Cloud 和 Google Cloud 控制台有基本瞭解
- 指令列介面和 Cloud Shell 的基本技能
- 具備 Python 程式設計的基本能力
課程內容
- 如何搭配 BigQuery 資料來源使用 Conversational Analytics API Python SDK
- 如何使用 CA API 建立新代理程式
- 如何運用對話狀態管理功能
- 如何透過 API 傳送及串流回應
軟硬體需求
- Google Cloud 帳戶和 Google Cloud 專案
- 網路瀏覽器,例如 Chrome
2. 設定和需求條件
選擇專案
- 登入 Google Cloud 控制台,然後建立新專案或重複使用現有專案。如果沒有 Gmail 或 Google Workspace 帳戶,請先建立帳戶。


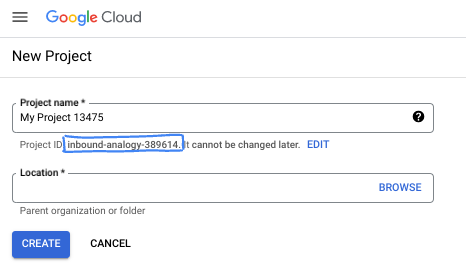
- 專案名稱是這個專案參與者的顯示名稱。這是 Google API 未使用的字元字串。你隨時可以更新。
- 專案 ID 在所有 Google Cloud 專案中都是不重複的,而且設定後即無法變更。Cloud 控制台會自動產生專屬字串,通常您不需要在意該字串為何。在大多數程式碼研究室中,您需要參照專案 ID (通常標示為
PROJECT_ID)。如果您不喜歡產生的 ID,可以產生另一個隨機 ID。你也可以嘗試使用自己的名稱,看看是否可用。完成這個步驟後就無法變更,且專案期間會維持不變。 - 請注意,有些 API 會使用第三個值,也就是「專案編號」。如要進一步瞭解這三種值,請參閱說明文件。
- 接著,您需要在 Cloud 控制台中啟用帳單,才能使用 Cloud 資源/API。完成這個程式碼研究室的費用不高,甚至可能完全免費。如要關閉資源,避免在本教學課程結束後繼續產生費用,請刪除您建立的資源或專案。Google Cloud 新使用者可參加價值$300 美元的免費試用計畫。
啟動 Cloud Shell
雖然可以透過筆電遠端操作 Google Cloud,但在本程式碼研究室中,您將使用 Google Cloud Shell,這是可在雲端執行的指令列環境。
在 Google Cloud 控制台中,點選右上工具列的 Cloud Shell 圖示:

佈建並連線至環境的作業需要一些時間才能完成。完成後,您應該會看到如下的內容:
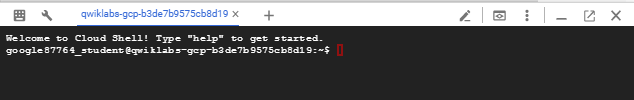
這部虛擬機器搭載各種您需要的開發工具,並提供永久的 5GB 主目錄,而且可在 Google Cloud 運作,大幅提升網路效能並強化驗證功能。您可以在瀏覽器中完成本程式碼研究室的所有作業。您不需要安裝任何軟體。
3. 事前準備
啟用必要的 API
如要使用 Google Cloud 服務,必須先為專案啟用對應的 API。在本程式碼研究室中,您會使用下列 Google Cloud 服務:
- Data Analytics API with Gemini
- Gemini for Google Cloud
- BigQuery API
如要啟用這些服務,請在 Cloud Shell 終端機中執行下列指令:
gcloud services enable geminidataanalytics.googleapis.com
gcloud services enable cloudaicompanion.googleapis.com
gcloud services enable bigquery.googleapis.com
安裝 Python 套件
開始任何 Python 專案前,建議您先建立虛擬環境。這樣一來,專案的依附元件就會與其他專案或系統的全域 Python 套件隔離,避免發生衝突。在本節中,您將透過 pip 安裝 uv,因為 Cloud Shell 已提供 pip。
安裝 uv 套件
pip install uv
確認 uv 安裝正確無誤
uv --version
預期輸出內容
如果看到含有 uv 的輸出行,即可繼續下一個步驟。請注意,版本號碼可能有所不同:

建立虛擬環境並安裝套件
uv init ca-api-codelab
cd ca-api-codelab
uv venv --python 3.12
uv add google-cloud-geminidataanalytics pandas altair
uv pip list | grep -E 'altair|pandas|google-cloud-geminidataanalytics'
預期輸出內容
如果看到包含這三個套件的輸出行,即可繼續下一個步驟。請注意,版本號碼可能有所不同:

啟動 Python
uv run python
畫面應如下所示:

4. 建立代理程式
開發環境已設定完畢,現在可以開始為 Gemini Data Analytics API 奠定基礎。SDK 可簡化這個程序,只需完成幾項基本設定,即可建立代理程式。
設定變數
匯入 geminidataanalytics 套件並設定環境變數:
import os
from google.cloud import geminidataanalytics

data_agent_client = geminidataanalytics.DataAgentServiceClient()

location = "global"
billing_project = os.environ.get('DEVSHELL_PROJECT_ID')
data_agent_id = "google_trends_analytics_agent"
設定代理程式的系統指示
CA API 會讀取 BigQuery 中繼資料,進一步瞭解所參照的資料表和資料欄。由於這個公開資料集沒有任何欄說明,您可以提供 YAML 格式的字串,為服務專員提供額外背景資訊。如需最佳做法和範本,請參閱這篇說明文件:
system_instruction = """
system_instruction:
  - You are a data analyst specializing in the Google Trends dataset.
  - When querying, always use the 'week' column for date-based filtering. This needs to be a Sunday. If you are doing week over week comparison, make sure you specify a date that is a Sunday.
  - The following columns should be ignored in all queries 'dma_id', 'refresh_date'
  - The 'dma_name' column represents the city and state for about 210 metro areas in the USA.
tables:
  top_terms:
    description: "Represents the 25 most popular search terms by weekly search volume in a given US metro area (DMA)."
    fields:
      term: "The search query string."
      week: "The start date of the week (Sunday) for which the ranking is valid."
      rank: "The term's popularity rank from 1 (most popular) to 25."
      score: "Relative search interest, where 100 is the peak popularity for the term in that week."
      dma_name: "The name of the US metro area, e.g., 'New York NY'."
  top_rising_terms:
    description: "Represents the 25 fastest-growing ('breakout') search terms by momentum in a given US metro area (DMA)."
    fields:
      term: "The surging search query string."
      week: "The start date of the week (Sunday) for which the ranking is valid."
      rank: "The term's breakout rank from 1 (top rising) to 25."
      percent_gain: "The percentage growth in search volume compared to the previous period."
      dma_name: "The name of the US metro area, e.g., 'Los Angeles CA'."
      score: "Relative search interest, where 100 is the peak popularity for the term in that week."
join_instructions:
  goal: "Find terms that are simultaneously popular and rising in the same week and metro area."
  method: "INNER JOIN the two tables on their common keys."
  keys:
    - "term"
    - "week"
    - "dma_name"
golden_queries:
  - natural_language_query: "Find all terms in the 'New York NY' area that were in both the top 25 and top 25 rising lists for the week of July 6th, 2025, and show their ranks and percent gain."
    sql_query: |
      SELECT
          top.term,
          top.rank AS top_25_rank,
          rising.rank AS rising_25_rank,
          rising.percent_gain
      FROM
          `bigquery-public-data.google_trends.top_terms` AS top
      INNER JOIN
          `bigquery-public-data.google_trends.top_rising_terms` AS rising
      ON
          top.term = rising.term
          AND top.week = rising.week
          AND top.dma_name = rising.dma_name
      WHERE
          top.week = '2025-07-06'
          AND top.dma_name = 'New York NY'
      ORDER BY
          top.rank;
"""
設定 BigQuery 資料表資料來源
現在您可以設定 BigQuery 資料表資料來源。CA API 會接受陣列中的 BigQuery 資料表:
# BigQuery table data sources
bq_top = geminidataanalytics.BigQueryTableReference(
    project_id="bigquery-public-data", dataset_id="google_trends", table_id="top_terms"
)
bq_rising = geminidataanalytics.BigQueryTableReference(
    project_id="bigquery-public-data", dataset_id="google_trends", table_id="top_rising_terms"
)
datasource_references = geminidataanalytics.DatasourceReferences(
    bq=geminidataanalytics.BigQueryTableReferences(table_references=[bq_top, bq_rising]))
設定有狀態的即時通訊背景資訊
您可以建立新代理,並使用已發布的內容,其中包含系統指令、資料來源參照和任何其他選項。
請注意,您可以建立 stagingContext,先測試及驗證變更,再發布。開發人員只要在聊天要求中指定 contextVersion,即可為資料代理程式新增版本控管功能。在本程式碼研究室中,您將直接發布:
# Context setup for stateful chat
published_context = geminidataanalytics.Context(
    system_instruction=system_instruction,
    datasource_references=datasource_references,
    options=geminidataanalytics.ConversationOptions(
        analysis=geminidataanalytics.AnalysisOptions(
            python=geminidataanalytics.AnalysisOptions.Python(
                enabled=False
            )
        )
    ),
)

data_agent = geminidataanalytics.DataAgent(
    data_analytics_agent=geminidataanalytics.DataAnalyticsAgent(
        published_context=published_context
    ),
)

# Create the agent
data_agent_client.create_data_agent(request=geminidataanalytics.CreateDataAgentRequest(
    parent=f"projects/{billing_project}/locations/{location}",
    data_agent_id=data_agent_id,
    data_agent=data_agent,
))
建立代理程式後,畫面會顯示類似以下的輸出內容:

取得代理程式
讓我們測試代理程式,確認是否已建立:
# Test the agent
request = geminidataanalytics.GetDataAgentRequest(
    name=data_agent_client.data_agent_path(
        billing_project, location, data_agent_id)
)
response = data_agent_client.get_data_agent(request=request)
print(response)
您應該會看到新代理程式的相關中繼資料。包括系統指令和資料來源的建立時間和代理程式環境。
5. 建立對話
現在可以開始建立第一則對話了!在本程式碼研究室中,您將使用對話參照,與服務專員進行有狀態的對話。
如需參考資料,請參閱 CA API,瞭解如何透過各種狀態和代理程式管理選項進行對話。以下是這 3 種方法的快速摘要:
狀態 | 對話記錄 | Agent | 代碼 | 說明 | |
使用對話參考資料進行即時通訊 | 有狀態 | API 管理 | 是 | 傳送參照現有對話及其相關聯代理程式情境的即時通訊訊息,繼續進行有狀態的對話。如果是多輪對話,Google Cloud 會儲存及管理對話記錄。 | |
使用資料代理參照進行即時通訊 | 無狀態 | 使用者管理 | 是 | 傳送無狀態的即時通訊訊息,並參照已儲存的資料代理程式來提供背景資訊。如果是多輪對話,應用程式必須管理對話記錄,並在每個要求中提供記錄。 | |
使用內嵌脈絡對話 | 無狀態 | 使用者管理 | 否 | 直接在要求中提供所有內容,即可傳送無狀態的即時通訊訊息,不必使用已儲存的資料代理程式。如果是多輪對話,應用程式必須管理對話記錄,並在每個要求中提供記錄。 |
您將建立函式來設定對話,並為對話提供專屬 ID:
def setup_conversation(conversation_id: str):
    data_chat_client = geminidataanalytics.DataChatServiceClient()
    conversation = geminidataanalytics.Conversation(
        agents=[data_chat_client.data_agent_path(
            billing_project, location, data_agent_id)],
    )
    request = geminidataanalytics.CreateConversationRequest(
        parent=f"projects/{billing_project}/locations/{location}",
        conversation_id=conversation_id,
        conversation=conversation,
    )
    try:
        data_chat_client.get_conversation(name=data_chat_client.conversation_path(
            billing_project, location, conversation_id))
        print(f"Conversation '{conversation_id}' already exists.")
    except Exception:
        response = data_chat_client.create_conversation(request=request)
        print("Conversation created successfully:")
        print(response)


conversation_id = "my_first_conversation"
setup_conversation(conversation_id=conversation_id)
畫面上應會顯示訊息,表示對話已成功建立。
6. 新增公用函式
你快要可以開始與服務專員交談了。在此之前,請先新增一些公用程式函式,協助設定訊息格式,方便閱讀及顯示視覺化內容。CA API 會傳送 vega 規格,您可以使用 altair 套件繪製:
# Utility functions for streaming and formatting responses
import altair as alt
import http.server
import pandas as pd
import proto
import socketserver
import threading

_server_thread = None
_httpd = None


# Prints a formatted section title
def display_section_title(text):
    print(f"\n--- {text.upper()} ---")


# Handles and displays data responses
def handle_data_response(resp):
    if "query" in resp:
        query = resp.query
        display_section_title("Retrieval query")
        print(f"Query name: {query.name}")
        print(f"Question: {query.question}")
        print("Data sources:")
        for datasource in query.datasources:
            display_datasource(datasource)
    elif "generated_sql" in resp:
        display_section_title("SQL generated")
        print(resp.generated_sql)
    elif "result" in resp:
        display_section_title("Data retrieved")
        fields = [field.name for field in resp.result.schema.fields]
        d = {field: [] for field in fields}
        for el in resp.result.data:
            for field in fields:
                d[field].append(el[field])
        print(pd.DataFrame(d))


# Starts a local web server to preview charts
def preview_in_browser(port: int = 8080):
    """Starts a web server in a background thread and waits for user to stop it."""
    global _server_thread, _httpd
    if _server_thread and _server_thread.is_alive():
        print(
            f"\n--> A new chart was generated. Refresh your browser at http://localhost:{port}")
        return
    Handler = http.server.SimpleHTTPRequestHandler
    socketserver.TCPServer.allow_reuse_address = True
    try:
        _httpd = socketserver.TCPServer(("", port), Handler)
    except OSError as e:
        print(f"❌ Could not start server on port {port}: {e}")
        return
    _server_thread = threading.Thread(target=_httpd.serve_forever)
    _server_thread.daemon = False
    _server_thread.start()
    print("\n" + "=" * 60)
    print(" 📈 CHART READY - PREVIEW IN BROWSER ".center(60))
    print("=" * 60)
    print(
        f"1. In the Cloud Shell toolbar, click 'Web Preview' and select port {port}.")
    print(f"2. Or, open your local browser to http://localhost:{port}")
    print("=" * 60)
    try:
        input(
            "\n--> Press Enter here after viewing all charts to shut down the server...\n\n")
    finally:
        print("Shutting down server...")
        _httpd.shutdown()
        _server_thread.join()
        _httpd, _server_thread = None, None
        print("Server stopped.")


# Handles chart responses
def handle_chart_response(resp, chart_generated_flag: list):
    def _value_to_dict(v):
        if isinstance(v, proto.marshal.collections.maps.MapComposite):
            return {k: _value_to_dict(v[k]) for k in v}
        elif isinstance(v, proto.marshal.collections.RepeatedComposite):
            return [_value_to_dict(el) for el in v]
        return v
    if "query" in resp:
        print(resp.query.instructions)
    elif "result" in resp:
        vega_config_dict = _value_to_dict(resp.result.vega_config)
        chart = alt.Chart.from_dict(vega_config_dict)
        chart_filename = "index.html"
        chart.save(chart_filename)
        if chart_generated_flag:
            chart_generated_flag[0] = True


# Displays the schema of a data source
def display_schema(data):
    fields = getattr(data, "fields")
    df = pd.DataFrame({
        "Column": [f.name for f in fields],
        "Type": [f.type for f in fields],
        "Description": [getattr(f, "description", "-") for f in fields],
        "Mode": [f.mode for f in fields],
    })
    print(df)


# Displays information about a BigQuery data source
def display_datasource(datasource):
    table_ref = datasource.bigquery_table_reference
    source_name = f"{table_ref.project_id}.{table_ref.dataset_id}.{table_ref.table_id}"
    print(source_name)
    display_schema(datasource.schema)


# Handles and displays schema resolution responses
def handle_schema_response(resp):
    if "query" in resp:
        print(resp.query.question)
    elif "result" in resp:
        display_section_title("Schema resolved")
        print("Data sources:")
        for datasource in resp.result.datasources:
            display_datasource(datasource)


# Handles and prints simple text responses
def handle_text_response(resp):
    parts = resp.parts
    print("".join(parts))


# Processes and displays different types of system messages
def show_message(msg, chart_generated_flag: list):
    m = msg.system_message
    if "text" in m:
        handle_text_response(getattr(m, "text"))
    elif "schema" in m:
        handle_schema_response(getattr(m, "schema"))
    elif "data" in m:
        handle_data_response(getattr(m, "data"))
    elif "chart" in m:
        handle_chart_response(getattr(m, "chart"), chart_generated_flag)
    print("\n")
7. 建立即時通訊功能
最後一步是建立可重複使用的即時通訊函式,並為回應串流中的每個區塊呼叫 show_message 函式:
def stream_chat_response(question: str):
    """
    Sends a chat request, processes the streaming response, and if a chart
    was generated, starts the preview server and waits for it to be closed.
    """
    data_chat_client = geminidataanalytics.DataChatServiceClient()
    chart_generated_flag = [False]
    messages = [
        geminidataanalytics.Message(
            user_message=geminidataanalytics.UserMessage(text=question)
        )
    ]
    conversation_reference = geminidataanalytics.ConversationReference(
        conversation=data_chat_client.conversation_path(
            billing_project, location, conversation_id
        ),
        data_agent_context=geminidataanalytics.DataAgentContext(
            data_agent=data_chat_client.data_agent_path(
                billing_project, location, data_agent_id
            ),
        ),
    )
    request = geminidataanalytics.ChatRequest(
        parent=f"projects/{billing_project}/locations/{location}",
        messages=messages,
        conversation_reference=conversation_reference,
    )
    stream = data_chat_client.chat(request=request)
    for response in stream:
        show_message(response, chart_generated_flag)
    if chart_generated_flag[0]:
        preview_in_browser()
函式 stream_chat_response 現在已定義完成,可與提示搭配使用。
8. 開始對話
第 1 題
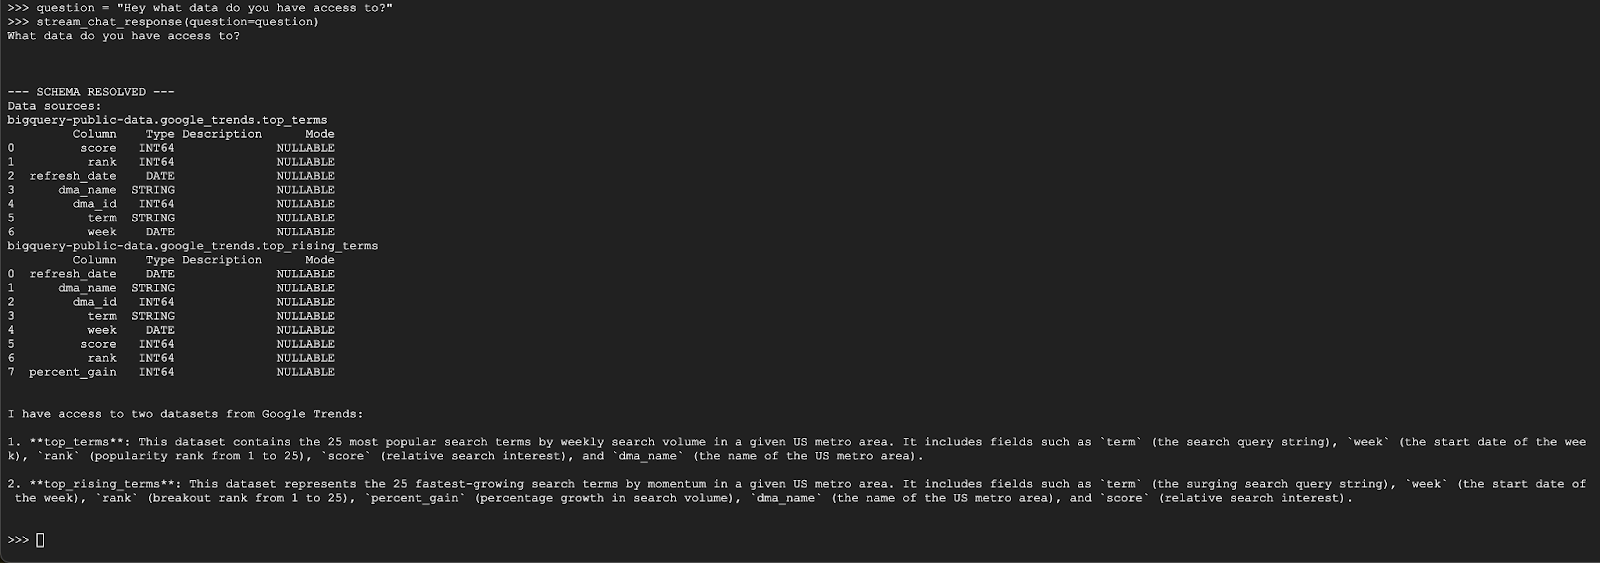
現在可以開始提問了!首先,我們來看看這個代理程式可以做什麼:
question = "Hey what data do you have access to?"
stream_chat_response(question=question)
代理程式的回覆應類似如下:
第 2 題
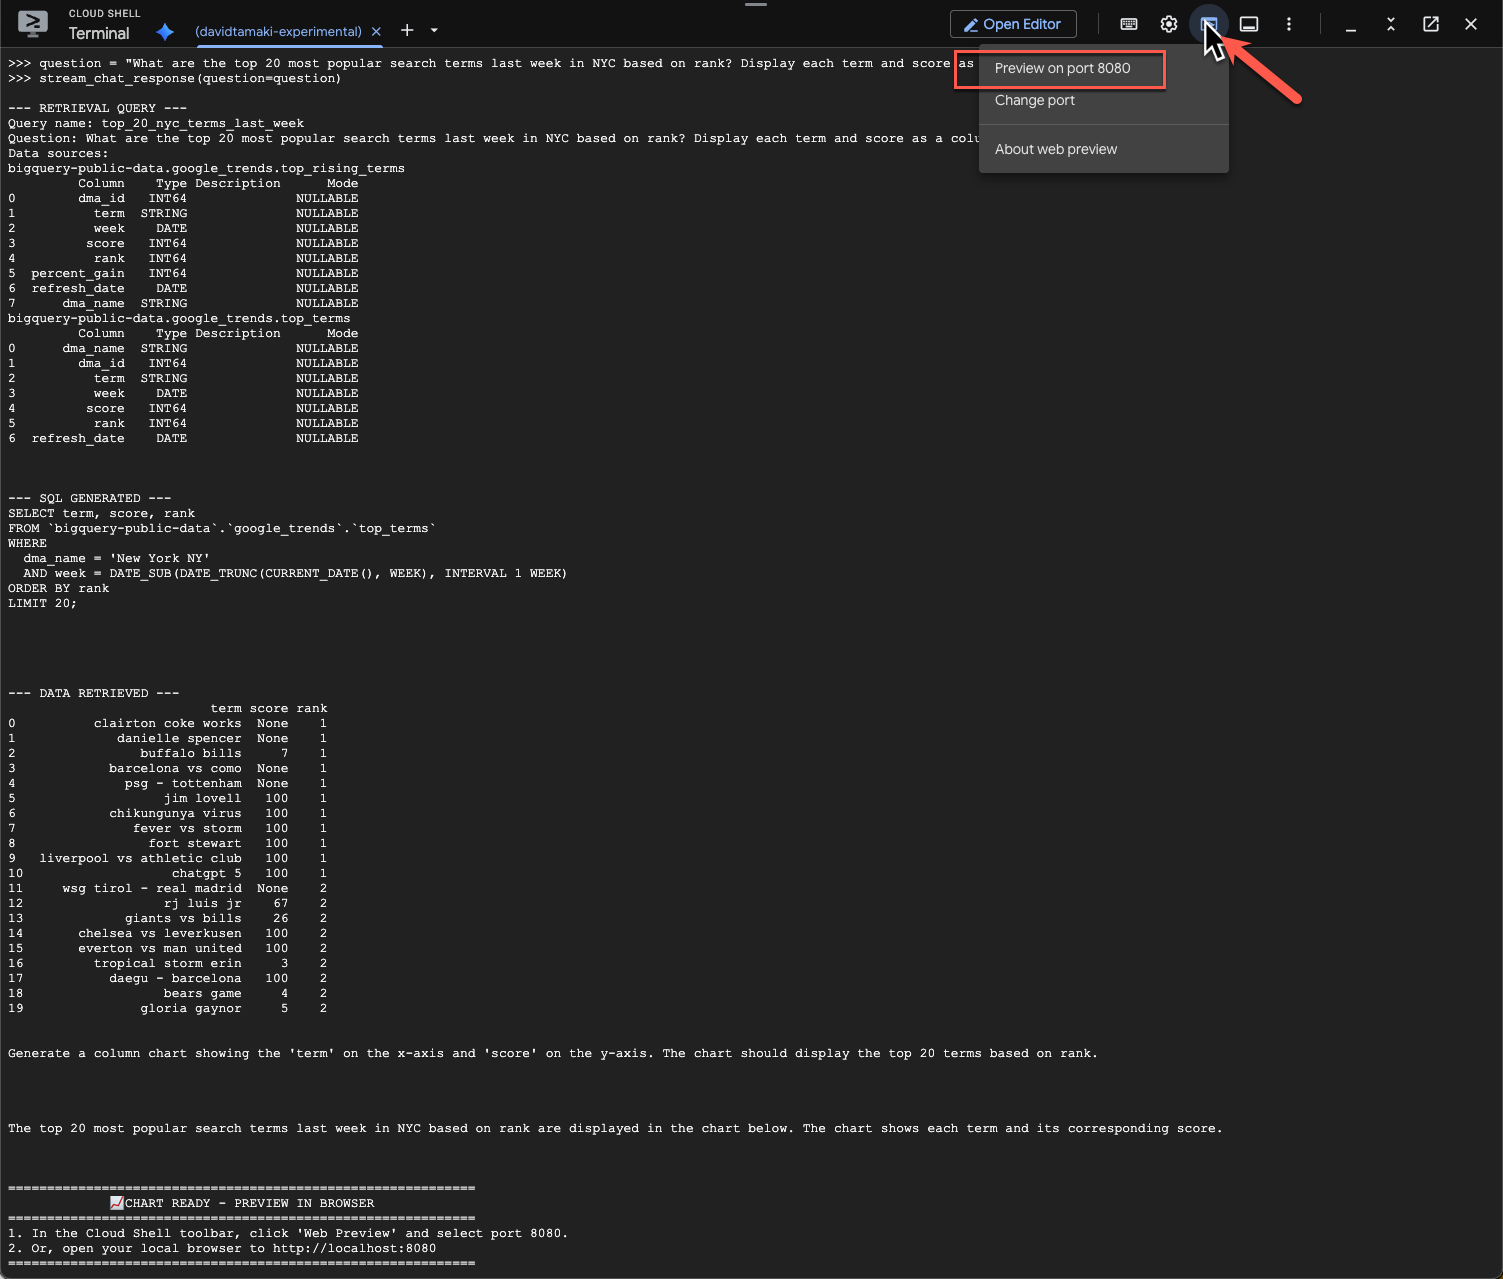
太棒了,我們來試著尋找最新熱門搜尋字詞的相關資訊:
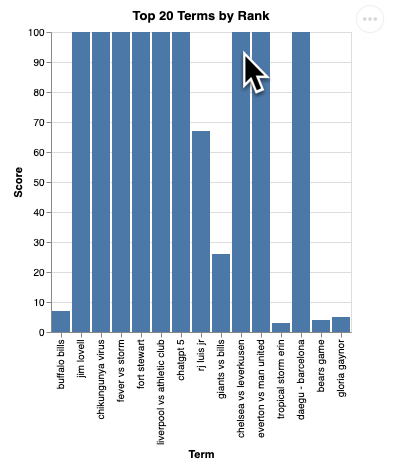
question = "What are the top 20 most popular search terms last week in NYC based on rank? Display each term and score as a column chart"
stream_chat_response(question=question)
這項作業需要一段時間才能完成。您應該會看到代理程式執行各種步驟並串流更新,包括擷取結構定義和中繼資料、編寫 SQL 查詢、取得結果、指定視覺化指示,以及彙整結果。
如要查看圖表,請前往 Cloud Shell 工具列,按一下「網頁預覽」,然後選取通訊埠 8080:
您應該會看到類似下方的視覺化圖表:
按下 Enter 鍵關閉伺服器並繼續。
第 3 題
讓我們試著提出後續問題,深入瞭解這些結果:
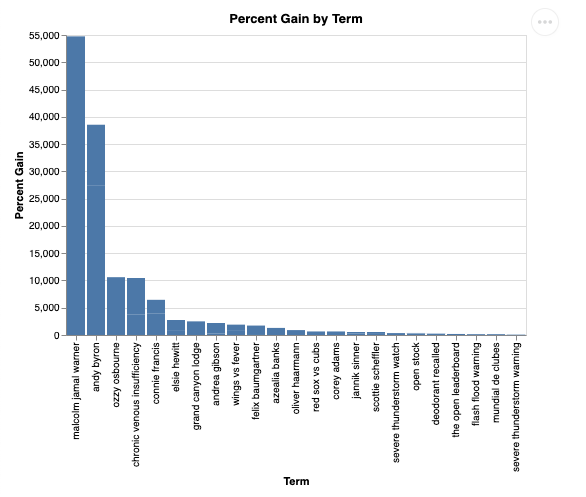
question = "What was the percent gain in growth for these search terms from the week before?"
stream_chat_response(question=question)
內容大致如下所示:在本例中,服務專員已產生查詢,可彙整 2 個資料表,找出百分比增幅。請注意,您的查詢可能略有不同:
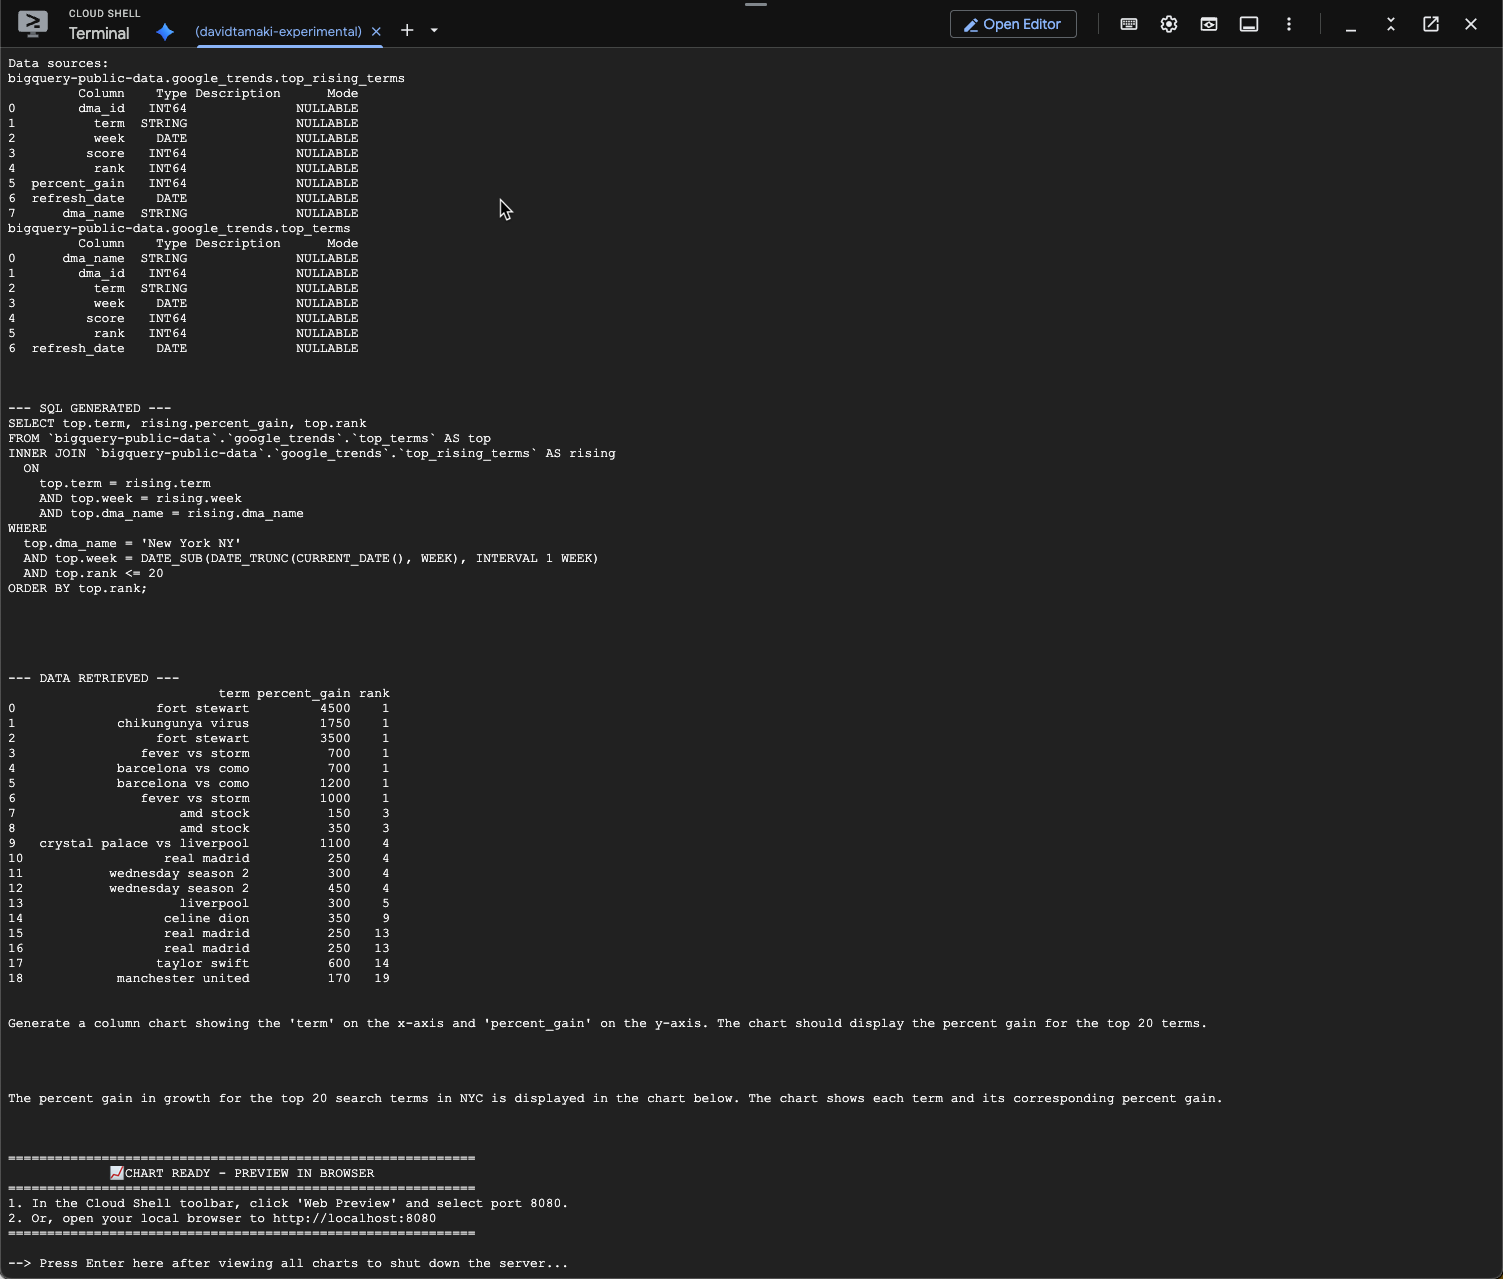
視覺化呈現如下:
9. 清除
由於本程式碼研究室不涉及任何長時間執行的產品,因此只要在終端機中輸入 exit(),停止現有的 Python 工作階段即可。
刪除專案資料夾和檔案
如要從 Cloud Shell 環境中移除程式碼,請使用下列指令:
cd ~
rm -rf ca-api-codelab
停用 API
如要停用先前啟用的 API,請執行下列指令:
gcloud services disable geminidataanalytics.googleapis.com
gcloud services disable cloudaicompanion.googleapis.com
gcloud services disable bigquery.googleapis.com
10. 結語
恭喜!您已使用 CA SDK 成功建構簡單的 Conversational Analytics Agent。如要瞭解詳情,請參閱參考資料!