1. Introduction
Smoke test comprises of a non-exhaustive set of tests that aim at ensuring that the most important functions work. This is part of the overarching test plan identified for a baseline evaluation of BigQuery. Ideally, running through this with customers could eliminate some custom PoC work. The purpose of this codelab is to provide a step-by-step guide for conducting a smoke test on BigQuery queries and collecting their performance data.
What you will learn
- How to conduct a basic performance test for BigQuery
- How to measure and visualize the performance metrics in Data Studio
What you will need
What is BigQuery?
BigQuery is Google's fully managed, petabyte scale, analytics data warehouse. BigQuery is NoOps—there is no infrastructure to manage and you don't need a database administrator—so you can focus on analyzing data to find meaningful insights.
2. Smoke Test
The test plan defines scenarios to test and metrics to measure. For the smoke test, we will execute two types of queries:
OLAP query-Used to derive insights from multiple tables with aggregations and complex calculations.
Common query- Resource intensive query used commonly
Execute OLAP Query
In this use case, PowerApp users typically run a weekly report consisting of a query to obtain the aggregate sale amount for each POS transaction. Each transaction also states the customer, product, and product categories. This is an OLAP query with a four way join of facts and dimensions, aggregation of multiple columns and query processes a total of 105.1 GB of Data.
Open the BigQuery query editor and execute the following query:
Analytical query returning total sales amount by item and other product and customer features.
Execute common query
In the test plan, we have defined a "common query" as one that is resource intensive and is a common SQL construct. The common query we are going to execute is an update query that the manufacturing department uses when they have to update a SKU change in the product team. It processes about 450 MB of data and modifies 850 rows.
Before we update the product table, just to ensure data integrity, perform the following steps to update a copy of the table instead of the original one.
Copy Product dimension table
Open cloud shell and type the following command to create a copy of the Product dim table.
Be sure to replace <LDAP> with your LDAP.
bq cp AJ_Retail.POSDS_PROD_DIM_AJ AJ_Retail.POSDS_PROD_DIM_AJ_<LDAP>
Example:
bq cp AJ_Retail.POSDS_PROD_DIM_AJ AJ_Retail.POSDS_PROD_DIM_AJ_anaghadiwanji
In BigQuery Query Editor, run this query to update the table you just copied. Be sure to replace <LDAP> with your own.
## Common Query (Update)
update `edw-solution.AJ_Retail.POSDS_PROD_DIM_AJ_<LDAP>` set PROD_SKID= 3633 where CUST_ID=3230;
3. Measure performance of query
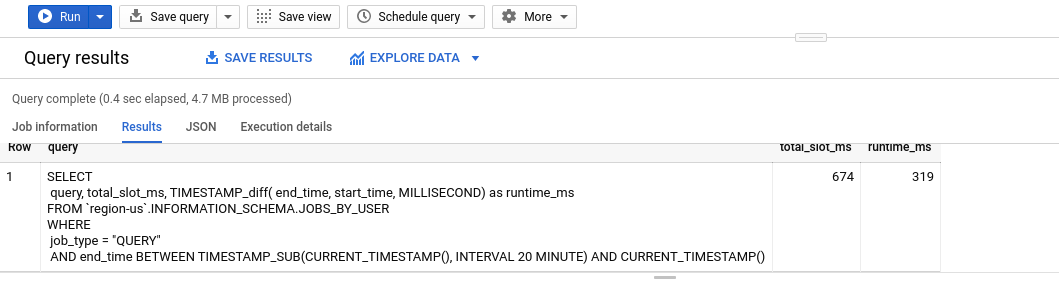
In this step we will calculate the total runtime and slot usage of the complex and common queries. Query metadata can be captured using INFORMATION_SCHEMA. Run following query in query editor:
SELECT
 query as Query, total_slot_ms, TIMESTAMP_diff( end_time, start_time, MILLISECOND) as runtime_ms
FROM `region-us`.INFORMATION_SCHEMA.JOBS_BY_USER
WHERE
 job_type = "QUERY"
 AND end_time BETWEEN TIMESTAMP_SUB(CURRENT_TIMESTAMP(), INTERVAL 20 MINUTE) AND CURRENT_TIMESTAMP()
The performance results can be easily visualized in Sheets or Data Studio using the "Explore data" feature in BigQuery UI
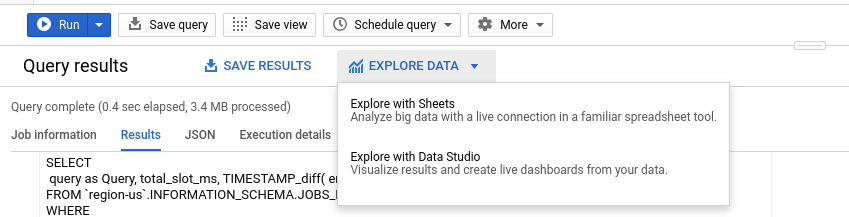
But rather than coming up with your own visualizations, follow the following steps to use an existing Data Studio dashboard for your results:
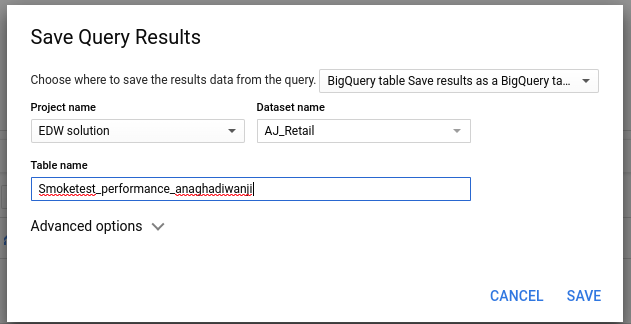
Save results in a table
Click on "Save result" , and choose "BigQuery table" to save them in.
Save the results in a table named Smoketest_performance_<LDAP> Be sure to replace <LDAP> with your own one. For example:
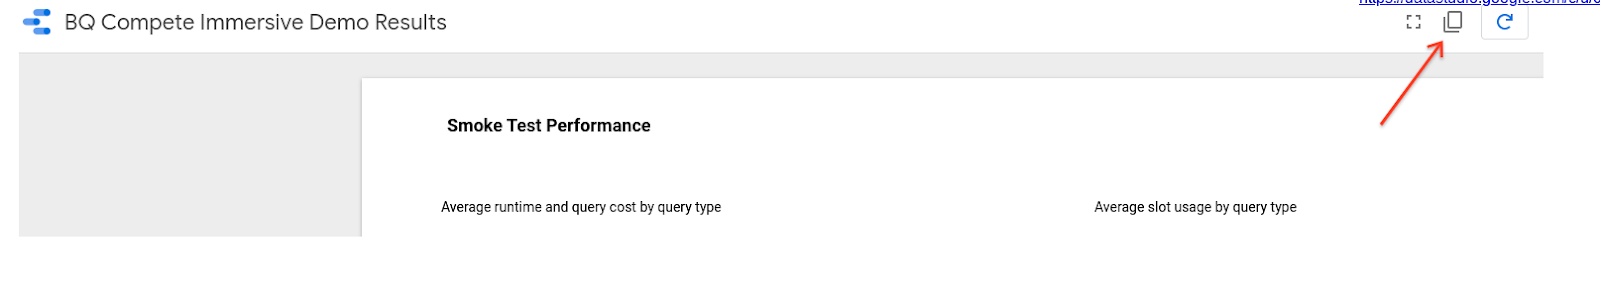
4. View the results in Data Studio
Create a copy of the sample dashboard by clicking on the copy button on top right of the screen.
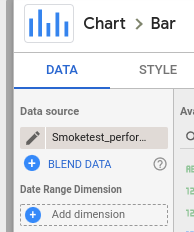
In the dropdown for "New data source" click on "Create new data source" 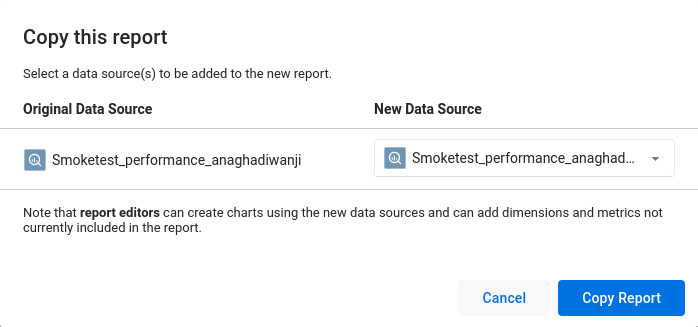
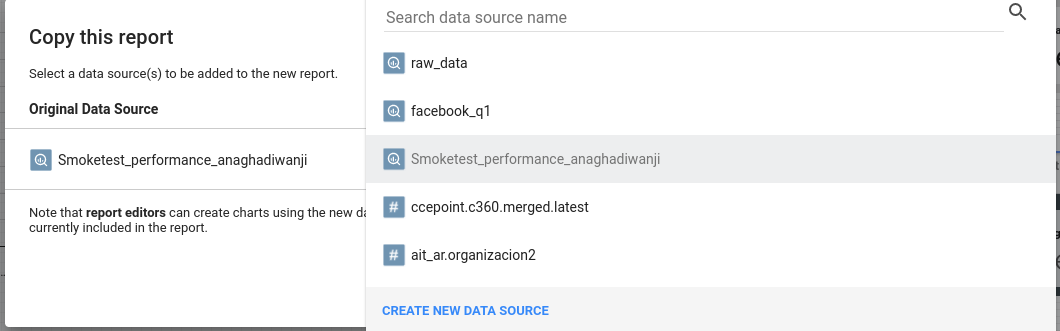
Click on "BigQuery"
Select project as "edw-solution"
Dataset as "AJ_Retail" and table as "Smoketest_Performance_<LDAP>
Click on "Add to report"
Click on each chart in the dashboard and ensure that data source is the new table you added