1. Introduction



Eventarc makes it easy to connect Google Cloud services with events from a variety of sources. It allows you to build event-driven architectures in which microservices are loosely coupled and distributed. It also takes care of event ingestion, delivery, security, authorization, and error-handling for you which improves developer agility and application resilience.
Datadog is a monitoring and security platform for cloud applications. It brings together end-to-end traces, metrics, and logs to make your applications, infrastructure, and third-party services observable.
Workflows is a fully-managed orchestration platform that executes services in an order that you define called a workflow. These workflows can combine services hosted on Cloud Run or Cloud Functions, Google Cloud services such as Cloud Vision AI and BigQuery, and any HTTP-based API.
In the first codelab, you learned how to route Datadog monitoring alerts to Google Cloud with Eventarc. In this second codelab, you will learn how to respond to Datadog monitoring alerts with Workflows. More specifically, you will create 2 Compute Engine Virtual Machines and monitor them with a Datadog monitor. Once 1 of the VMs are deleted, you will receive an alert from Datadog to Workflows via Eventarc. In turn, Workflows will recreate the deleted VM to get the number of running VMs back to 2.
What you'll learn
- How to enable Datadog's Google Cloud integration.
- How to create a workflow to check and create Compute Engine VMs.
- How to connect Datadog monitoring alerts to Workflows with Eventarc.
- How to create a Datadog monitor and alert on VM deletions.
2. Setup and Requirements
Self-paced environment setup
- Sign-in to the Google Cloud Console and create a new project or reuse an existing one. If you don't already have a Gmail or Google Workspace account, you must create one.


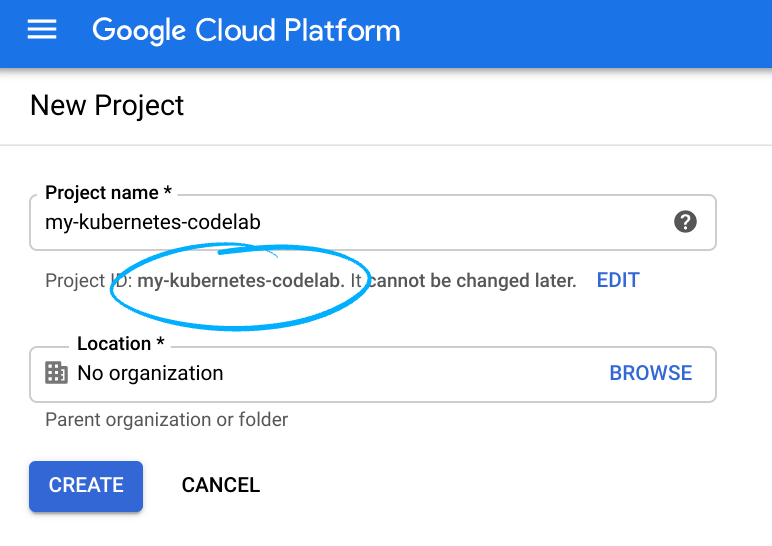
- The Project name is the display name for this project's participants. It is a character string not used by Google APIs, and you can update it at any time.
- The Project ID must be unique across all Google Cloud projects and is immutable (cannot be changed after it has been set). The Cloud Console auto-generates a unique string; usually you don't care what it is. In most codelabs, you'll need to reference the Project ID (and it is typically identified as
PROJECT_ID), so if you don't like it, generate another random one, or, you can try your own and see if it's available. Then it's "frozen" after the project is created. - There is a third value, a Project Number which some APIs use. Learn more about all three of these values in the documentation.
- Next, you'll need to enable billing in the Cloud Console in order to use Cloud resources/APIs. Running through this codelab shouldn't cost much, if anything at all. To shut down resources so you don't incur billing beyond this tutorial, follow any "clean-up" instructions found at the end of the codelab. New users of Google Cloud are eligible for the $300 USD Free Trial program.
Start Cloud Shell
While Google Cloud can be operated remotely from your laptop, in this codelab you will be using Google Cloud Shell, a command line environment running in the Cloud.
From the Google Cloud Console, click the Cloud Shell icon on the top right toolbar:

It should only take a few moments to provision and connect to the environment. When it is finished, you should see something like this:

This virtual machine is loaded with all the development tools you'll need. It offers a persistent 5GB home directory, and runs on Google Cloud, greatly enhancing network performance and authentication. All of your work in this lab can be done with simply a browser.
Set up gcloud
In Cloud Shell, set your project ID and save it as the PROJECT_ID variable.
Also, set a REGION variable to us-central1. This is the region you will create resources in later.
PROJECT_ID=[YOUR-PROJECT-ID]
REGION=us-central1
gcloud config set core/project $PROJECT_ID
Enable APIs
Enable all necessary services:
gcloud services enable \
  workflows.googleapis.com \
  workflowexecutions.googleapis.com
3. Verify the Datadog channel
Make sure that the Datadog channel you created in the first codelab is active. In Cloud Shell, run the following command to retrieve the details of the channel:
CHANNEL_NAME=datadog-channel
gcloud eventarc channels describe $CHANNEL_NAME --location $REGION
The output should be similar to the following:
activationToken: so5g4Kdasda7y2MSasdaGn8njB2
createTime: '2022-03-09T09:53:42.428978603Z'
name: projects/project-id/locations/us-central1/channels/datadog-channel
provider: projects/project-id/locations/us-central1/providers/datadog
pubsubTopic: projects/project-id/topics/eventarc-channel-us-central1-datadog-channel-077
state: ACTIVE
uid: 183d3323-8cas-4e95-8d72-7d8c8b27cf9e
updateTime: '2022-03-09T09:53:48.290217299Z'
You can also see the channel state in Google Cloud Console:
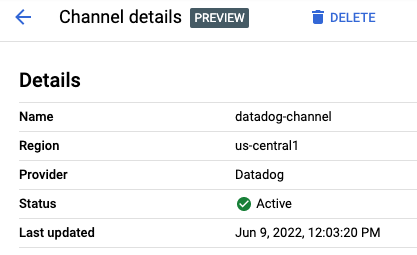
The channel state should be ACTIVE. If not, go back to the first codelab and follow the steps to create and activate a channel with Datadog.
4. Enable Datadog's Google Cloud integration
To use Datadog to monitor a project, you need to enable APIs needed for Datadog, create a service account, and connect the service account to Datadog.
Enable APIs for Datadog
gcloud services enable compute.googleapis.com \
  cloudasset.googleapis.com \
  monitoring.googleapis.com
Create a service account
Datadog's Google Cloud integration uses a service account to make calls to the Cloud Logging API to collect node-level metrics from your Compute Engine instances.
Create a service account for Datadog:
DATADOG_SA_NAME=datadog-service-account

gcloud iam service-accounts create $DATADOG_SA_NAME \
    --display-name "Datadog Service Account"
Enable the Datadog service account to collect metrics, tags, events, and user labels by granting the following IAM roles:
DATADOG_SA_EMAIL=$DATADOG_SA_NAME@$PROJECT_ID.iam.gserviceaccount.com

gcloud projects add-iam-policy-binding $PROJECT_ID \
    --member serviceAccount:$DATADOG_SA_EMAIL \
    --role roles/cloudasset.viewer

gcloud projects add-iam-policy-binding $PROJECT_ID \
    --member serviceAccount:$DATADOG_SA_EMAIL \
    --role roles/compute.viewer

gcloud projects add-iam-policy-binding $PROJECT_ID \
    --member serviceAccount:$DATADOG_SA_EMAIL \
    --role roles/monitoring.viewer
Create and download a service account key. You need the key file to complete the integration with Datadog.
Create a service account key file in your Cloud Shell home directory:
gcloud iam service-accounts keys create ~/key.json \
  --iam-account $DATADOG_SA_EMAIL
In Cloud Shell, click More ⁝ and then select Download File. In the File path field, enter key.json. To download the key file, click Download.
Connect the service account to Datadog
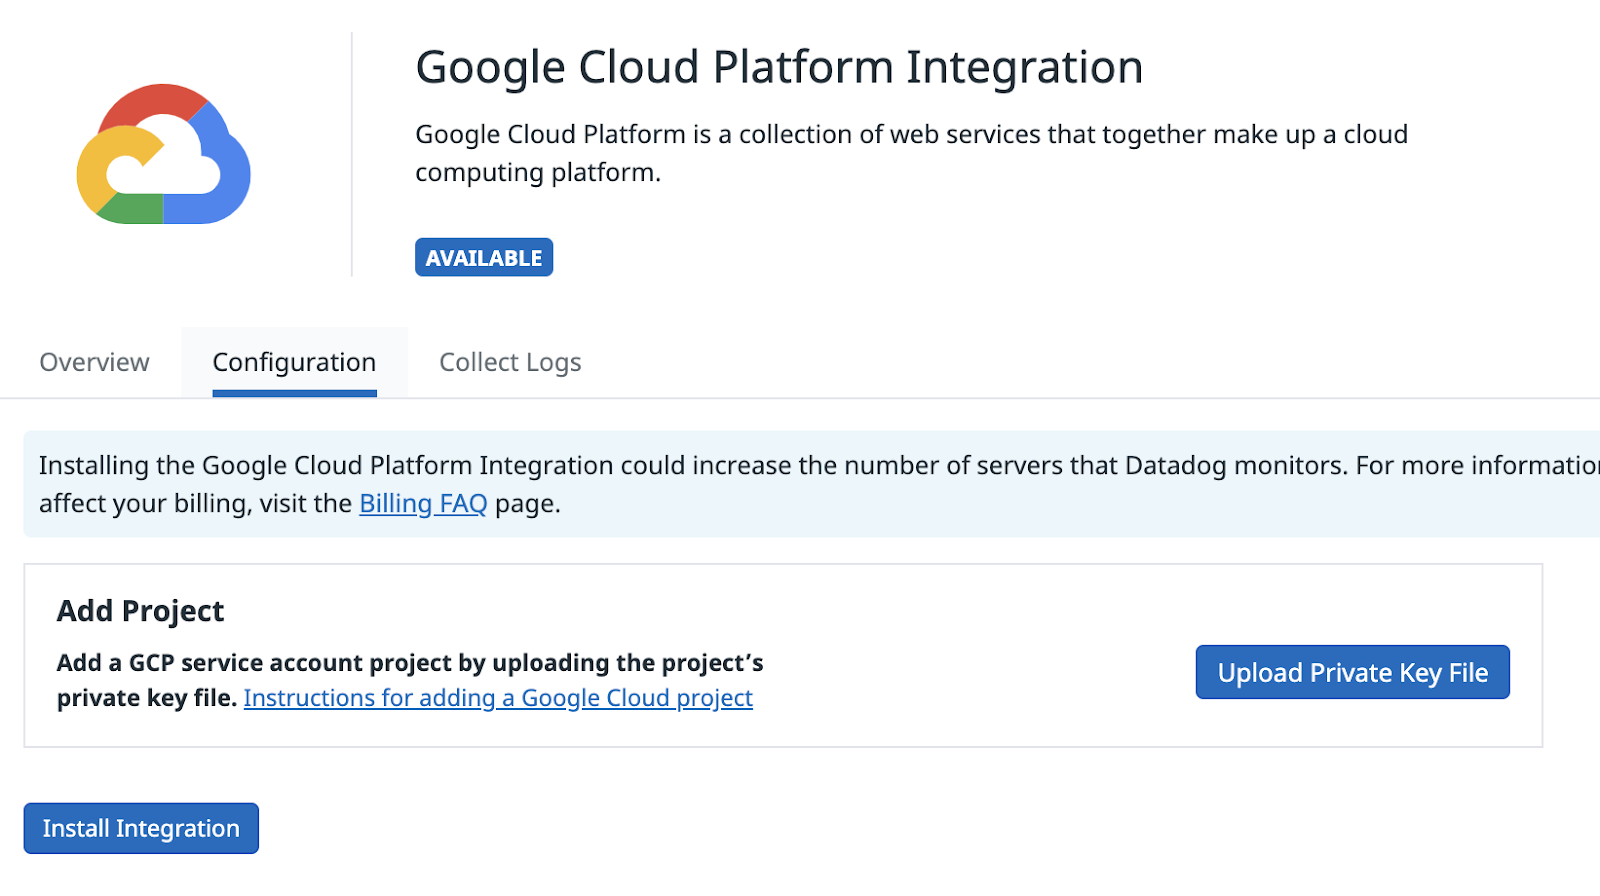
In your Datadog account, go to the Integrations section and search for Google Cloud integration tile:
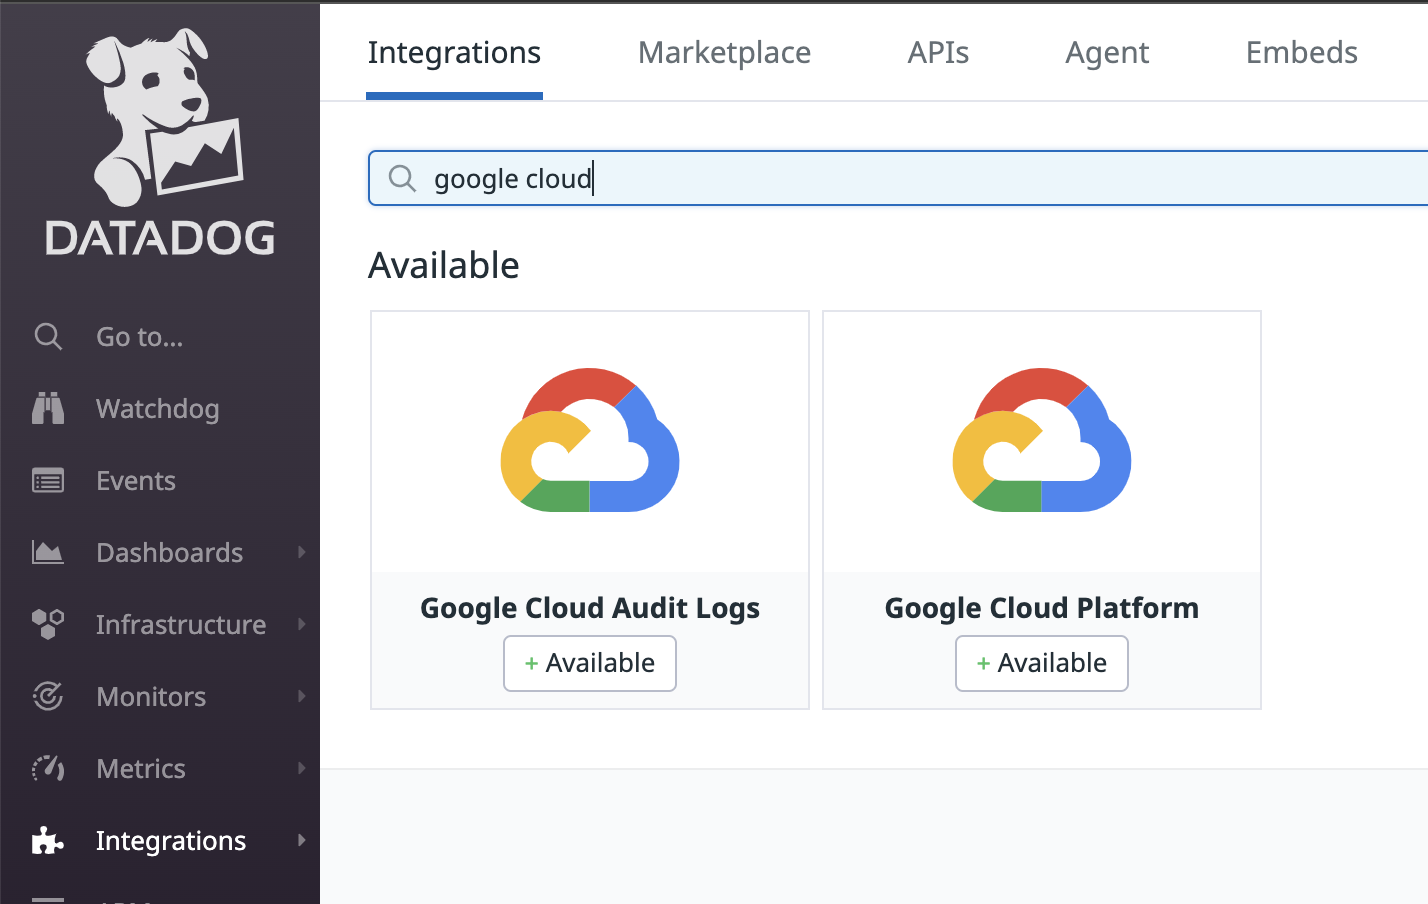
Hover over Google Cloud Platform to go to the Install page:
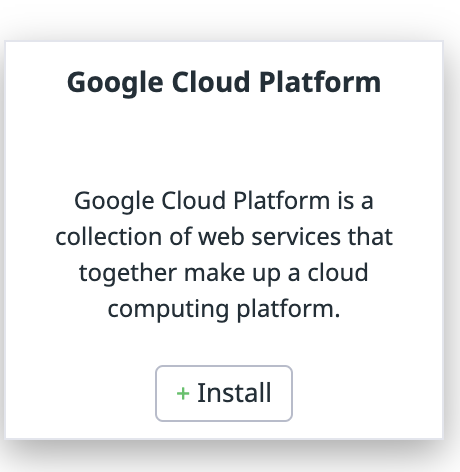
Install the integration by uploading the service account key in Upload Private Key File section and then clicking on Install Integration:
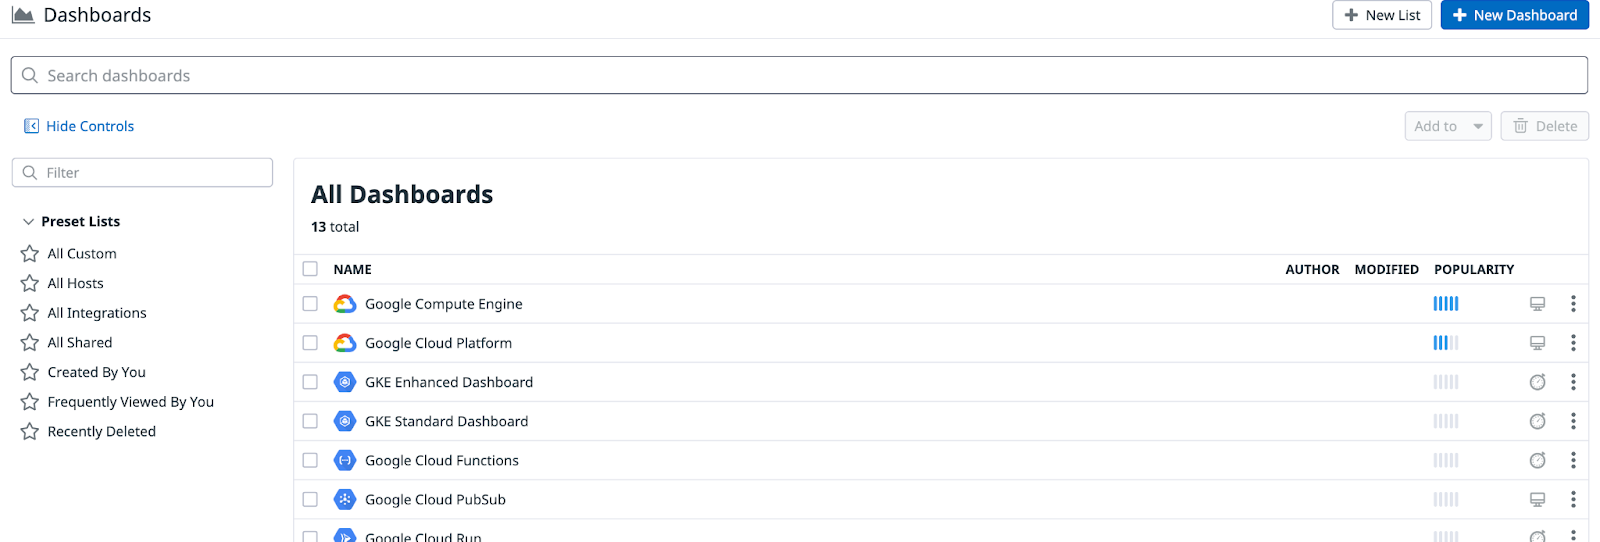
After you complete the integration, Datadog automatically creates a number of Google Cloud related dashboards under Dashboards:
5. Create Compute Engine VMs
Next, create some Compute Engine Virtual Machines (VMs). You will monitor these VMs with a Datadog monitor and respond to Datadog alerts with a workflow in Google Cloud.
Create 2 Compute Engine VMs:
gcloud compute instances create instance-1 instance-2 --zone us-central1-a
You should see VMs created and running in a minute or so in the Cloud Console. After some time (typically 10 mins), you should also see these VMs in Datadog in the Google Compute Engine dashboard under Dashboards:

6. Create a workflow
Now that you have 2 VMs running, create a workflow that will respond to alerts from a Datadog monitor. The workflow can be as sophisticated as you like but in this case, the workflow will check the number of VM instances running and if it falls below 2, it will create new VM instances to make sure there are 2 VMs running at all times.
Create a workflow-datadog2.yaml file with the following contents:
main:
  params: [event]
  steps:
  - init:
      assign:
      - projectId: ${sys.get_env("GOOGLE_CLOUD_PROJECT_ID")}
      - zone: "us-central1-a"
      - minInstanceCount: 2
      - namePattern: "datadog-instance-##"
  - listInstances:
      call: googleapis.compute.v1.instances.list
      args:
        project: ${projectId}
        zone: ${zone}
      result: listResult
  - getInstanceCount:
      steps:
          - initInstanceCount:
              assign:
                - instanceCount: 0
          - setInstanceCount:
              switch:
                - condition: ${"items" in listResult}
                  steps:
                    - stepA:
                        assign:
                          - instanceCount: ${len(listResult.items)}
  - findDiffInstanceCount:
      steps:
        - assignDiffInstanceCount:
            assign:
              - diffInstanceCount: ${minInstanceCount - instanceCount}
        - logDiffInstanceCount:
            call: sys.log
            args:
              data: ${"instanceCount->" + string(instanceCount) + " diffInstanceCount->" + string(diffInstanceCount)}
        - endEarlyIfNeeded:
            switch:
              - condition: ${diffInstanceCount < 1}
                next: returnResult
  - bulkInsert:
      call: googleapis.compute.v1.instances.bulkInsert
      args:
          project: ${projectId}
          zone: ${zone}
          body:
              count: ${diffInstanceCount}
              namePattern: ${namePattern}
              instanceProperties:
                  machineType: "e2-micro"
                  disks:
                  - autoDelete: true
                    boot: true
                    initializeParams:
                      sourceImage: projects/debian-cloud/global/images/debian-10-buster-v20220310
                  networkInterfaces:
                  - network: "global/networks/default"
      result: bulkInsertResult
  - returnResult:
      return: ${bulkInsertResult}
Note that the workflow is receiving an event as a parameter. This event will come from Datadog monitoring via Eventarc. Once the event is received, the workflow checks the number of running instances and creates new VM instances, if needed.
Deploy the workflow:
WORKFLOW_NAME=workflow-datadog2
gcloud workflows deploy $WORKFLOW_NAME \
  --source workflow-datadog2.yaml \
  --location $REGION
The workflow is deployed but it's not running yet. It will be executed by an Eventarc trigger when a Datadog alert is received.
7. Create an Eventarc trigger
You are now ready to connect events from the Datadog provider to Workflows with an Eventarc trigger. You will use the channel and the service account you set up in the first codelab.
Create a trigger with the Datadog channel, event type and also a workflow destination:
PROJECT_NUMBER=$(gcloud projects describe $PROJECT_ID --format='value(projectNumber)')

gcloud eventarc triggers create datadog-trigger2 \
  --location $REGION \
  --destination-workflow $WORKFLOW_NAME \
  --destination-workflow-location $REGION \
  --channel $CHANNEL_NAME \
  --event-filters type=datadog.v1.alert \
  --service-account $PROJECT_NUMBER-compute@developer.gserviceaccount.com
You can list the triggers to see that the newly created trigger is active:
gcloud eventarc triggers list --location $REGION

NAME: datadog-trigger2
TYPE: datadog.v1.alert
DESTINATION: Workflows: workflow-datadog2
ACTIVE: Yes
8. Create a Datadog monitor
You will now create a Datadog monitor and connect it to Eventarc.
The monitor will check the number of Compute Engine VMs running and alert if it falls below 2.
To create a monitor in Datadog, log in to Datadog. Hover over Monitors in the main menu and click New Monitor in the sub-menu. There are many monitor types. Choose the Metric monitor type.
In the New Monitor page, create a monitor with the following:
- Choose the detection method:
Threshold. - Define the metric:
gcp.gce.instance.is_runningfrom (everywhere)sum by(everything) - Set alert conditions:
- Trigger when the metric is
belowthe thresholdat least onceduring the last5 minutes - Alert threshold:
< 2 - Notify your team:
@eventarc_<your-project-id>_<your-region>_<your-channel-name> - Example Monitor name:
Compute Engine instances < 2
Now, hit Create at the bottom to create the monitor.
9. Test monitor and trigger
To test the Datadog monitor, the Eventarc trigger and eventually the workflow, you will delete one of the VMs:
gcloud compute instances delete instance-2 --zone us-central1-a
After a few seconds, you should see the instance deleted in Google Cloud Console.
There's a bit of latency for this change to show up in Datadog. After some time (typically 10 mins), you should see the monitor in Datadog to detect and alert this under Manage Monitors section:
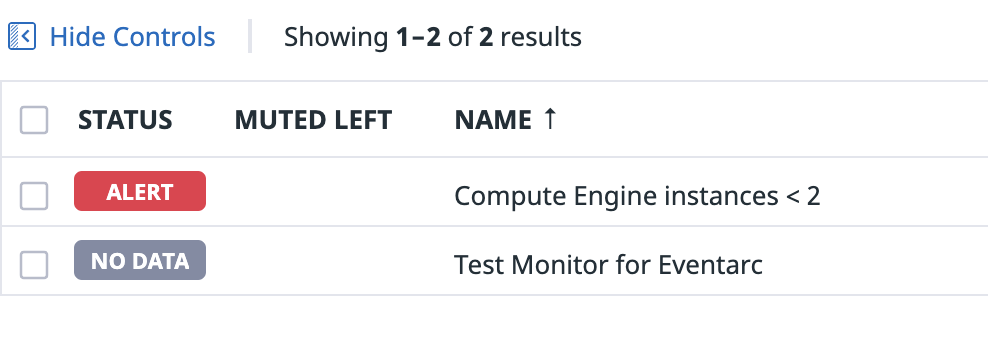
Once the Datadog monitor alerts, you should see that alert go to Workflows via Eventarc. If you check the logs of Workflows, you should see that Workflows checks to find out the difference between the current instance count and expected instance count:
2022-03-28 09:30:53.371 BST instanceCount->1 diffInstanceCount->1
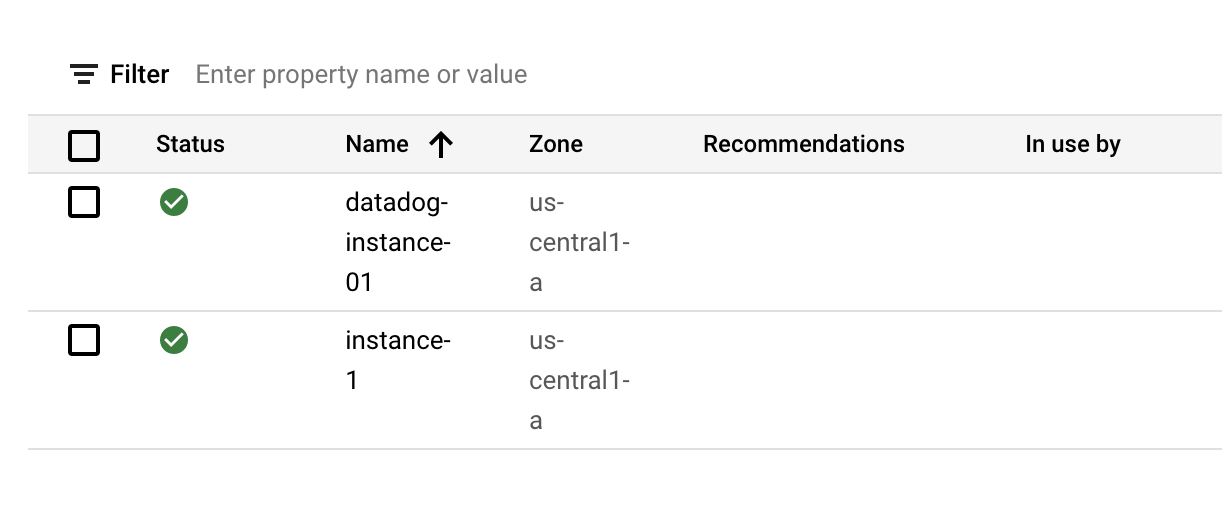
It responds to that alert by creating a new VM instance with datadog-instance-## prefix.
In the end, you will still have 2 VMs in your project, one you created initially and the other one created by Workflows after the Datadog alert!
10. Congratulations
Congratulations, you finished the codelab!
What we've covered
- How to enable Datadog's Google Cloud integration.
- How to create a workflow to check and create Compute Engine VMs.
- How to connect Datadog monitoring alerts to Workflows with Eventarc.
- How to create a Datadog monitor and alert on VM deletions.
