1. Introduction

Google Cloud Dataflow
Last Updated: 2020-May-26
What is Dataflow?
Dataflow is a managed service for executing a wide variety of data processing patterns. The documentation on this site shows you how to deploy your batch and streaming data processing pipelines using Dataflow, including directions for using service features.
The Apache Beam SDK is an open source programming model that enables you to develop both batch and streaming pipelines. You create your pipelines with an Apache Beam program and then run them on the Dataflow service. The Apache Beam documentation provides in-depth conceptual information and reference material for the Apache Beam programming model, SDKs, and other runners.
Streaming data analytics with speed
Dataflow enables fast, simplified streaming data pipeline development with lower data latency.
Simplify operations and management
Allow teams to focus on programming instead of managing server clusters as Dataflow's serverless approach removes operational overhead from data engineering workloads.
Reduce total cost of ownership
Resource autoscaling paired with cost-optimized batch processing capabilities means Dataflow offers virtually limitless capacity to manage your seasonal and spiky workloads without overspending.
Key features
Automated resource management and dynamic work rebalancing
Dataflow automates provisioning and management of processing resources to minimize latency and maximize utilization so that you do not need to spin up instances or reserve them by hand. Work partitioning is also automated and optimized to dynamically rebalance lagging work. No need to chase down "hot keys" or preprocess your input data.
Horizontal autoscaling
Horizontal autoscaling of worker resources for optimum throughput results in better overall price-to-performance.
Flexible resource scheduling pricing for batch processing
For processing with flexibility in job scheduling time, such as overnight jobs, flexible resource scheduling (FlexRS) offers a lower price for batch processing. These flexible jobs are placed into a queue with a guarantee that they will be retrieved for execution within a six-hour window.
What you will run as part of this
In this codelab, you're going to begin using Dataflow SQL by submitting a SQL statement through the Dataflow SQL UI. You will then explore the pipeline running by using the Dataflow monitoring UI.
What you'll learn
- How to submit a SQL statement as a Dataflow job in the Dataflow SQL UI.
- How to navigate to the Dataflow Pipeline.
- Explore the Dataflow graph created by the SQL statement.
- Explore monitoring information provided by the graph.
What you'll need
- A Google Cloud Platform project with Billing enabled.
- Google Cloud Dataflow and Google Cloud PubSub enabled.
2. Getting set up
Ensure that you have the Dataflow API and Cloud Pub/Sub API enabled. You can verify this by checking on the API's & Services page.
3. Accessing the Dataflow SQL UI
The Dataflow SQL UI is a BigQuery web UI setting for creating Dataflow SQL jobs. You can access the Dataflow SQL UI from the BigQuery web UI.
- Go to the BigQuery web UI.
- Switch to the Cloud Dataflow engine.
- Click the More drop-down menu and select Query settings.

- In the Query settings menu, select Dataflow engine.
- In the prompt that appears if the Dataflow and Data Catalog APIs are not enabled, click Enable APIs.

- Click Save.

You can also access the Dataflow SQL UI from the Dataflow monitoring interface.
- Go to the Dataflow monitoring interface.
- Click Create job from SQL.
4. Running a Dataflow Job with a SQL Query
Writing Dataflow SQL queries
Dataflow SQL queries use the Dataflow SQL query syntax. The Dataflow SQL query syntax is similar to BigQuery standard SQL. You can use the Dataflow SQL streaming extensions to aggregate data from continuously updating Dataflow sources like Pub/Sub. For example, the following query counts the passengers in a Pub/Sub stream of taxi rides every minute:
SELECT
  TUMBLE_START('INTERVAL 1 MINUTE') as period_start,
  SUM(passenger_count) AS pickup_count
FROM pubsub.topic.`pubsub-public-data`.`taxirides-realtime`
WHERE
  ride_status = "pickup"
GROUP BY
  TUMBLE(event_timestamp, 'INTERVAL 1 MINUTE')
Running Dataflow SQL queries
When you run a Dataflow SQL query, Dataflow turns the query into an Apache Beam pipeline and executes the pipeline.
You can run a Dataflow SQL query using the Cloud Console or gcloud command-line tool.
To run a Dataflow SQL query, use the Dataflow SQL UI.
- Go to the Dataflow SQL UI.
- Enter the Dataflow SQL query above into the query editor.
- Click Create Cloud Dataflow job to open a panel of job options.
- (Optional) Click Show optional parameters and browse the list.
- In the Destination section of the panel, select BigQuery as the Output type.

- Select a Dataset ID and create a table name "passengers_per_min"
- Click Create.
For more information about querying data and writing Dataflow SQL query results, see Use Dataflow SQL.
5. Exploring the job on the Dataflow Monitoring UI
When you execute your pipeline using the Dataflow managed service, you can view that job and any others by using Dataflow's web-based monitoring user interface. The monitoring interface lets you see and interact with your Dataflow jobs.
You can access the Dataflow monitoring interface by using the Google Cloud Console. The monitoring interface can show you:
- A list of all currently running Dataflow jobs and previously run jobs within the last 30 days.
- A graphical representation of each pipeline.
- Details about your job's status, execution, and SDK version.
- Links to information about the Google Cloud services running your pipeline, such as Compute Engine and Cloud Storage.
- Any errors or warnings that occur during a job.
You can view job monitoring charts within the Dataflow monitoring interface. These charts display metrics over the duration of a pipeline job and include the following information:
- Step-level visibility to help identify which steps might be causing pipeline lag.
- Statistical information that can surface anomalous behavior.
- I/O metrics that can help identify bottlenecks in your sources and sinks.
Accessing the Dataflow monitoring interface
To access the Dataflow monitoring interface, follow these steps:
- Goto the cloud console:
- Select your Google Cloud project.
- Click the menu in the upper left corner.
- Navigate to the Big Data section and click Dataflow.
A list of Dataflow jobs appears along with their status.

A list of Dataflow jobs in the Cloud Console with jobs in the Running, Failed, and Succeeded states.
A job can have the following statuses:
- —: the monitoring UI has not yet received a status from the Dataflow service.
- Running: the job is currently running.
- Not started: the job is created, but the system needs some time to prepare before launching.
- Queued: a FlexRS job is queued.
- Cancelling...: the job is being cancelled.
- Canceled: the job that was canceled by the user.
- Draining...: the job is being drained.
- Drained: the user drained the job.
- Updating...: the job is being updated.
- Updated: the user updated the job.
- Succeeded: the job has finished successfully.
- Failed: the job failed to complete.
Look for the job with "dfsql" as part of the job title and click on its name.

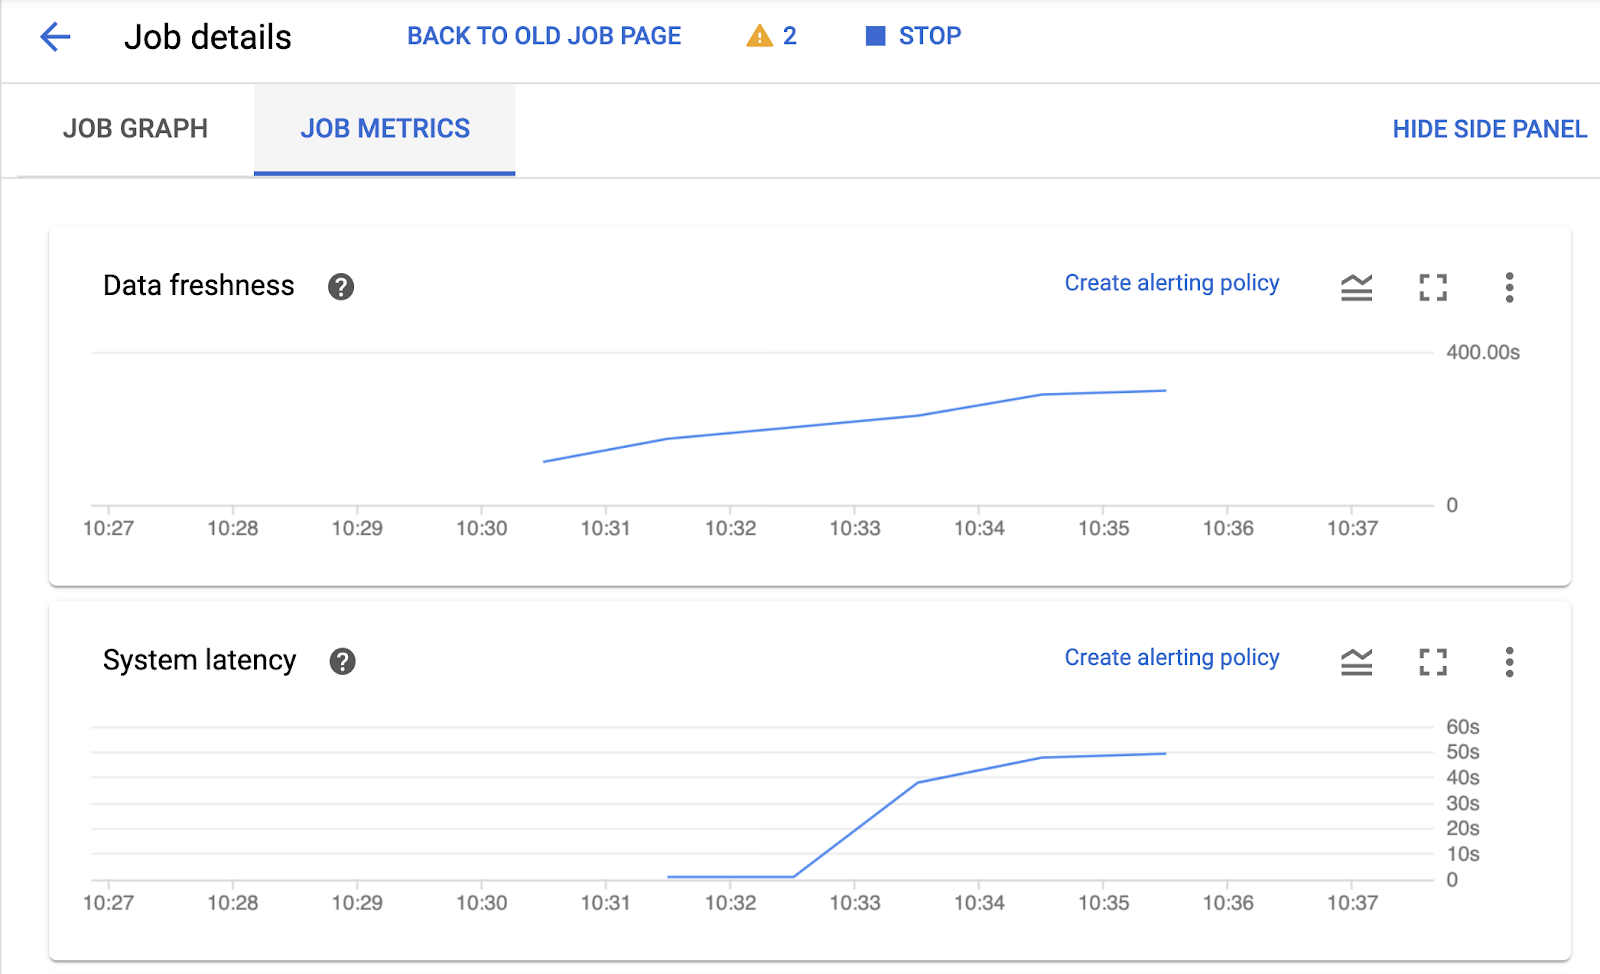
The Job details page, which contains the following:
- Job graph: the visual representation of your pipeline
- Job metrics: metrics about the execution of your job
- Job info panel: descriptive information about your pipeline
- Job logs: logs generated by the Dataflow service at the job level
- Worker logs: logs generated by the Dataflow service at at the worker level
- Job error reporting: charts showing where errors occurred along the chosen timeline and a count of all logged errors
- Time selector: tool that lets you adjust the timespan of your metrics
Within the Job details page, you can switch your job view with the Job graph and Job metrics tab.
- Click on the JOB METRICS tab and explore the charts
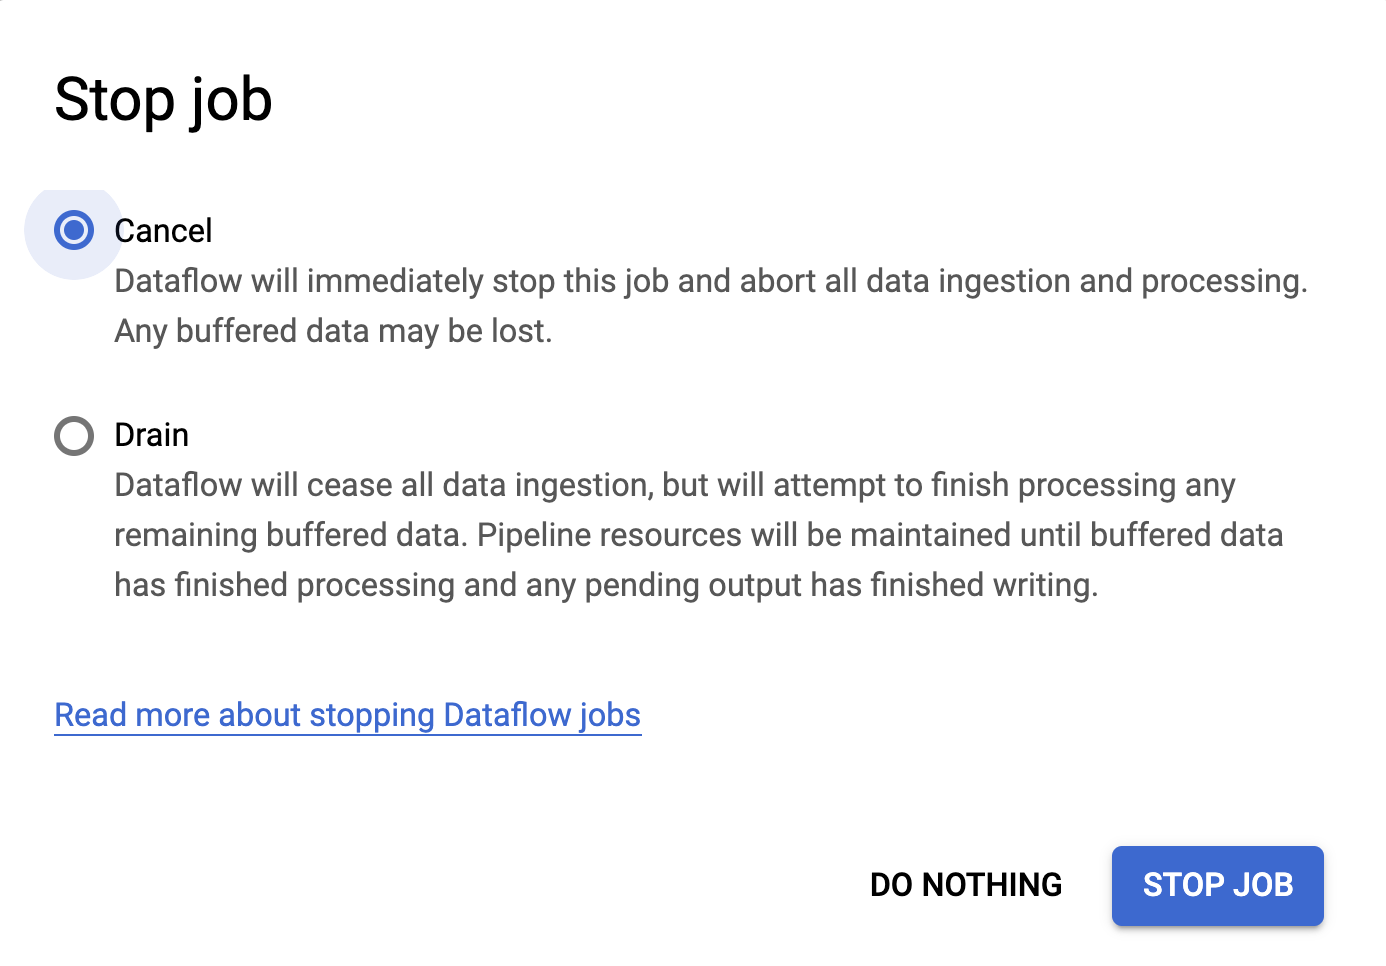
6. Stopping your Dataflow SQL job
To stop Dataflow SQL jobs, use the Cancel command. Stopping a Dataflow SQL job with Drain is not supported.