
1. Introduction
In this codelab, you will learn how to use BigQuery Graph to model and analyze a drug-target interaction network. You will leverage the power of graph queries (GQL) to explore how drugs interact with biological targets, identify potential side effects (such as cardiac risks), and uncover potential combination therapies.
🧬 Use Case — Drug-Target Interaction Network
Business question: What is the full blast radius of a compound — which targets does it bind, which biological pathways are affected, and what disease areas are implicated?
Tables:
Table | Description |
| Drug molecules with mechanism of action and development stage |
| Protein targets with gene names and UniProt IDs |
| Compound-target binding affinity (primary targets + off-targets) |
| Biological pathways with disease area associations |
| Junction table linking targets to the pathways they participate in |
Property graph model:
(Compound)-[BINDS_TO {affinity_nm, ic50_nm, interaction_type}]->(Target)
(Target)-[PARTICIPATES_IN {role, importance_score}]->(Pathway)
🔍 Demo Queries
Query | What it shows |
Q1: Target binding profile | 1-hop traversal — compound to all primary and off-targets |
Q2: hERG cardiac risk detection | 2-hop traversal — compound → hERG target → cardiac pathway |
Q3: Shared-target compound pairs | Bidirectional match — two compounds converging on the same target node |
Q4: Disease pathway blast radius | 2-hop aggregation — full pathway and disease area coverage per compound |
Q5: Safe compound selection | Compounds with high oncology coverage but no hERG cardiac liability |
What you'll do
- Create a BigQuery dataset and schema for the drug interaction network
- Load sample data (Compounds, Targets, Interactions, Pathways, Target Pathways)
- Create a Property Graph in BigQuery connecting these entities
- Query the graph to understand compound interactions, biological pathways, and disease blast radius using graph traversals (
GRAPH_TABLEandMATCH) - Compare GQL and standard SQL side-by-side to understand the simplicity and expressive power of graph syntax
What you'll need
- A web browser such as Chrome
- A Google Cloud project with billing enabled
This codelab is for developers of all levels, including beginners.
2. Before you begin
Create a Google Cloud Project
- In the Google Cloud Console, select or create a Google Cloud project.
- Make sure that billing is enabled for your Cloud project.
Start Cloud Shell
- Click Activate Cloud Shell at the top of the Google Cloud console.
- Verify authentication:
gcloud auth list
- Confirm your project:
gcloud config get project
- Set it if needed:
export PROJECT_ID=<YOUR_PROJECT_ID>
gcloud config set project $PROJECT_ID
Enable APIs
Run this command to enable the required BigQuery API:
gcloud services enable bigquery.googleapis.com
3. Define the Schema and Load Data
First, you need to create a dataset to store your graph-related tables and populate them with sample data.
- Go to BigQuery Studio in the Google Cloud Console.
- Click on the SQL Editor to open a new query tab.
- Run the following statement to create the
drug_target_graphdataset:
CREATE SCHEMA IF NOT EXISTS drug_target_graph
OPTIONS (location = 'US');
Now, create the 5 source tables by running the following DDL queries in BigQuery Studio.
1. Create compounds Table
Contains drug molecules, their mechanism of action, development stage, and therapeutic area.
CREATE OR REPLACE TABLE drug_target_graph.compounds AS
SELECT 'CPD001' AS compound_id, 'Imatinib'    AS compound_name, 'Kinase Inhibitor'       AS mechanism_of_action, 'Approved'    AS dev_stage, 'Oncology'           AS therapeutic_area, 479.6 AS molecular_weight UNION ALL
SELECT 'CPD002', 'Gefitinib',   'Kinase Inhibitor',        'Approved',    'Oncology',           446.9 UNION ALL
SELECT 'CPD003', 'Erlotinib',   'Kinase Inhibitor',        'Approved',    'Oncology',           393.4 UNION ALL
SELECT 'CPD004', 'Sorafenib',   'Multi-Kinase Inhibitor',  'Approved',    'Oncology',           464.8 UNION ALL
SELECT 'CPD005', 'Vemurafenib', 'BRAF Inhibitor',          'Approved',    'Oncology',           489.9 UNION ALL
SELECT 'CPD006', 'Crizotinib',  'ALK Inhibitor',           'Approved',    'Oncology',           450.3 UNION ALL
SELECT 'CPD007', 'Idelalisib',  'PI3K Inhibitor',          'Approved',    'Oncology',           415.4 UNION ALL
SELECT 'CPD008', 'Trametinib',  'MEK Inhibitor',           'Approved',    'Oncology',           615.4 UNION ALL
SELECT 'CPD009', 'Palbociclib', 'CDK Inhibitor',           'Approved',    'Oncology',           447.5 UNION ALL
SELECT 'CPD010', 'Compound-X1', 'Kinase Inhibitor',        'Phase II',    'Oncology',           412.3 UNION ALL
SELECT 'CPD011', 'Compound-X2', 'PI3K Inhibitor',          'Phase I',     'Oncology',           398.7 UNION ALL
SELECT 'CPD012', 'Saquinavir',  'Protease Inhibitor',      'Approved',    'Infectious Disease', 670.8 UNION ALL
SELECT 'CPD013', 'Metformin',   'AMPK Activator',          'Approved',    'Metabolic',          165.6 UNION ALL
SELECT 'CPD014', 'Rapamycin',   'mTOR Inhibitor',          'Approved',    'Immunology',         914.2 UNION ALL
SELECT 'CPD015', 'Compound-X3', 'Multi-Kinase Inhibitor',  'Preclinical', 'Oncology',           502.1;
2. Create targets Table
Contains protein targets, gene names, UniProt IDs, and target classes.
CREATE OR REPLACE TABLE drug_target_graph.targets AS
SELECT 'TGT001' AS target_id, 'BCR-ABL1'    AS target_name, 'ABL1'    AS gene_name, 'P00519' AS uniprot_id, 'Kinase'       AS target_class, TRUE  AS is_oncogene UNION ALL
SELECT 'TGT002', 'EGFR',      'EGFR',    'P00533', 'Kinase',       TRUE  UNION ALL
SELECT 'TGT003', 'VEGFR2',    'KDR',     'P35968', 'Kinase',       FALSE UNION ALL
SELECT 'TGT004', 'BRAF',      'BRAF',    'P15056', 'Kinase',       TRUE  UNION ALL
SELECT 'TGT005', 'ALK',       'ALK',     'Q9UM73', 'Kinase',       TRUE  UNION ALL
SELECT 'TGT006', 'PI3K-alpha','PIK3CA',  'P42336', 'Lipid Kinase', TRUE  UNION ALL
SELECT 'TGT007', 'MEK1',      'MAP2K1',  'Q02750', 'Kinase',       FALSE UNION ALL
SELECT 'TGT008', 'CDK4',      'CDK4',    'P11802', 'Kinase',       FALSE UNION ALL
SELECT 'TGT009', 'CDK6',      'CDK6',    'P30279', 'Kinase',       FALSE UNION ALL
SELECT 'TGT010', 'mTOR',      'MTOR',    'P42345', 'Kinase',       FALSE UNION ALL
SELECT 'TGT011', 'PDGFR-beta','PDGFRB',  'P09619', 'Kinase',       FALSE UNION ALL
SELECT 'TGT012', 'c-KIT',     'KIT',     'P10721', 'Kinase',       TRUE  UNION ALL
SELECT 'TGT013', 'hERG',      'KCNH2',   'Q12809', 'Ion Channel',  FALSE UNION ALL
SELECT 'TGT014', 'AMPK',      'PRKAA1',  'Q13131', 'Kinase',       FALSE UNION ALL
SELECT 'TGT015', 'RAF1',      'RAF1',    'P04049', 'Kinase',       FALSE UNION ALL
SELECT 'TGT016', 'RET',       'RET',     'P07949', 'Kinase',       TRUE  UNION ALL
SELECT 'TGT017', 'FLT3',      'FLT3',    'P36888', 'Kinase',       TRUE  UNION ALL
SELECT 'TGT018', 'AKT1',      'AKT1',    'P31749', 'Kinase',       FALSE UNION ALL
SELECT 'TGT019', 'ERK2',      'MAPK1',   'P28482', 'Kinase',       FALSE UNION ALL
SELECT 'TGT020', 'HIV-Protease','HIV1-PR','Q72547', 'Protease',     FALSE;
3. Create interactions Table
Contains compound-target binding affinity data (primary targets vs off-targets).
CREATE OR REPLACE TABLE drug_target_graph.interactions AS
SELECT 'INT001' AS interaction_id, 'CPD001' AS compound_id, 'TGT001' AS target_id, 0.025  AS affinity_nm, 0.038  AS ic50_nm, 'primary'    AS interaction_type, 9.8  AS pchembl_value UNION ALL
SELECT 'INT002', 'CPD001', 'TGT011', 0.1,    0.15,   'primary',    8.8  UNION ALL
SELECT 'INT003', 'CPD001', 'TGT012', 0.068,  0.1,    'primary',    9.2  UNION ALL
SELECT 'INT004', 'CPD001', 'TGT016', 0.5,    0.8,    'off-target', 7.4  UNION ALL
SELECT 'INT005', 'CPD001', 'TGT013', 5.2,    8.1,    'off-target', 6.1  UNION ALL
SELECT 'INT006', 'CPD002', 'TGT002', 0.02,   0.033,  'primary',    9.7  UNION ALL
SELECT 'INT007', 'CPD002', 'TGT013', 3.1,    4.8,    'off-target', 6.5  UNION ALL
SELECT 'INT008', 'CPD003', 'TGT002', 0.058,  0.079,  'primary',    9.2  UNION ALL
SELECT 'INT009', 'CPD003', 'TGT013', 8.5,    12.0,   'off-target', 5.9  UNION ALL
SELECT 'INT010', 'CPD004', 'TGT003', 0.09,   0.12,   'primary',    9.1  UNION ALL
SELECT 'INT011', 'CPD004', 'TGT004', 0.038,  0.055,  'primary',    8.9  UNION ALL
SELECT 'INT012', 'CPD004', 'TGT015', 0.22,   0.31,   'primary',    8.5  UNION ALL
SELECT 'INT013', 'CPD004', 'TGT016', 0.58,   0.75,   'primary',    8.1  UNION ALL
SELECT 'INT014', 'CPD004', 'TGT017', 0.33,   0.48,   'primary',    8.4  UNION ALL
SELECT 'INT015', 'CPD004', 'TGT013', 2.8,    4.1,    'off-target', 6.6  UNION ALL
SELECT 'INT016', 'CPD005', 'TGT004', 0.031,  0.044,  'primary',    9.5  UNION ALL
SELECT 'INT017', 'CPD005', 'TGT015', 0.48,   0.65,   'off-target', 7.3  UNION ALL
SELECT 'INT018', 'CPD006', 'TGT005', 0.02,   0.028,  'primary',    9.8  UNION ALL
SELECT 'INT019', 'CPD006', 'TGT003', 0.41,   0.59,   'off-target', 7.4  UNION ALL
SELECT 'INT020', 'CPD007', 'TGT006', 0.019,  0.025,  'primary',    9.8  UNION ALL
SELECT 'INT021', 'CPD007', 'TGT018', 0.55,   0.78,   'off-target', 7.2  UNION ALL
SELECT 'INT022', 'CPD008', 'TGT007', 0.0092, 0.014,  'primary',    10.1 UNION ALL
SELECT 'INT023', 'CPD008', 'TGT019', 0.38,   0.51,   'off-target', 7.4  UNION ALL
SELECT 'INT024', 'CPD009', 'TGT008', 0.011,  0.017,  'primary',    9.9  UNION ALL
SELECT 'INT025', 'CPD009', 'TGT009', 0.015,  0.022,  'primary',    9.8  UNION ALL
SELECT 'INT026', 'CPD010', 'TGT002', 0.041,  0.058,  'primary',    9.4  UNION ALL
SELECT 'INT027', 'CPD010', 'TGT001', 0.38,   0.52,   'off-target', 7.3  UNION ALL
SELECT 'INT028', 'CPD010', 'TGT013', 1.2,    1.8,    'off-target', 7.1  UNION ALL
SELECT 'INT029', 'CPD011', 'TGT006', 0.029,  0.041,  'primary',    9.5  UNION ALL
SELECT 'INT030', 'CPD011', 'TGT010', 0.71,   0.95,   'off-target', 7.0  UNION ALL
SELECT 'INT031', 'CPD012', 'TGT020', 0.39,   0.55,   'primary',    7.3  UNION ALL
SELECT 'INT032', 'CPD013', 'TGT014', 12.0,   18.5,   'primary',    5.7  UNION ALL
SELECT 'INT033', 'CPD014', 'TGT010', 0.0018, 0.0025, 'primary',    11.8 UNION ALL
SELECT 'INT034', 'CPD015', 'TGT004', 0.055,  0.078,  'primary',    9.2  UNION ALL
SELECT 'INT035', 'CPD015', 'TGT003', 0.12,   0.17,   'primary',    8.9  UNION ALL
SELECT 'INT036', 'CPD015', 'TGT016', 0.29,   0.41,   'primary',    8.5  UNION ALL
SELECT 'INT037', 'CPD015', 'TGT013', 0.95,   1.35,   'off-target', 7.2;
4. Create pathways Table
Contains biological pathways, associated disease areas, and cancer relevance.
CREATE OR REPLACE TABLE drug_target_graph.pathways AS
SELECT 'PWY001' AS pathway_id, 'MAPK Signaling'           AS pathway_name, 'hsa04010' AS kegg_id, 'Cell Proliferation'     AS biological_process, 'Oncology'           AS disease_area, 'high'   AS cancer_relevance UNION ALL
SELECT 'PWY002', 'PI3K-AKT Signaling',        'hsa04151', 'Cell Survival',         'Oncology',           'high'   UNION ALL
SELECT 'PWY003', 'VEGF Signaling',             'hsa04370', 'Angiogenesis',          'Oncology',           'high'   UNION ALL
SELECT 'PWY004', 'ErbB Signaling',             'hsa04012', 'Cell Growth',           'Oncology',           'high'   UNION ALL
SELECT 'PWY005', 'mTOR Signaling',             'hsa04150', 'Cell Growth',           'Oncology',           'medium' UNION ALL
SELECT 'PWY006', 'Cell Cycle',                 'hsa04110', 'Cell Division',         'Oncology',           'high'   UNION ALL
SELECT 'PWY007', 'Cardiac Muscle Contraction', 'hsa04260', 'Cardiac Function',      'Cardiovascular',     'low'    UNION ALL
SELECT 'PWY008', 'hERG Cardiac Channel',       'hsa04022', 'Cardiac Repolarisation','Cardiovascular',     'low'    UNION ALL
SELECT 'PWY009', 'AMPK Signaling',             'hsa04152', 'Energy Metabolism',     'Metabolic',          'low'    UNION ALL
SELECT 'PWY010', 'ALK Signaling',              'hsa04915', 'Cell Proliferation',    'Oncology',           'high'   UNION ALL
SELECT 'PWY011', 'RAS Signaling',              'hsa04014', 'Cell Proliferation',    'Oncology',           'high'   UNION ALL
SELECT 'PWY012', 'HIV Replication',            'hsa05170', 'Viral Replication',     'Infectious Disease', 'low';
5. Create target_pathways Table
A junction table linking targets to the biological pathways they participate in.
CREATE OR REPLACE TABLE drug_target_graph.target_pathways AS
SELECT 'TP001' AS tp_id, 'TGT001' AS target_id, 'PWY001' AS pathway_id, 'activator' AS role, 0.95 AS importance_score UNION ALL
SELECT 'TP002', 'TGT001', 'PWY011', 'activator', 0.88 UNION ALL
SELECT 'TP003', 'TGT002', 'PWY004', 'activator', 0.98 UNION ALL
SELECT 'TP004', 'TGT002', 'PWY001', 'activator', 0.82 UNION ALL
SELECT 'TP005', 'TGT002', 'PWY002', 'activator', 0.75 UNION ALL
SELECT 'TP006', 'TGT003', 'PWY003', 'activator', 0.96 UNION ALL
SELECT 'TP007', 'TGT003', 'PWY001', 'activator', 0.71 UNION ALL
SELECT 'TP008', 'TGT004', 'PWY001', 'activator', 0.97 UNION ALL
SELECT 'TP009', 'TGT004', 'PWY011', 'activator', 0.89 UNION ALL
SELECT 'TP010', 'TGT005', 'PWY010', 'activator', 0.99 UNION ALL
SELECT 'TP011', 'TGT005', 'PWY001', 'activator', 0.78 UNION ALL
SELECT 'TP012', 'TGT006', 'PWY002', 'activator', 0.98 UNION ALL
SELECT 'TP013', 'TGT006', 'PWY005', 'activator', 0.85 UNION ALL
SELECT 'TP014', 'TGT007', 'PWY001', 'activator', 0.94 UNION ALL
SELECT 'TP015', 'TGT007', 'PWY011', 'activator', 0.88 UNION ALL
SELECT 'TP016', 'TGT008', 'PWY006', 'activator', 0.95 UNION ALL
SELECT 'TP017', 'TGT009', 'PWY006', 'activator', 0.93 UNION ALL
SELECT 'TP018', 'TGT010', 'PWY005', 'activator', 0.99 UNION ALL
SELECT 'TP019', 'TGT010', 'PWY002', 'activator', 0.91 UNION ALL
SELECT 'TP020', 'TGT011', 'PWY003', 'activator', 0.87 UNION ALL
SELECT 'TP021', 'TGT011', 'PWY001', 'activator', 0.72 UNION ALL
SELECT 'TP022', 'TGT012', 'PWY001', 'activator', 0.83 UNION ALL
SELECT 'TP023', 'TGT012', 'PWY011', 'activator', 0.79 UNION ALL
SELECT 'TP024', 'TGT013', 'PWY008', 'substrate', 0.99 UNION ALL
SELECT 'TP025', 'TGT013', 'PWY007', 'substrate', 0.95 UNION ALL
SELECT 'TP026', 'TGT014', 'PWY009', 'activator', 0.97 UNION ALL
SELECT 'TP027', 'TGT015', 'PWY001', 'activator', 0.91 UNION ALL
SELECT 'TP028', 'TGT015', 'PWY011', 'activator', 0.86 UNION ALL
SELECT 'TP029', 'TGT016', 'PWY001', 'activator', 0.84 UNION ALL
SELECT 'TP030', 'TGT016', 'PWY003', 'activator', 0.77 UNION ALL
SELECT 'TP031', 'TGT017', 'PWY001', 'activator', 0.88 UNION ALL
SELECT 'TP032', 'TGT017', 'PWY011', 'activator', 0.82 UNION ALL
SELECT 'TP033', 'TGT018', 'PWY002', 'activator', 0.96 UNION ALL
SELECT 'TP034', 'TGT018', 'PWY005', 'activator', 0.88 UNION ALL
SELECT 'TP035', 'TGT019', 'PWY001', 'activator', 0.97 UNION ALL
SELECT 'TP036', 'TGT019', 'PWY011', 'activator', 0.91 UNION ALL
SELECT 'TP037', 'TGT020', 'PWY012', 'substrate', 0.99;
4. Create the Property Graph
With the tables successfully created, you can now construct the property graph. This links nodes (Compounds, Targets, Pathways) using edge tables (Interactions and Target Pathways).
Run the following statement in the BigQuery Studio SQL Editor:
CREATE OR REPLACE PROPERTY GRAPH drug_target_graph.drug_target_interaction_graph
NODE TABLES (
  drug_target_graph.compounds
    AS compound_node
    KEY (compound_id)
    LABEL Compound
    PROPERTIES (compound_id, compound_name, mechanism_of_action, dev_stage, therapeutic_area, molecular_weight),

  drug_target_graph.targets
    AS target_node
    KEY (target_id)
    LABEL Target
    PROPERTIES (target_id, target_name, gene_name, uniprot_id, target_class, is_oncogene),

  drug_target_graph.pathways
    AS pathway_node
    KEY (pathway_id)
    LABEL Pathway
    PROPERTIES (pathway_id, pathway_name, kegg_id, biological_process, disease_area, cancer_relevance)
)
EDGE TABLES (
  drug_target_graph.interactions
    AS binds_to_edge
    KEY (interaction_id)
    SOURCE KEY (compound_id) REFERENCES compound_node (compound_id)
    DESTINATION KEY (target_id) REFERENCES target_node (target_id)
    LABEL BINDS_TO
    PROPERTIES (interaction_id, affinity_nm, ic50_nm, interaction_type, pchembl_value),

  drug_target_graph.target_pathways
    AS participates_in_edge
    KEY (tp_id)
    SOURCE KEY (target_id) REFERENCES target_node (target_id)
    DESTINATION KEY (pathway_id) REFERENCES pathway_node (pathway_id)
    LABEL PARTICIPATES_IN
    PROPERTIES (tp_id, role, importance_score)
);
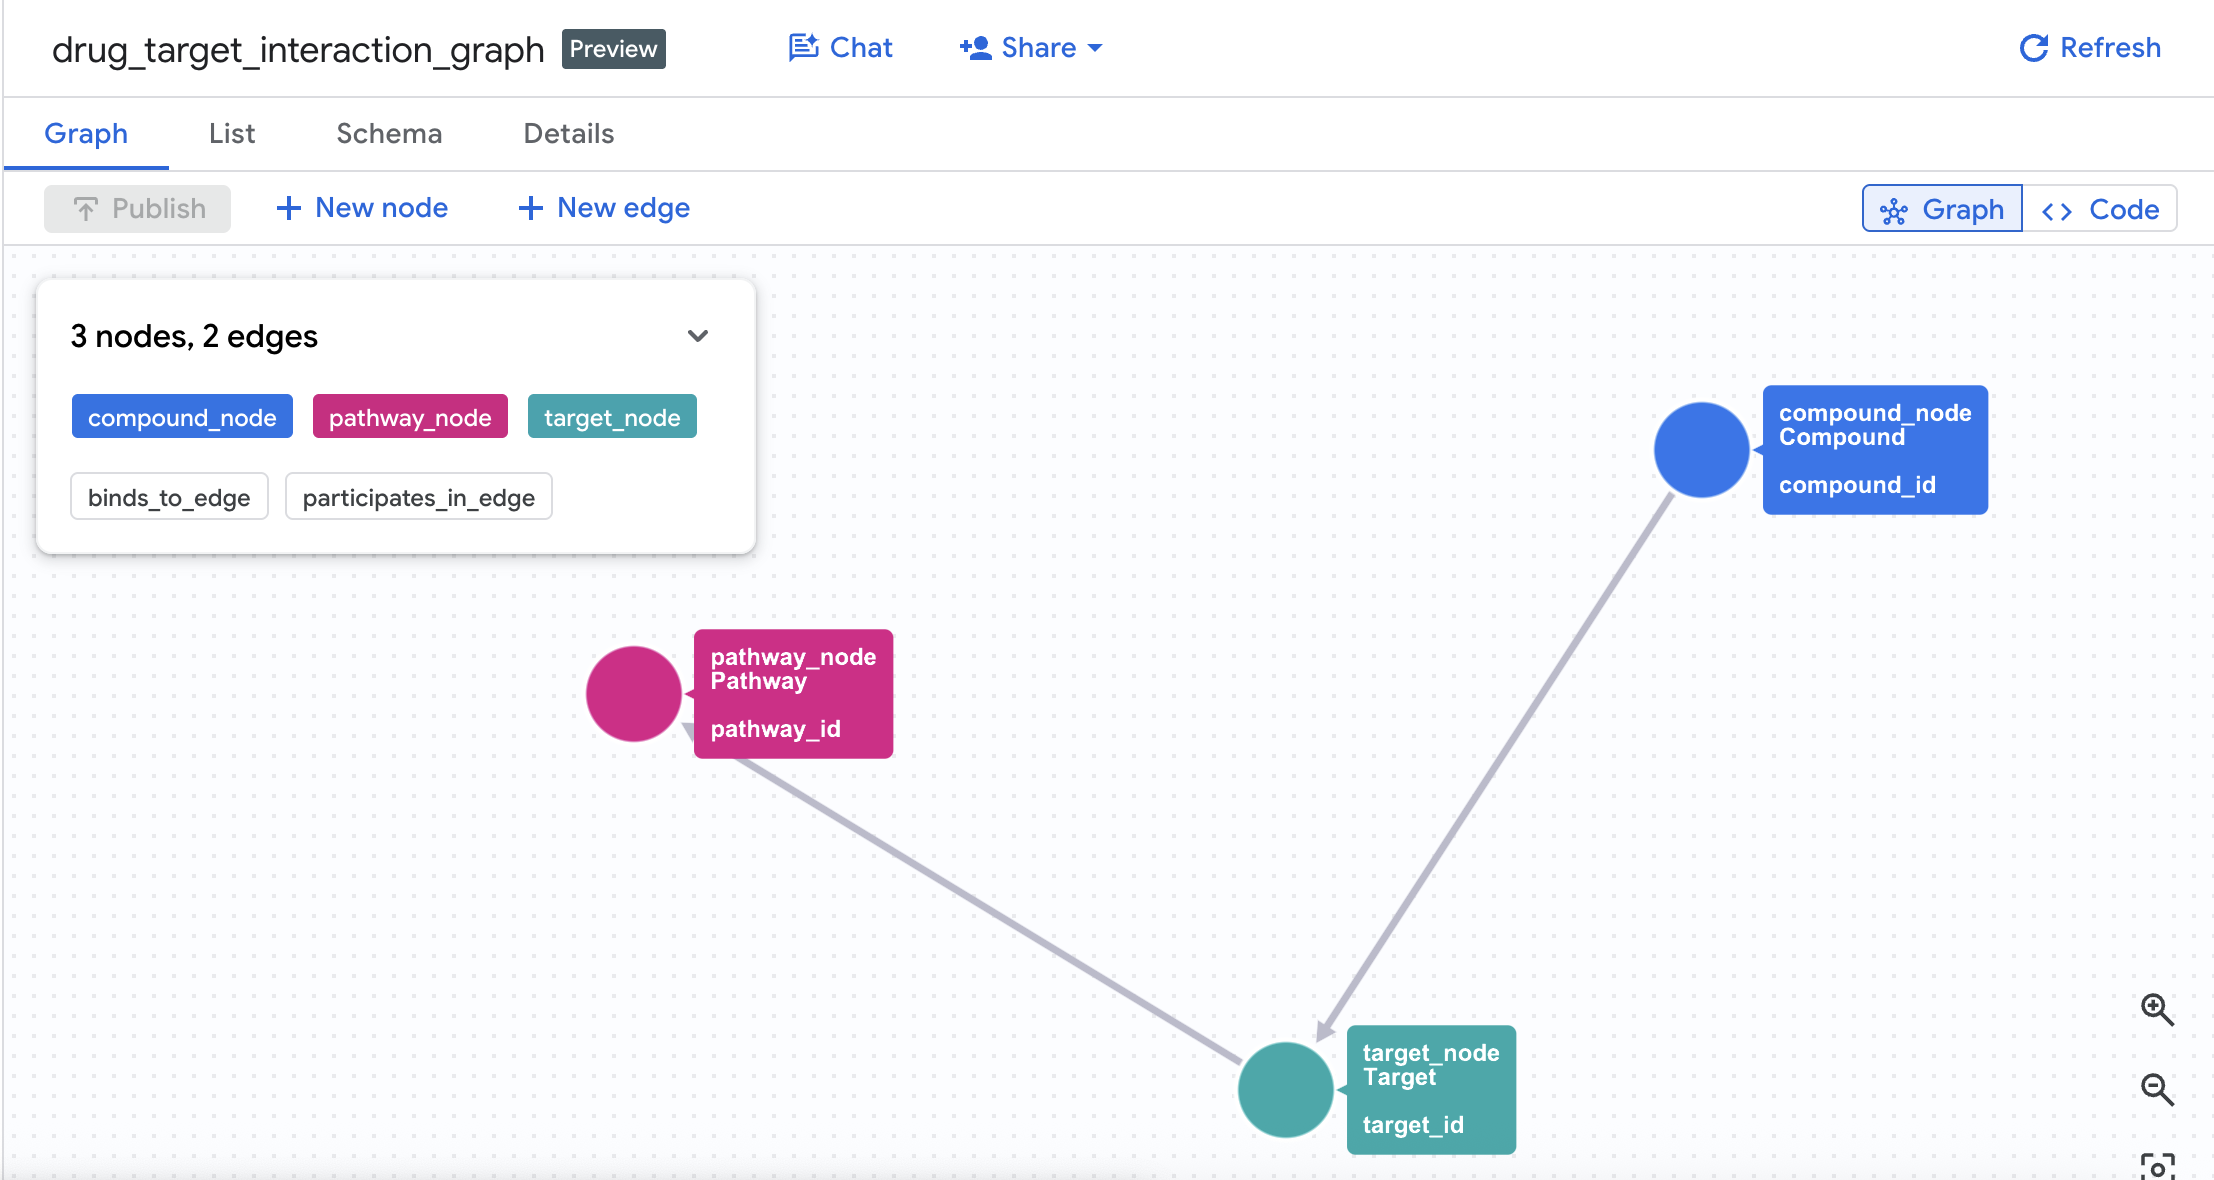
This creates a graph called drug_target_interaction_graph in your dataset.
5. Query 1: Full Target Binding Profile per Compound
Let's run our first graph query. This is a 1-hop traversal that answers: Which compounds bind to which targets, and what is their affinity?
GQL Query
Run the following query in the SQL Editor:
SELECT
  compound_name,
  dev_stage,
  target_name,
  gene_name,
  target_class,
  interaction_type,
  ROUND(affinity_nm, 3) AS affinity_nm,
  ROUND(ic50_nm, 3)     AS ic50_nm,
  pchembl_value
FROM GRAPH_TABLE(
  drug_target_graph.drug_target_interaction_graph
  MATCH (c:Compound)-[b:BINDS_TO]->(t:Target)
  COLUMNS (
    c.compound_name    AS compound_name,
    c.dev_stage        AS dev_stage,
    t.target_name      AS target_name,
    t.gene_name        AS gene_name,
    t.target_class     AS target_class,
    b.interaction_type AS interaction_type,
    b.affinity_nm      AS affinity_nm,
    b.ic50_nm          AS ic50_nm,
    b.pchembl_value    AS pchembl_value
  )
)
ORDER BY compound_name, interaction_type, affinity_nm;
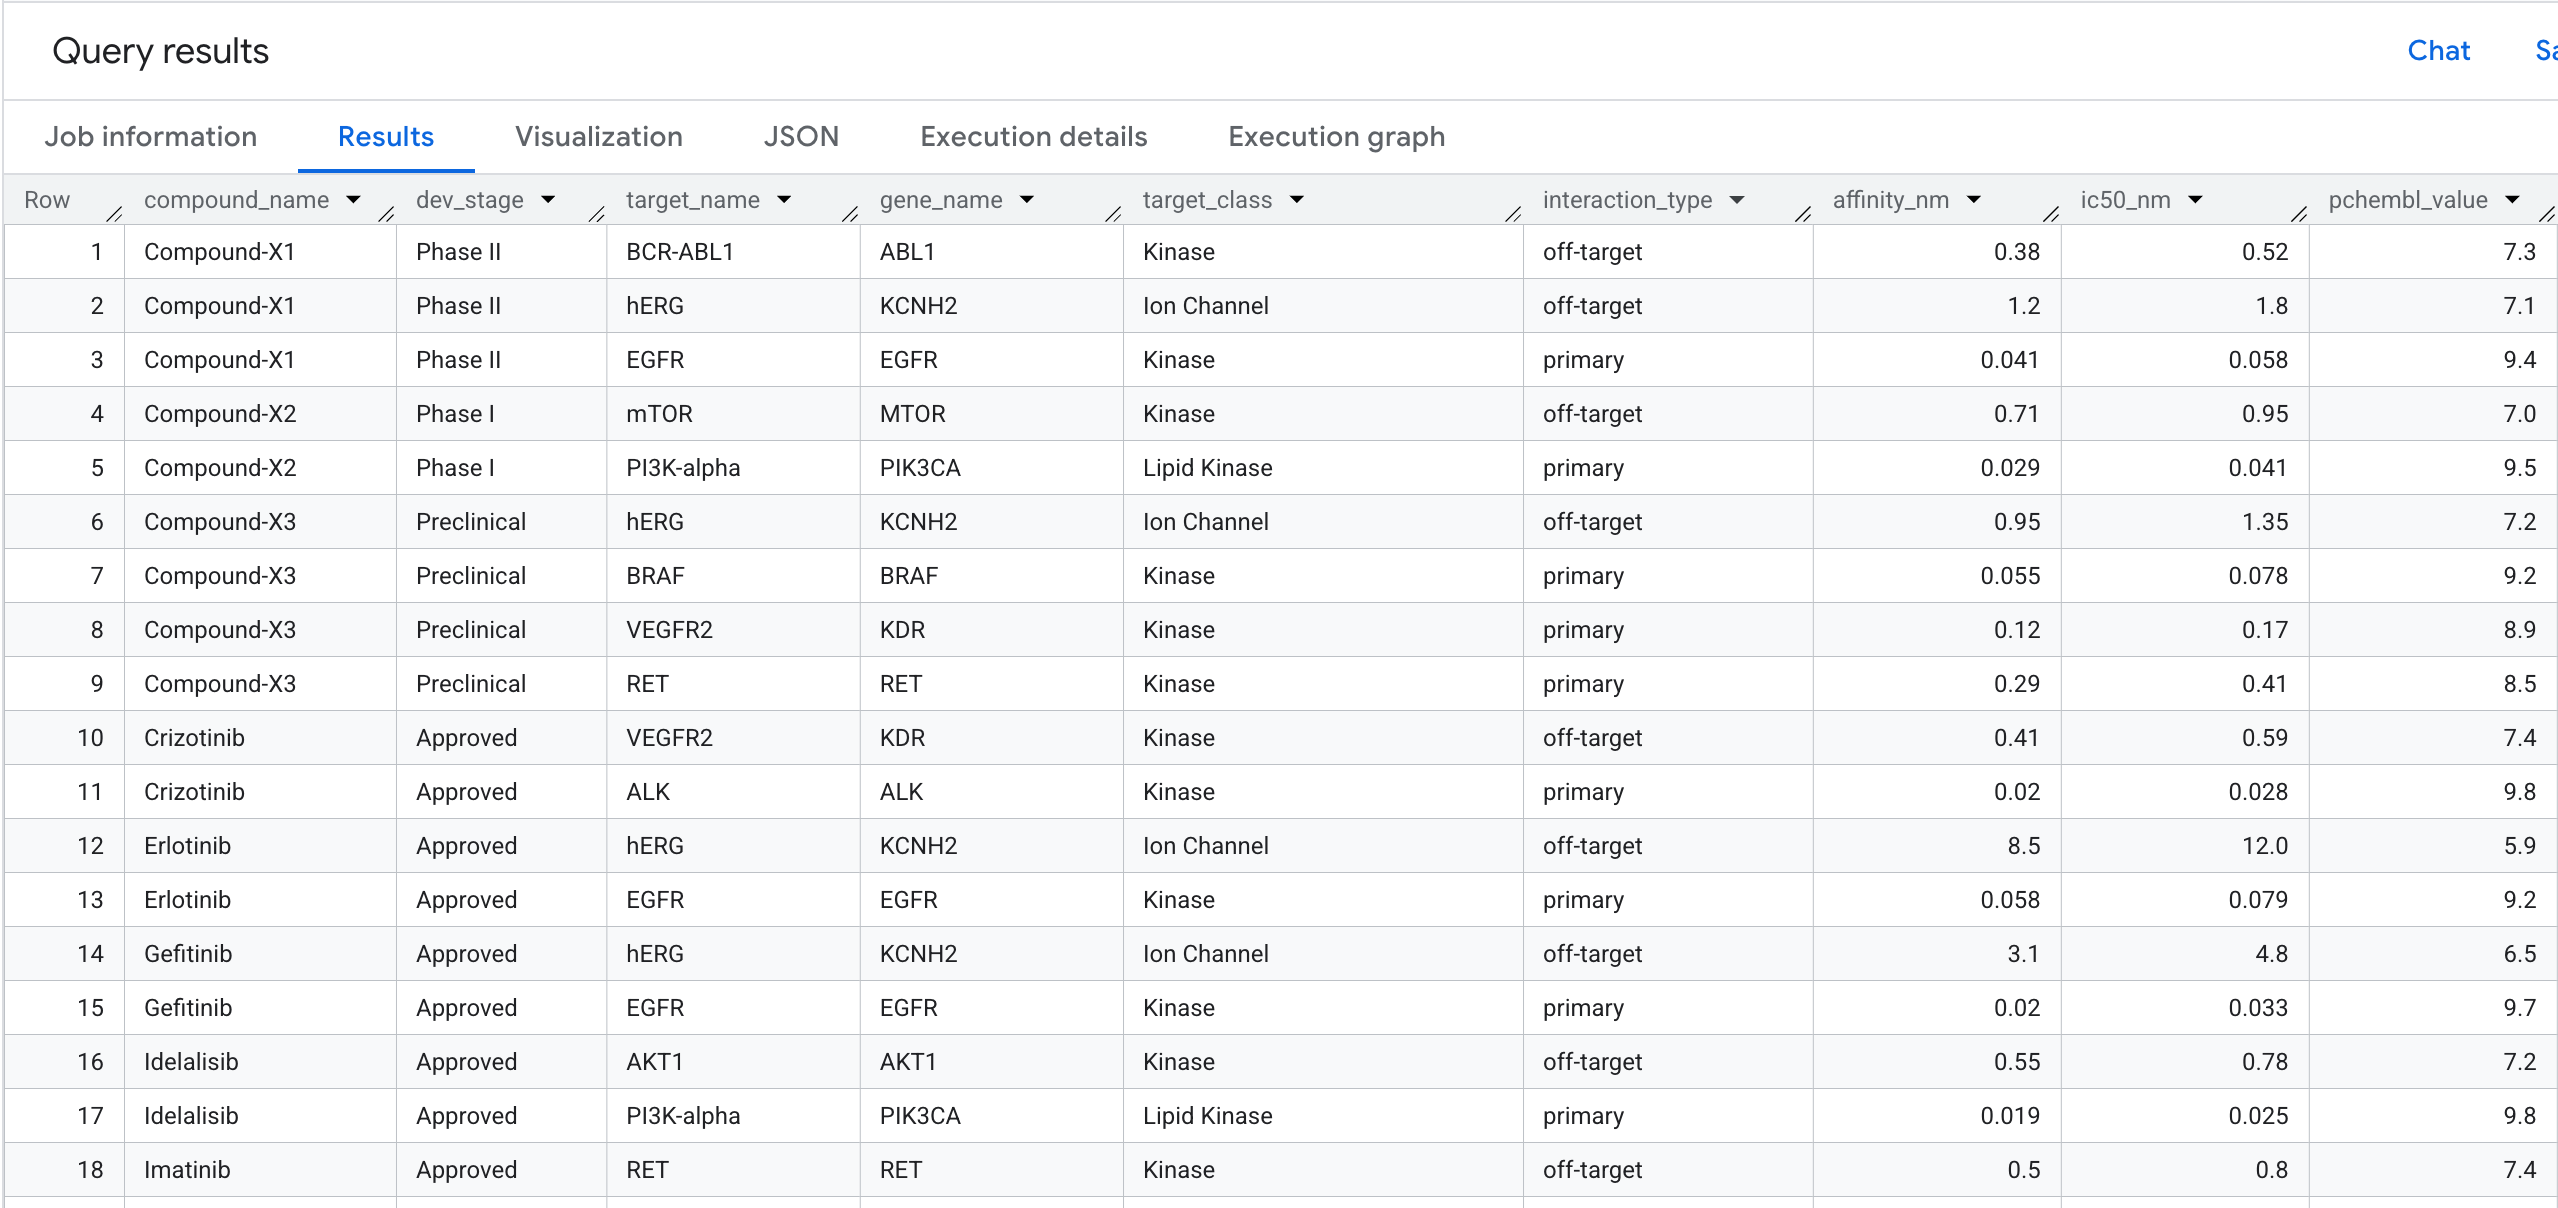
Here is what you will see in the results:
6. Query 2: Cardiac Risk Detection
The Business Question
In drug discovery, one of the most common reasons a promising compound fails in clinical trials is cardiotoxicity — specifically, unintended binding to the hERG protein (gene: KCNH2), a potassium ion channel that regulates heart rhythm. An off-target hit on hERG can cause fatal arrhythmias, and has been responsible for several high-profile drug withdrawals.
The question we want to answer is:
"Which compounds in our pipeline have an off-target binding event on the hERG protein — and which cardiac pathways does that put at risk?"
This is a 2-hop question: we need to traverse from a Compound, through a Target (hERG), to a Pathway — connecting three entity types across two relationships in a single query.
Write the GQL Query
Run the following query in the BQ SQL Editor:
SELECT
  compound_name,
  dev_stage,
  therapeutic_area,
  target_name,
  ROUND(affinity_nm, 3) AS herg_affinity_nm,
  pathway_name,
  disease_area          AS pathway_disease_area
FROM GRAPH_TABLE(
  drug_target_graph.drug_target_interaction_graph
  MATCH (c:Compound)-[b:BINDS_TO]->(t:Target)-[p:PARTICIPATES_IN]->(pw:Pathway)
  WHERE t.gene_name        = 'KCNH2'
    AND b.interaction_type = 'off-target'
    AND pw.disease_area    = 'Cardiovascular'
  COLUMNS (
    c.compound_name    AS compound_name,
    c.dev_stage        AS dev_stage,
    c.therapeutic_area AS therapeutic_area,
    t.target_name      AS target_name,
    b.affinity_nm      AS affinity_nm,
    pw.pathway_name    AS pathway_name,
    pw.disease_area    AS disease_area
  )
)
ORDER BY herg_affinity_nm;
Notice how the MATCH clause reads almost like a sentence: "Find a Compound that binds to a Target that participates in a Pathway" — with the filters applied at each node and edge along the path.
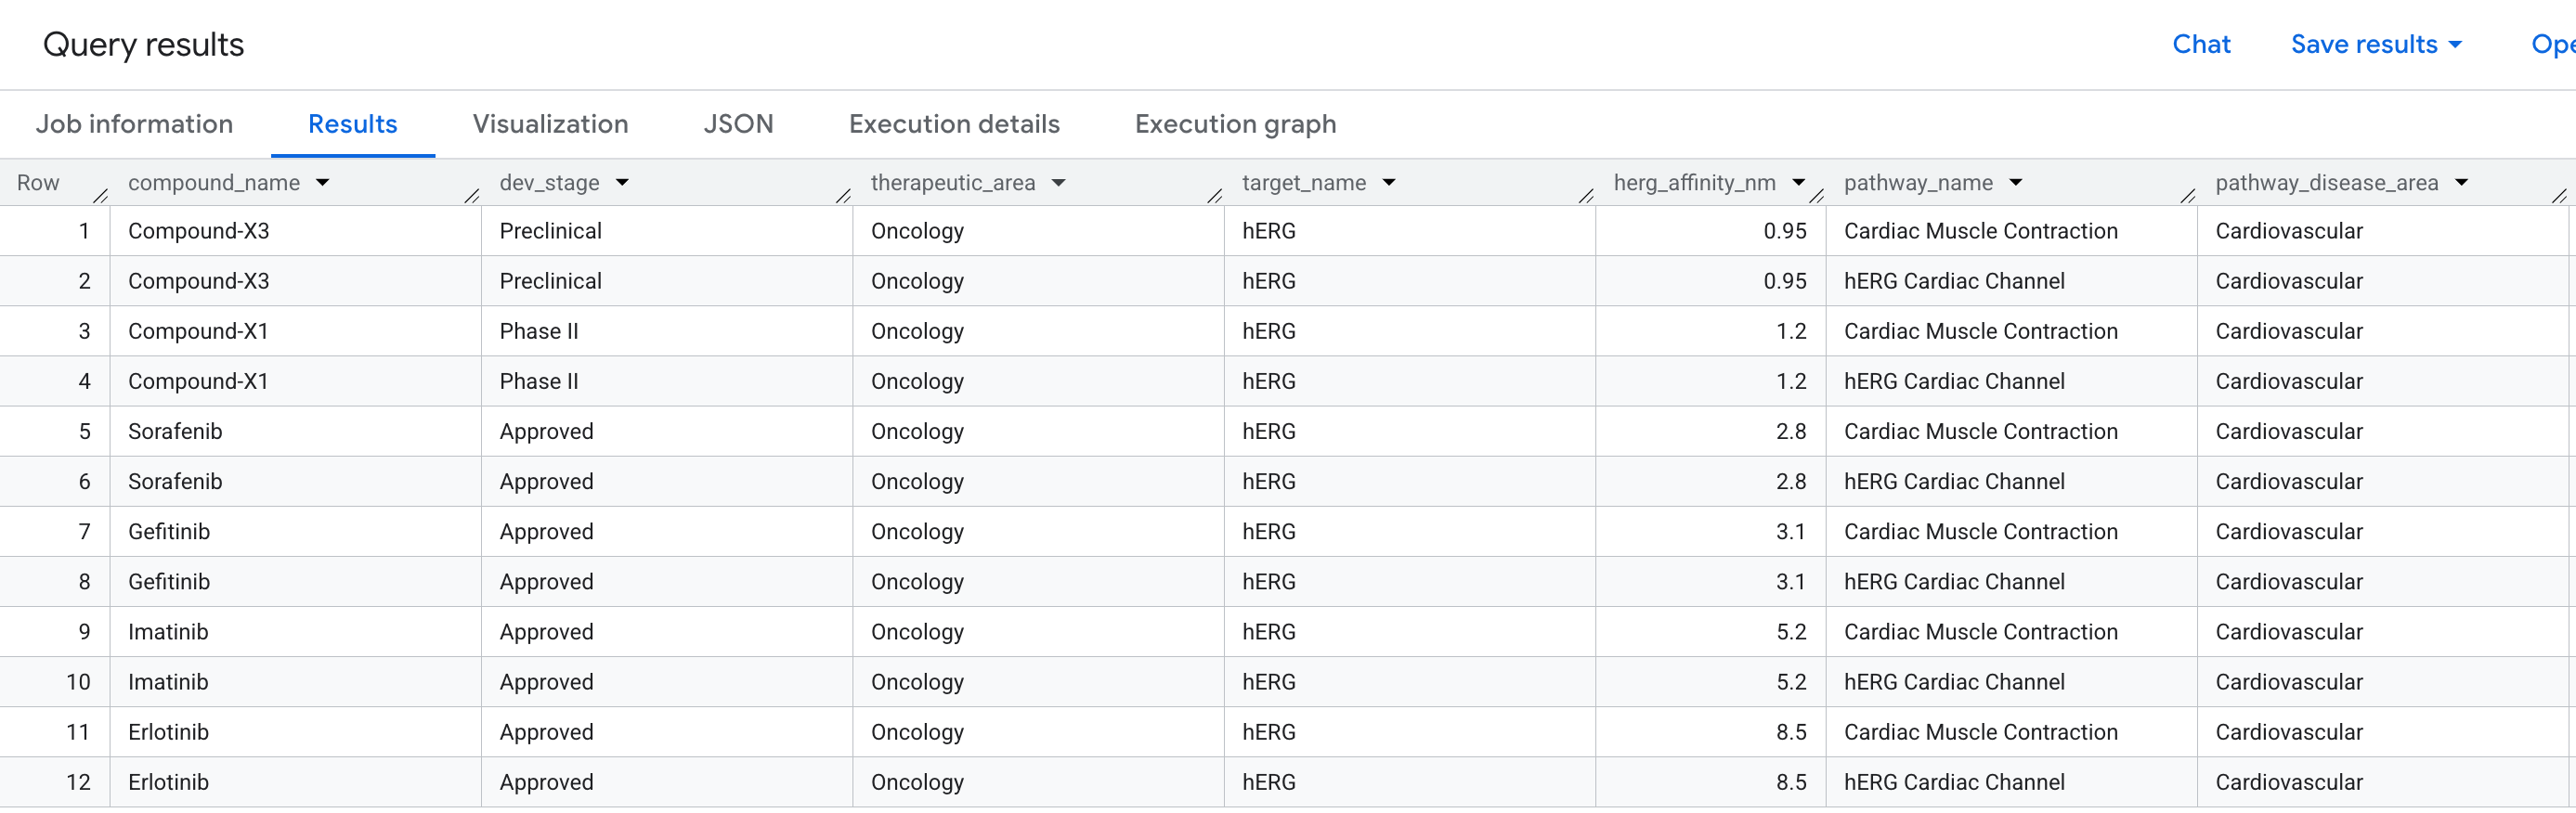
Here is the data you will see in the results:
Visualise the Risk Network as a Graph
A table shows us the data — but it doesn't show us the structure of the risk. Are multiple compounds converging on the same pathway? Is there one high-risk compound or several?
A graph visualisation makes this immediately visible. Run the cell below to render the same 2-hop traversal as an interactive network:
GRAPH `drug_target_graph.drug_target_interaction_graph`
MATCH pt = (c:Compound)-[b:BINDS_TO]->(t:Target)-[p:PARTICIPATES_IN]->(pw:Pathway)
WHERE t.gene_name     = 'KCNH2'
  AND pw.disease_area = 'Cardiovascular'
RETURN
  TO_JSON(pt) AS path
You should see a graph like this:
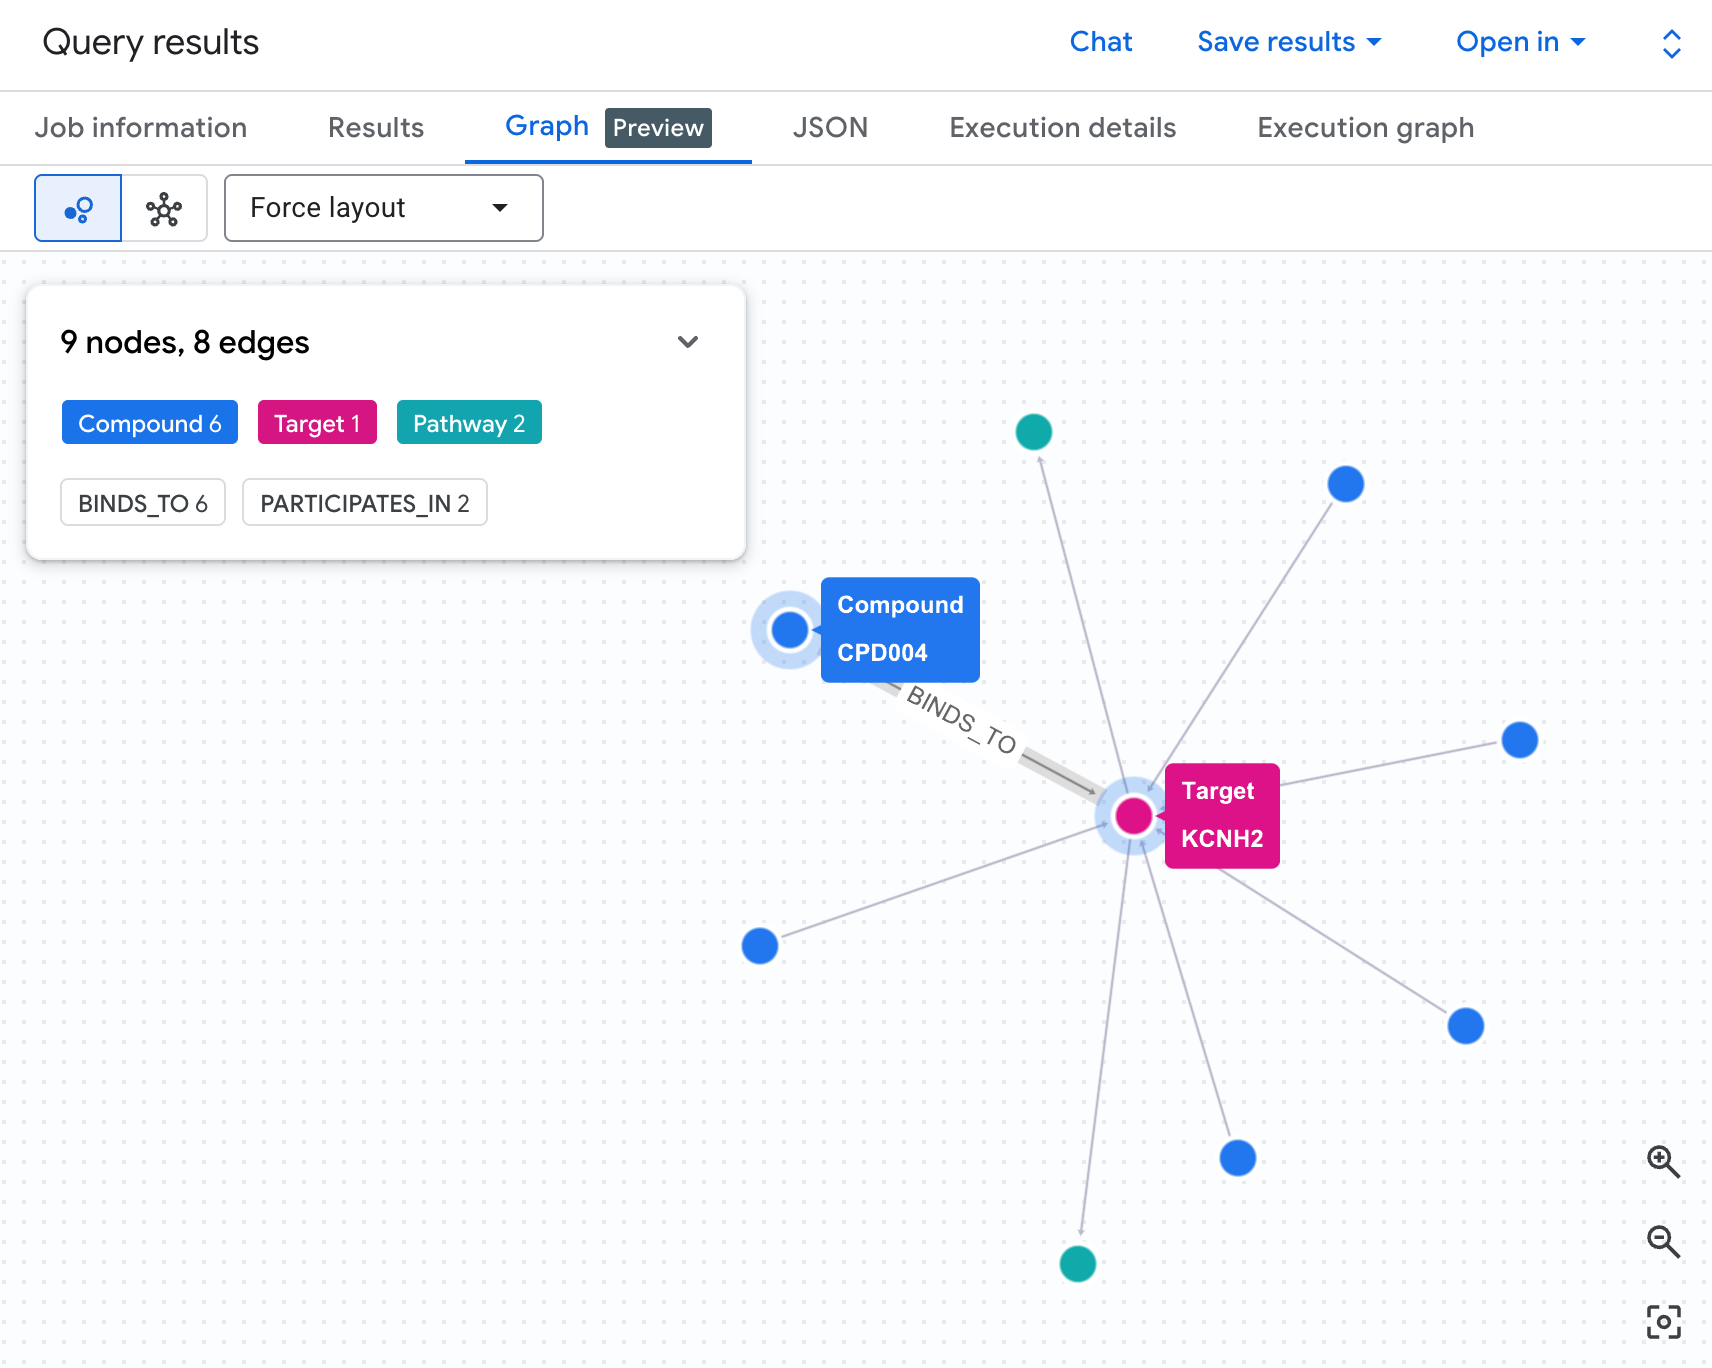
Each path in the graph traces a complete liability chain: a compound (blue nodes) binds to the hERG protein in the centre, which connects to one or more cardiac pathways (green nodes). What was a flat list of rows in the table is now a visible risk network — compounds with multiple pathway exposures immediately stand out as higher priority for safety review.
See Why GQL Is More Elegant Than SQL
To execute the same 2-hop query in standard SQL, you need 4 explicit joins. You are spending cognitive effort describing how to join tables rather than what relationship you are looking for. GQL lets you stay focused on the question.
SELECT
  c.compound_name,
  c.dev_stage,
  c.therapeutic_area,
  t.target_name,
  ROUND(i.affinity_nm, 3) AS herg_affinity_nm,
  pw.pathway_name,
  pw.disease_area         AS pathway_disease_area
FROM drug_target_graph.compounds c
JOIN drug_target_graph.interactions i ON c.compound_id = i.compound_id
JOIN drug_target_graph.targets t ON i.target_id = t.target_id
JOIN drug_target_graph.target_pathways tp ON t.target_id = tp.target_id
JOIN drug_target_graph.pathways pw ON tp.pathway_id = pw.pathway_id
WHERE t.gene_name = 'KCNH2'
  AND i.interaction_type = 'off-target'
  AND pw.disease_area = 'Cardiovascular'
ORDER BY herg_affinity_nm;
Going deeper — multi-hop metabolite risk detection
The query above identifies compounds that directly bind the hERG protein. But in real drug safety workflows, the risk is sometimes one step removed: a compound may be metabolically converted in the body into a secondary molecule (a metabolite) that then binds hERG — a liability that direct binding assays can miss entirely.
If your property graph included a Metabolite node table and a METABOLISES_INTO edge, you could extend the same MATCH pattern to a 3-hop traversal:
(Compound)-[METABOLISES_INTO]->(Metabolite)-[BINDS_TO]->
(Target)-[PARTICIPATES_IN]->(Pathway)
The GQL query structure would change by exactly one node and one edge. The equivalent SQL would require two additional JOINs. This is the pattern that makes graph traversal particularly powerful for safety cascade analysis — the query complexity grows linearly while the biological insight grows exponentially.
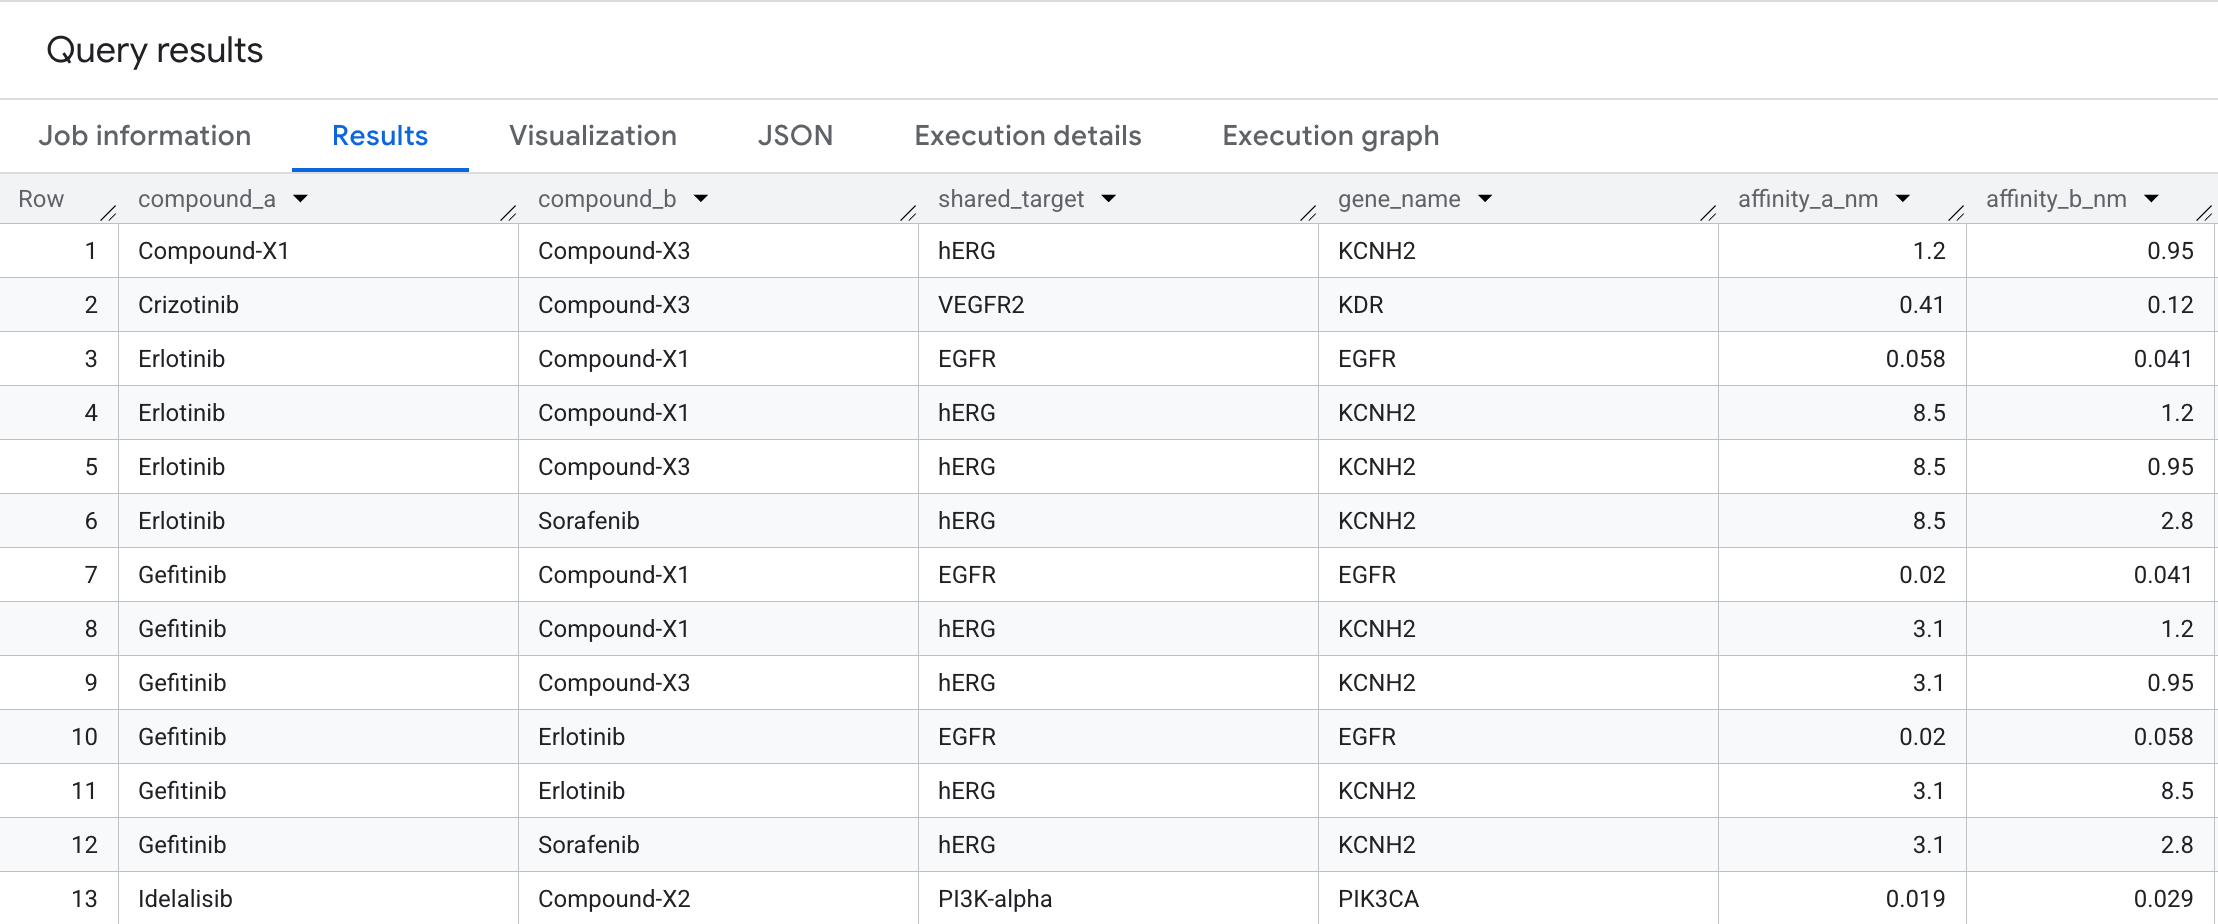
7. Query 3: Shared-Target Compound Pairs
To find candidates for combination therapy, we can identify when two different compounds bind to the same target node. We use a bidirectional match to answer: Which oncology compounds converge on the exact same target?
Run the following query in the SQL Editor:
SELECT
  compound_a,
  compound_b,
  shared_target,
  gene_name,
  ROUND(affinity_a_nm, 3) AS affinity_a_nm,
  ROUND(affinity_b_nm, 3) AS affinity_b_nm
FROM GRAPH_TABLE(
  drug_target_graph.drug_target_interaction_graph
  MATCH (c1:Compound)-[b1:BINDS_TO]->(t:Target)<-[b2:BINDS_TO]-(c2:Compound)
  WHERE c1.compound_id < c2.compound_id
    AND c1.therapeutic_area = 'Oncology'
    AND c2.therapeutic_area = 'Oncology'
  COLUMNS (
    c1.compound_name AS compound_a,
    c2.compound_name AS compound_b,
    t.target_name    AS shared_target,
    t.gene_name      AS gene_name,
    b1.affinity_nm   AS affinity_a_nm,
    b2.affinity_nm   AS affinity_b_nm
  )
)
ORDER BY compound_a, compound_b, affinity_a_nm;
Here is the data you will see in the results:
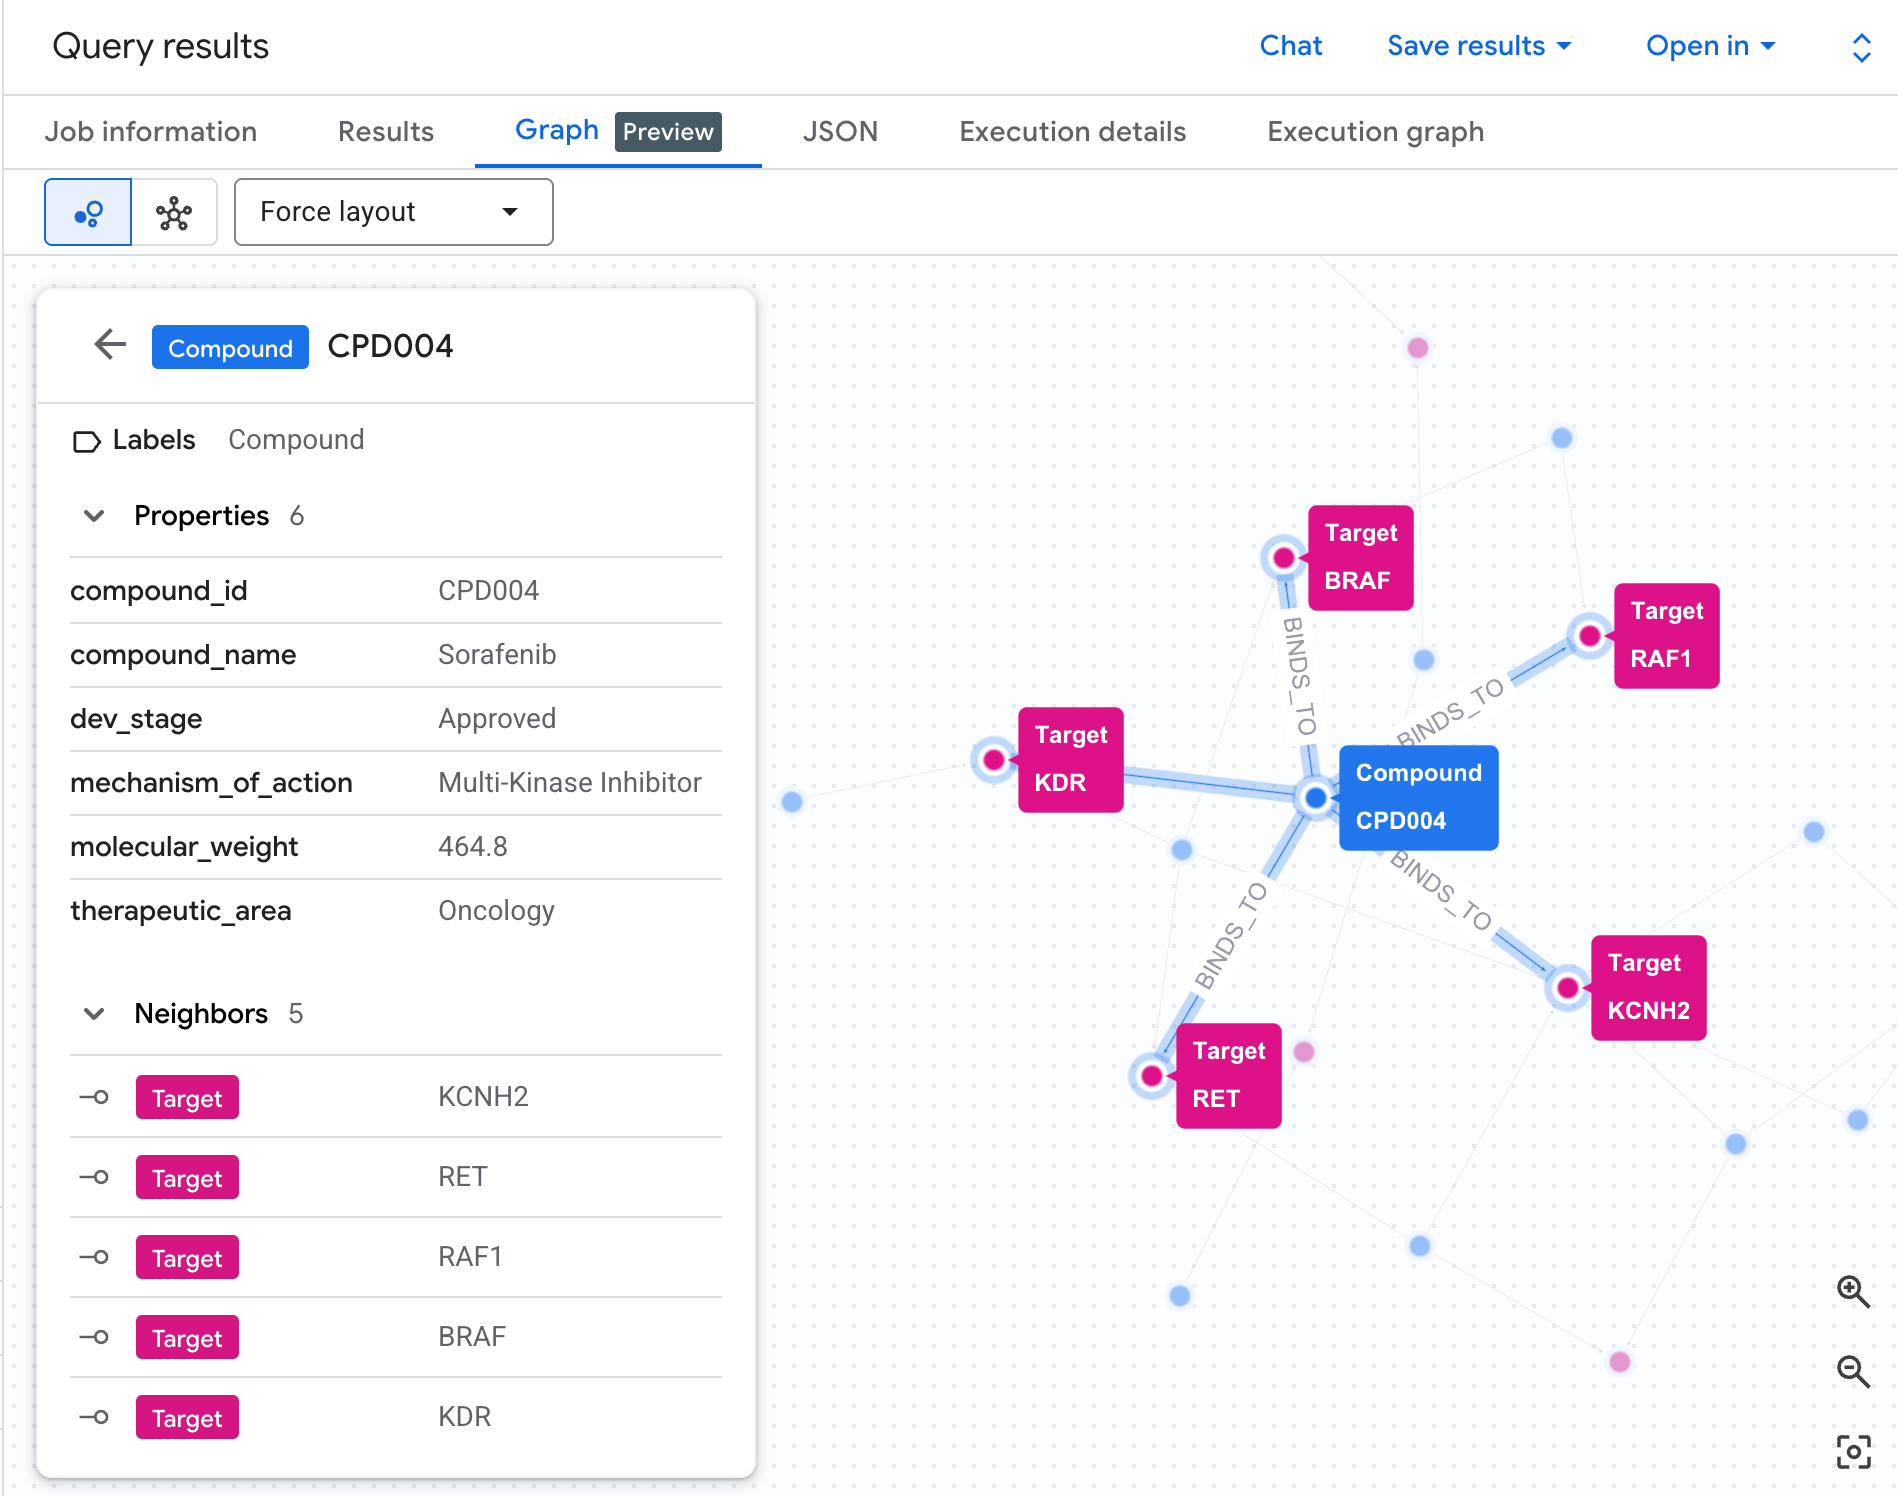
Graph Visualization
You can visualize the Graph directly in BigQuery by running the following code in the SQL editor.
GRAPH `drug_target_graph.drug_target_interaction_graph`
MATCH p = (c1:Compound)-[b1:BINDS_TO]->(t:Target)<-[b2:BINDS_TO]-(c2:Compound)
WHERE c1.compound_id < c2.compound_id
  AND c1.therapeutic_area = 'Oncology'
RETURN
  TO_JSON(p) AS path
This bidirectional traversal surfaces compound pairs that converge on the same protein target — a pattern that is difficult to spot in a flat interactions table but immediately visible as a graph. In drug discovery, shared-target pairs are the starting point for combination therapy design: two compounds hitting the same node in a cancer pathway may produce a synergistic effect, or alternatively signal an unintended redundancy in the pipeline
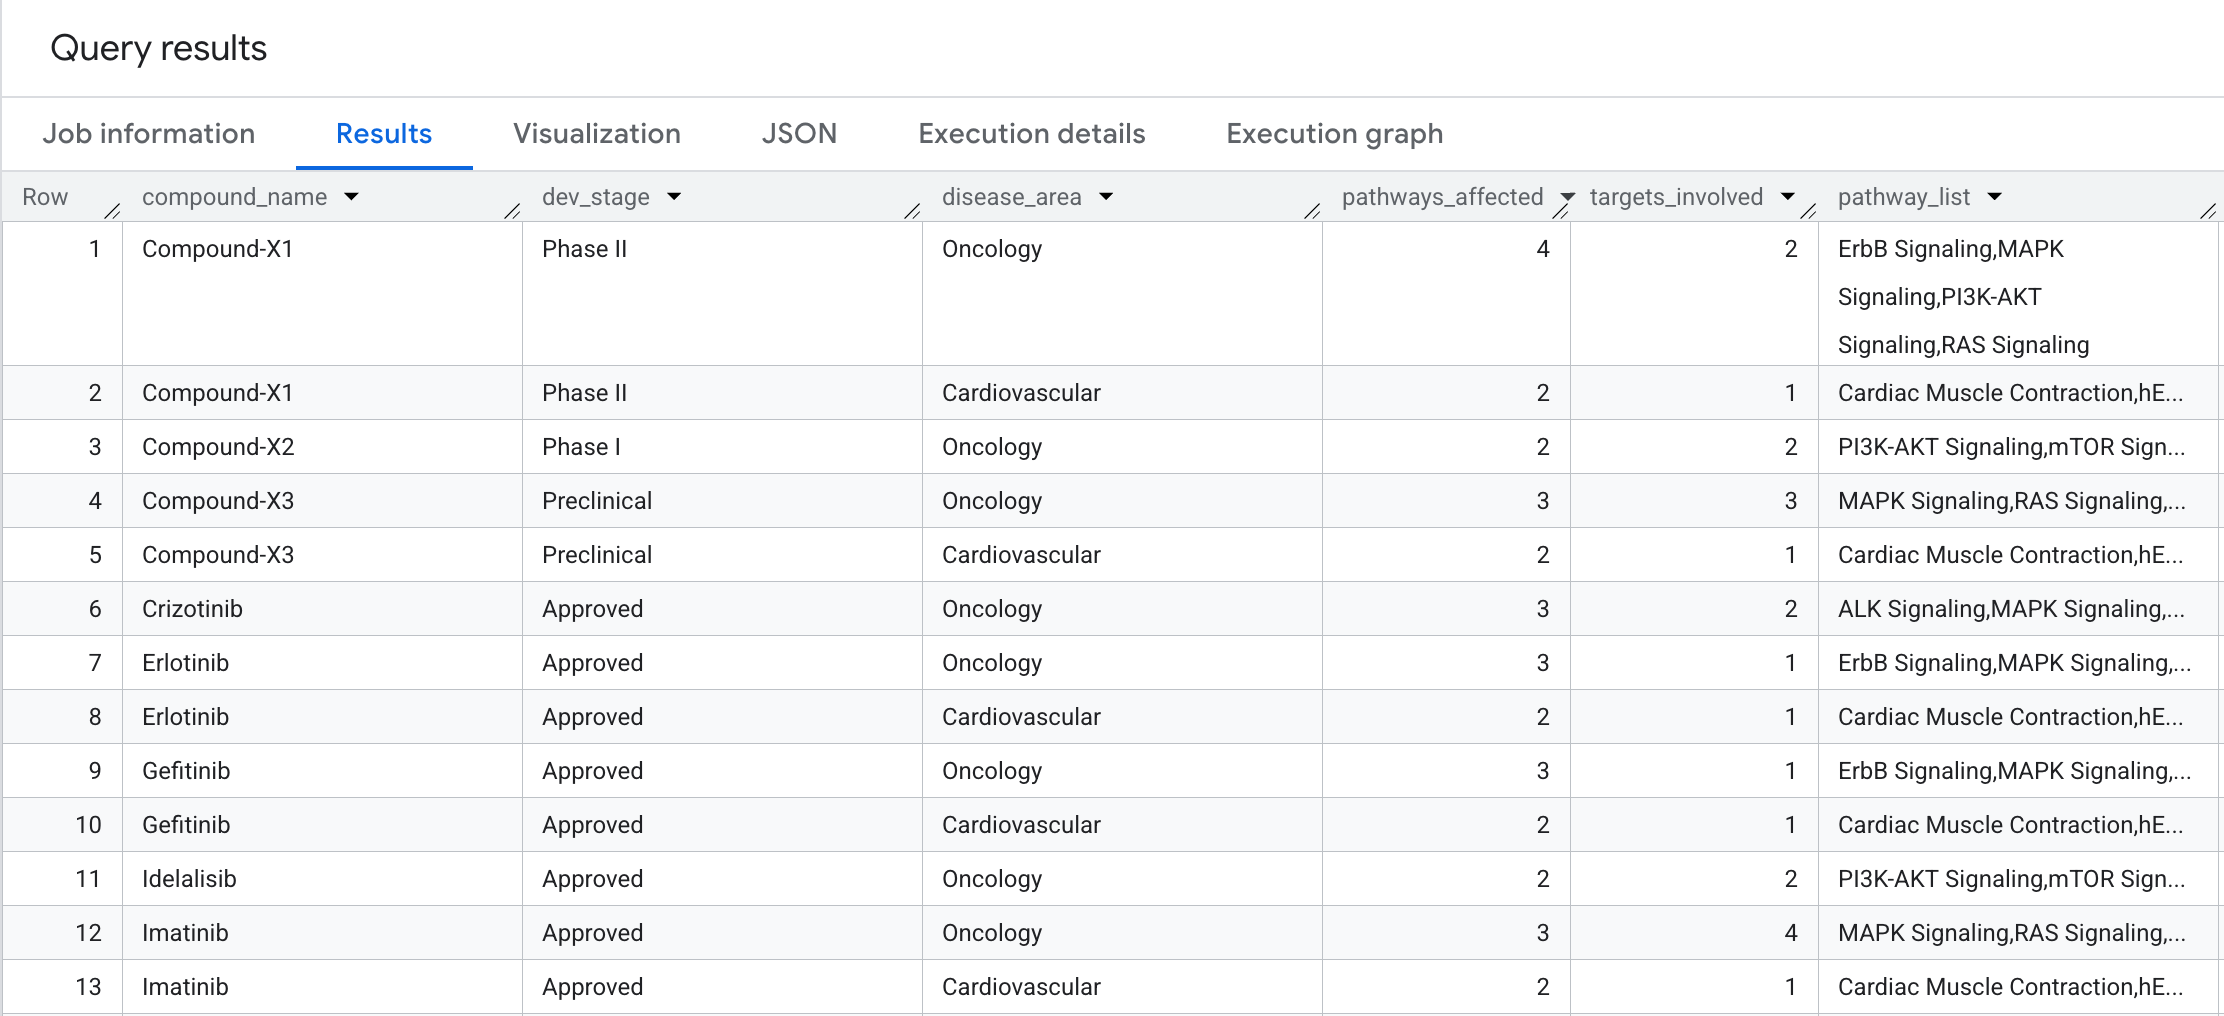
8. Query 4: Disease Pathway Blast Radius
How broad is the biological impact of each compound? Let's perform a 2-hop traversal with aggregation to answer: How many biological pathways and distinct targets does each compound affect, grouped by disease area?
Run the following query in the SQL Editor:
SELECT
  compound_name,
  dev_stage,
  disease_area,
  COUNT(DISTINCT pathway_id) AS pathways_affected,
  COUNT(DISTINCT target_id)  AS targets_involved,
  STRING_AGG(DISTINCT pathway_name ORDER BY pathway_name) AS pathway_list
FROM GRAPH_TABLE(
  drug_target_graph.drug_target_interaction_graph
  MATCH (c:Compound)-[b:BINDS_TO]->(t:Target)-[p:PARTICIPATES_IN]->(pw:Pathway)
  COLUMNS (
    c.compound_name AS compound_name,
    c.dev_stage     AS dev_stage,
    t.target_id     AS target_id,
    pw.pathway_id   AS pathway_id,
    pw.pathway_name AS pathway_name,
    pw.disease_area AS disease_area
  )
)
GROUP BY compound_name, dev_stage, disease_area
ORDER BY compound_name, pathways_affected DESC;
Here is what you will see in the results:
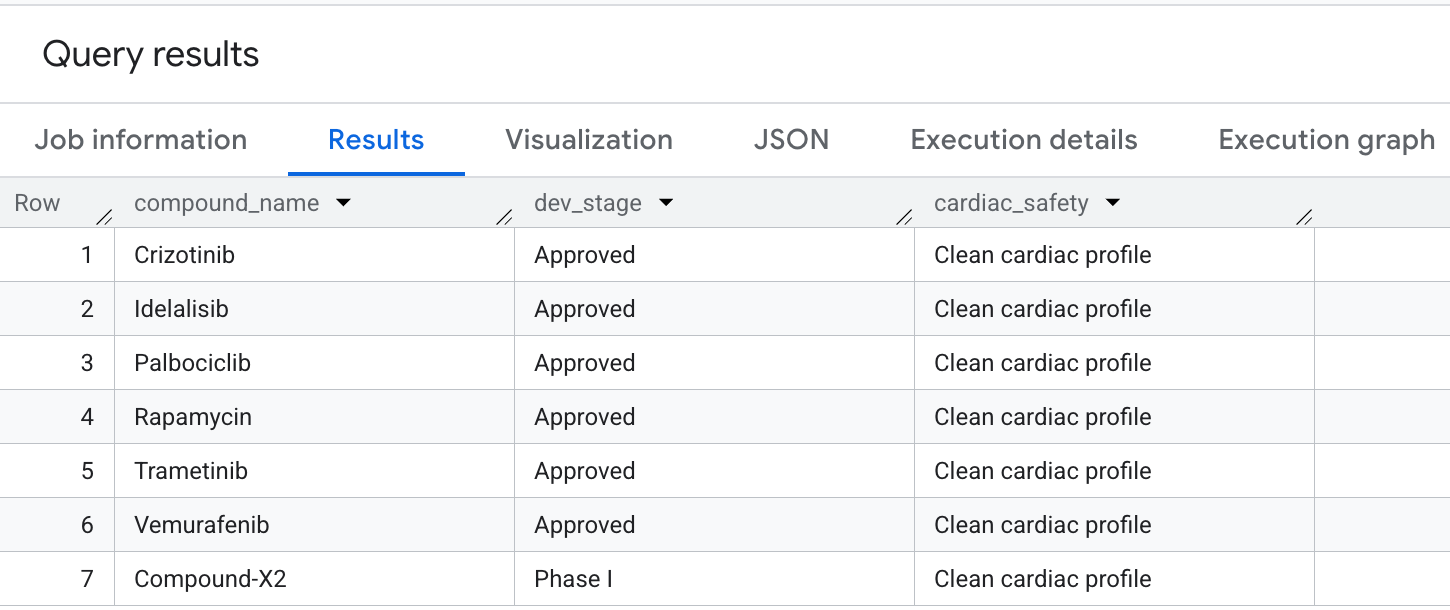
9. Query 5: Safe Compound Selection
Finally, let's query for compounds that have high oncology coverage but explicitly avoid hERG (cardiac) off-target liabilities. This matches common safety-first selection patterns in drug discovery pipelines.
Run the following query in the SQL Editor:
WITH oncology_compounds AS (
  SELECT DISTINCT compound_id, compound_name, dev_stage
  FROM GRAPH_TABLE(
    drug_target_graph.drug_target_interaction_graph
    MATCH (c:Compound)-[b:BINDS_TO]->(t:Target)-[p:PARTICIPATES_IN]->(pw:Pathway)
    WHERE pw.disease_area     = 'Oncology'
      AND pw.cancer_relevance = 'high'
    COLUMNS (
      c.compound_id   AS compound_id,
      c.compound_name AS compound_name,
      c.dev_stage     AS dev_stage
    )
  )
),
herg_risk_compounds AS (
  SELECT DISTINCT compound_id
  FROM GRAPH_TABLE(
    drug_target_graph.drug_target_interaction_graph
    MATCH (c:Compound)-[b:BINDS_TO]->(t:Target)
    WHERE t.gene_name = 'KCNH2'
    COLUMNS (c.compound_id AS compound_id)
  )
)
SELECT
  o.compound_name,
  o.dev_stage,
  'Clean cardiac profile' AS cardiac_safety
FROM oncology_compounds o
LEFT JOIN herg_risk_compounds h ON o.compound_id = h.compound_id
WHERE h.compound_id IS NULL
ORDER BY o.dev_stage, o.compound_name;
Here is the output you will see in the results:
You have successfully executed advanced graph traversals in BigQuery to extract key safety and efficacy profiles!
10. Bonus Section: Chat with your graph
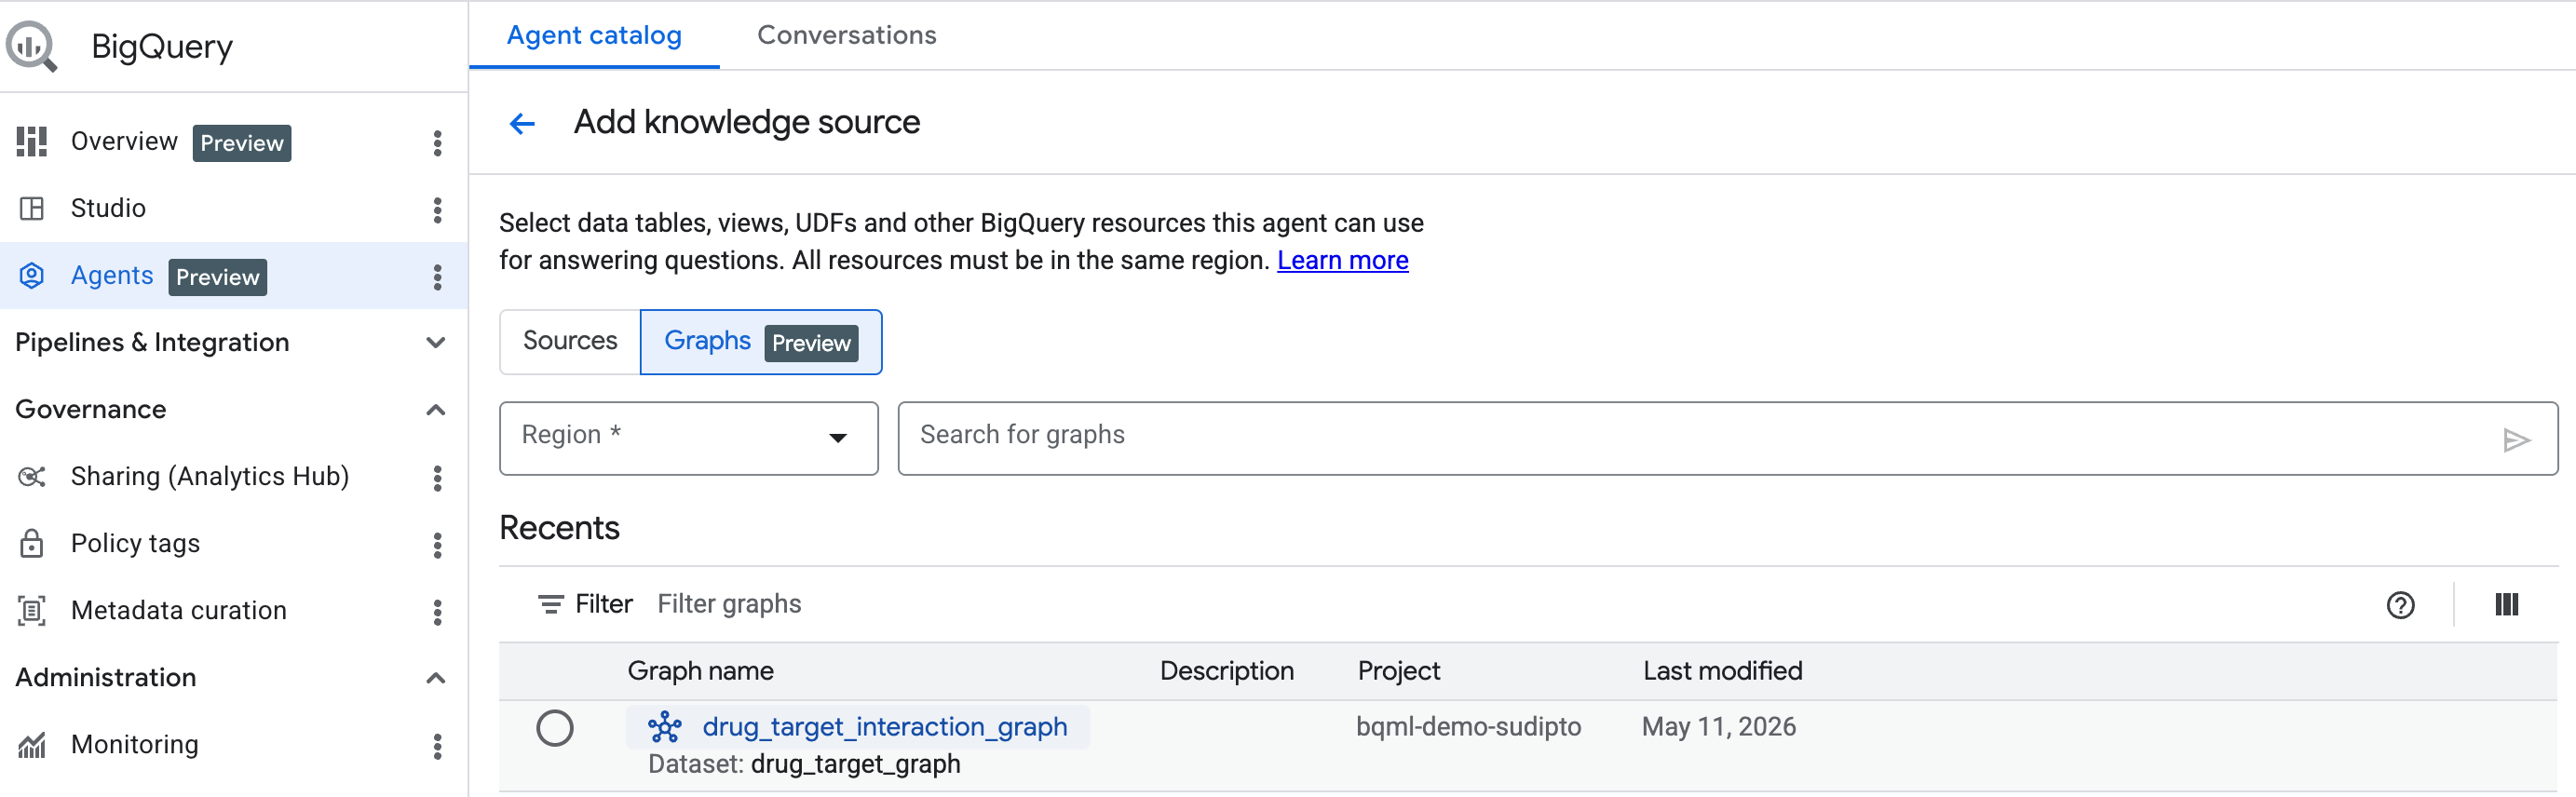
BigQuery Conversational Analytics now supports graph as a knowledge source. This lets you chat with the graph you just created in natural language.
Getting Started: Add a graph as knowledge source
To get started create a conversational agent following the steps here. Select the graph you created from the search bar.
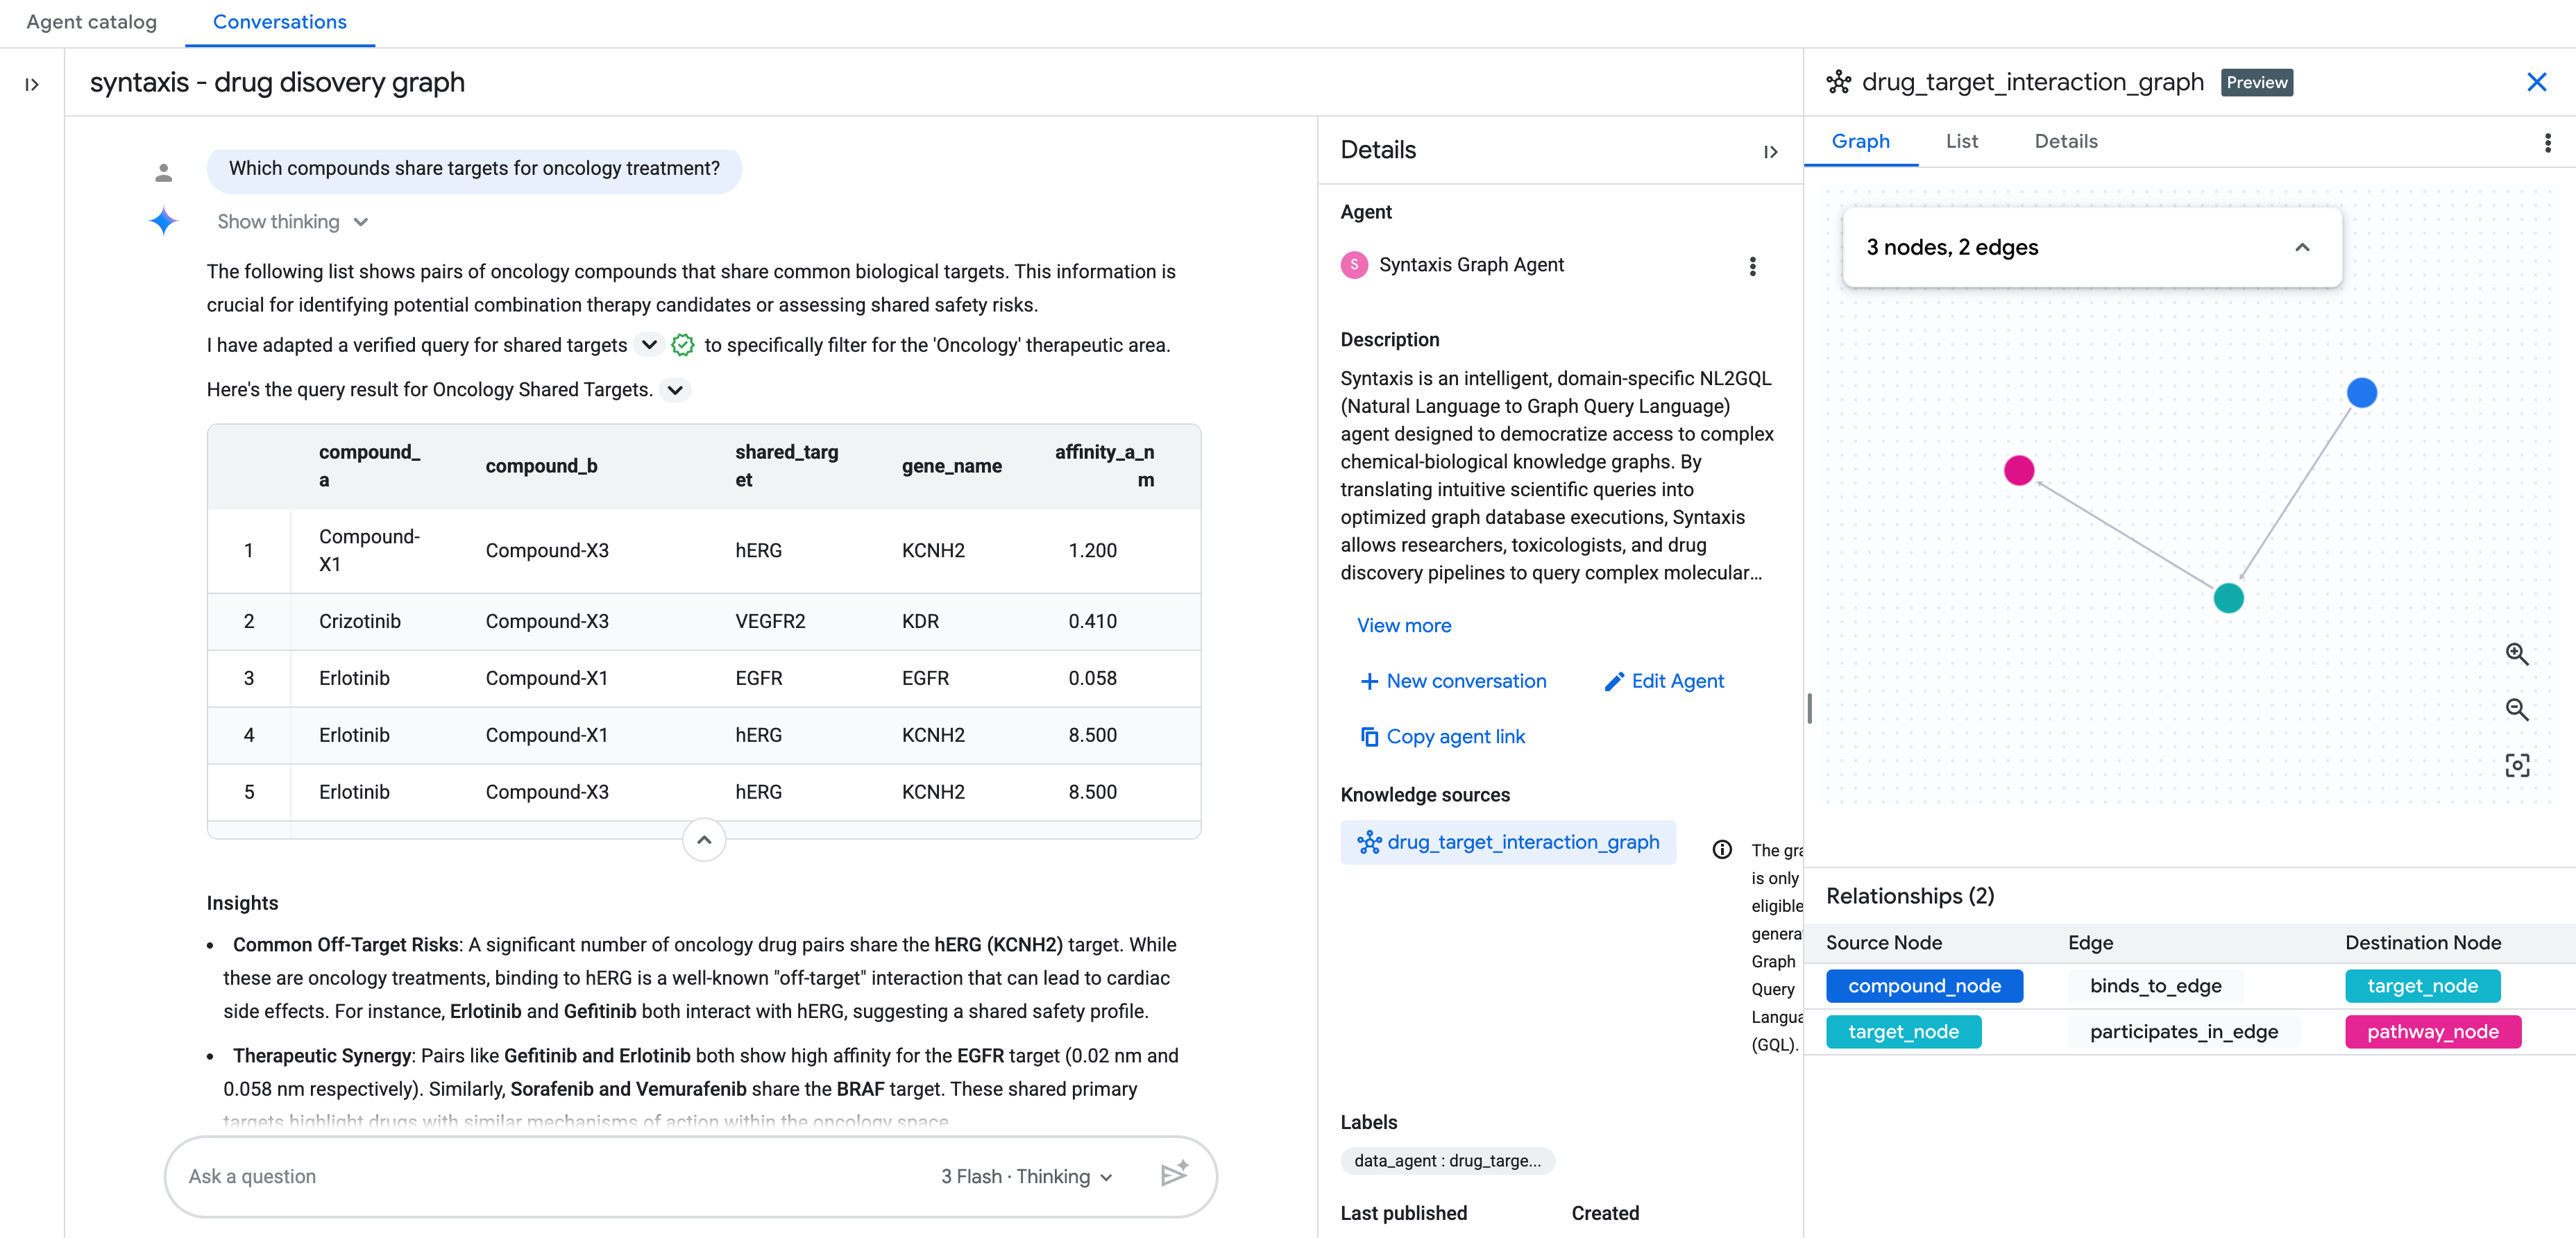
Use BigQuery Conversational Analytics to chat with your graph
Once you have added the knowledge source as graph, complete the rest of the conversational analytics agent setup.
You can then start chatting with your graph in natural language!
Additional questions
- What are all the targets for compounds currently in Phase 2 trials?
- Which targets are shared between cardiovascular and oncology compounds?
11. Clean up
To avoid ongoing charges to your Google Cloud account, delete the resources created during this codelab.
Run the following query to drop the schema and all tables cascadingly:
DROP SCHEMA IF EXISTS drug_target_graph CASCADE;
12. Congratulations
Congratulations! You have successfully modeled and analyzed a drug-target interaction network using BigQuery Graph.
What you've learned
- How to model entity relationships (compounds, targets, pathways) as a property graph.
- How to define the schema and create a Property Graph in BigQuery.
- How to write complex graph traversals using GQL and compare them to traditional SQL.
- How to leverage
GRAPH_TABLE,MATCH, and bidirectional matching to solve life sciences domain problems.