
1. Introduction
Last Updated: 2026-05-13
Investigate a GKE outage with the SRE Extension and build a beautiful Post Mortem
Welcome to this SRE workshop, for operators who want to experiment with SRE harnesses on Google Cloud!
This codelab will guide you through this:
- Install a GKE cluster based on a well-known , open source microservices-demo.
- Create an outage by breaking it in different ways (some more striking, some more nuanced).
- Install and use Antigravity CLI (or similar harness) + SRE Extension for the following part.
- Investigate and hopefully fix the outage.
- Create a Post Mortem.
- Use the graphing skills to generate a grounded graph which allows viewers to understand what happened and when.
Here is the step-by-step structure of the codelab:
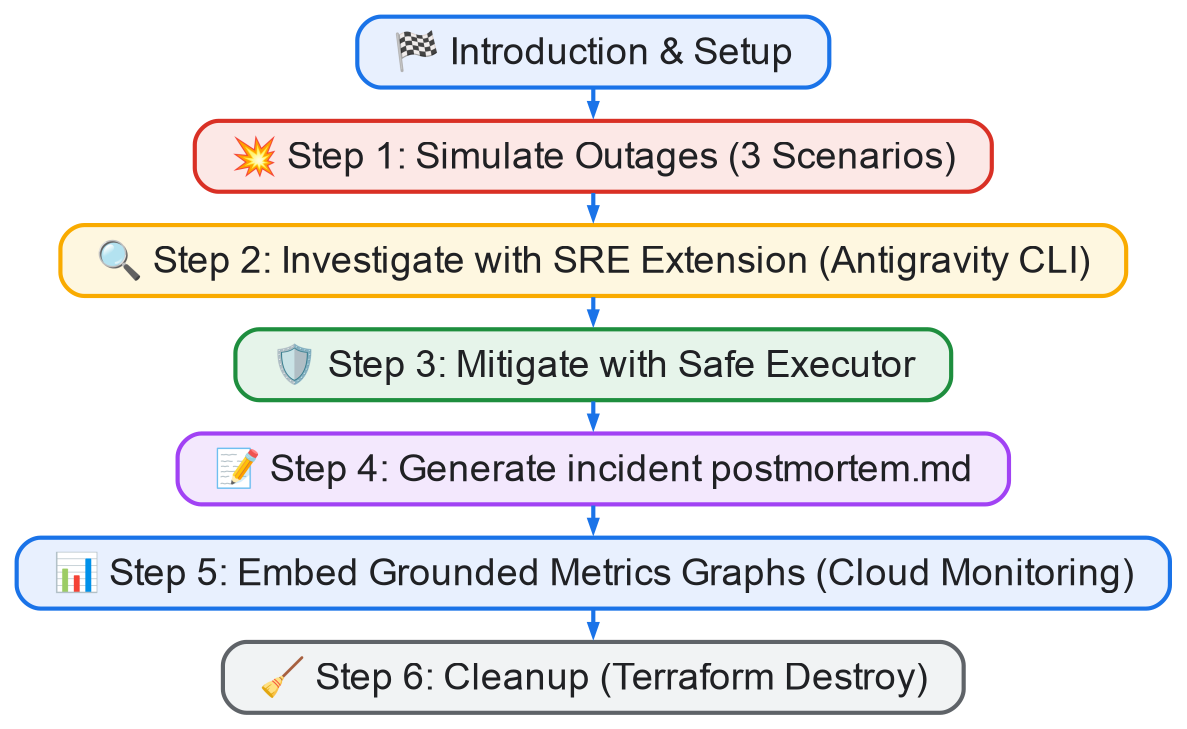
The goal of this workshop is to:
- demonstrate the capabilities of the SRE Extension and show you what's possible with it: OneMCP setup, Safe Executor, Investigation, Post Mortem Generation, graphs and CSV gists.
- Teach you the skills to investigate your own Google Cloud scenario.
Milestone 1: Environment Setup and Outage Simulation
The goal of this milestone is to set up a Kubernetes demo application on GKE Autopilot, install Antigravity CLI, and artificially trigger GKE cluster breakage scenarios to simulate production incidents.
Milestone 2: Investigation and Mitigation with SRE Extension
After breaking the environment, you will use agentic CLI tools equipped with the SRE Extension to systematically discover the infrastructure, triage the issues, implement the safe execution pattern for fixes, and verify cluster health.
Milestone 3: Post Mortem and Graph Generation
Once resolved, you will generate a structured incident postmortem document and use GCM (Google Cloud Monitoring) APIs to pull real metrics data, creating visual charts to document when and how the outage occurred.
What you'll build
In this codelab, you're going to investigate and fix GKE outages using the SRE Extension. You will:
- Simulate a GKE outage using network policy blockage, buggy canary deployments, and firewall rule updates.
- Triage the cluster outage using a CLI assistant powered by the SRE Extension.
- Implement remediation steps safely using the Safe Executor pattern.
- Generate a comprehensive postmortem document.
- Graph incident metrics using Google Cloud Monitoring time-series queries.
What you'll learn
- How to inspect GKE Kubernetes resources and policies using SRE Extension skills.
- How to leverage the Safe Executor pattern to run agent-suggested commands with proper risk evaluation.
- How to use the
monitoring-graphsskill to generate grounded charts of metrics directly from GCM. - How to document incident findings in a structured postmortem format.
What you'll need
- A Google Cloud Project with billing enabled.
- Command-line tools:
gcloud,kubectl,terraform. - Antigravity CLI installed locally or in Cloud Shell.
- An IDE (e.g., vscode, IntelliJ, RubyMine, or Vim).
Why SRE Extension + Agentic CLI?
Production outages are fast-paced and require correlation across multiple subsystems (Kubernetes resources, VPC networks, Cloud Monitoring metrics, IAM permissions). The SRE Extension allows agentic CLI helpers (like Antigravity CLI) to act as autonomous co-pilots, executing pre-compiled playbooks, querying monitoring graphs, and suggesting safe remediations while keeping the human operator in the loop.
2. Getting set up
Choose one of the following options: Self-paced environment setup if you want to run this codelab on your own machine, or; Start Cloud Shell if you want to run this codelab entirely in the cloud.
Self-paced environment setup
- Sign-in to the Google Cloud Console and create a new project or reuse an existing one. If you don't already have a Gmail or Google Workspace account, you must create one.

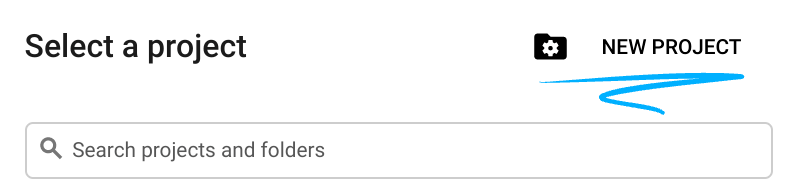
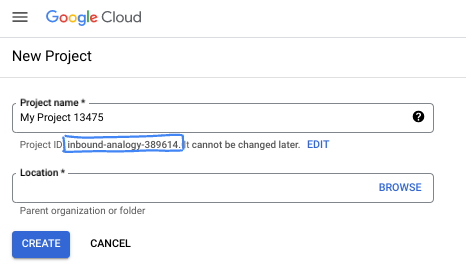
- The Project name is the display name for this project's participants. It is a character string not used by Google APIs. You can always update it.
- The Project ID is unique across all Google Cloud projects and is immutable (cannot be changed after it has been set). The Cloud Console auto-generates a unique string; usually you don't care what it is. In most codelabs, you'll need to reference your Project ID (typically identified as
PROJECT_ID). If you don't like the generated ID, you might generate another random one. Alternatively, you can try your own, and see if it's available. It can't be changed after this step and remains for the duration of the project. - For your information, there is a third value, a Project Number, which some APIs use. Learn more about all three of these values in the documentation.
- Next, you'll need to enable billing in the Cloud Console to use Cloud resources/APIs. Running through this codelab won't cost much, if anything at all. To shut down resources to avoid incurring billing beyond this tutorial, you can delete the resources you created or delete the project. New Google Cloud users are eligible for the $300 USD Free Trial program.
Start Cloud Shell
While Google Cloud can be operated remotely from your laptop, in this codelab you will be using Google Cloud Shell, a command line environment running in the Cloud.
From the Google Cloud Console, click the Cloud Shell icon on the top right toolbar:
It should only take a few moments to provision and connect to the environment. When it is finished, you should see something like this:

This virtual machine is loaded with all the development tools you'll need. It offers a persistent 5GB home directory, and runs on Google Cloud, greatly enhancing network performance and authentication. All of your work in this codelab can be done within a browser. You do not need to install anything.
3. Prerequisites (Installation)
For this tutorial, you need to install:
1. Python and uv
python and uv (package manager for Python). Ensure you have uv installed:
$ curl -LsSf https://astral.sh/uv/install.sh | sh
Why uv? While you can use whichever Python manager you prefer, using uv will ensure the ENV/PATH setup for python will be equal for you and for Antigravity CLI, so your shell experience will be mostly the same as Antigravity CLI's. If you use virtualenv , for instance, Antigravity CLI will be forced to do things like "source .env/venv/bin/activate && my-original-command" to mimic your environment.
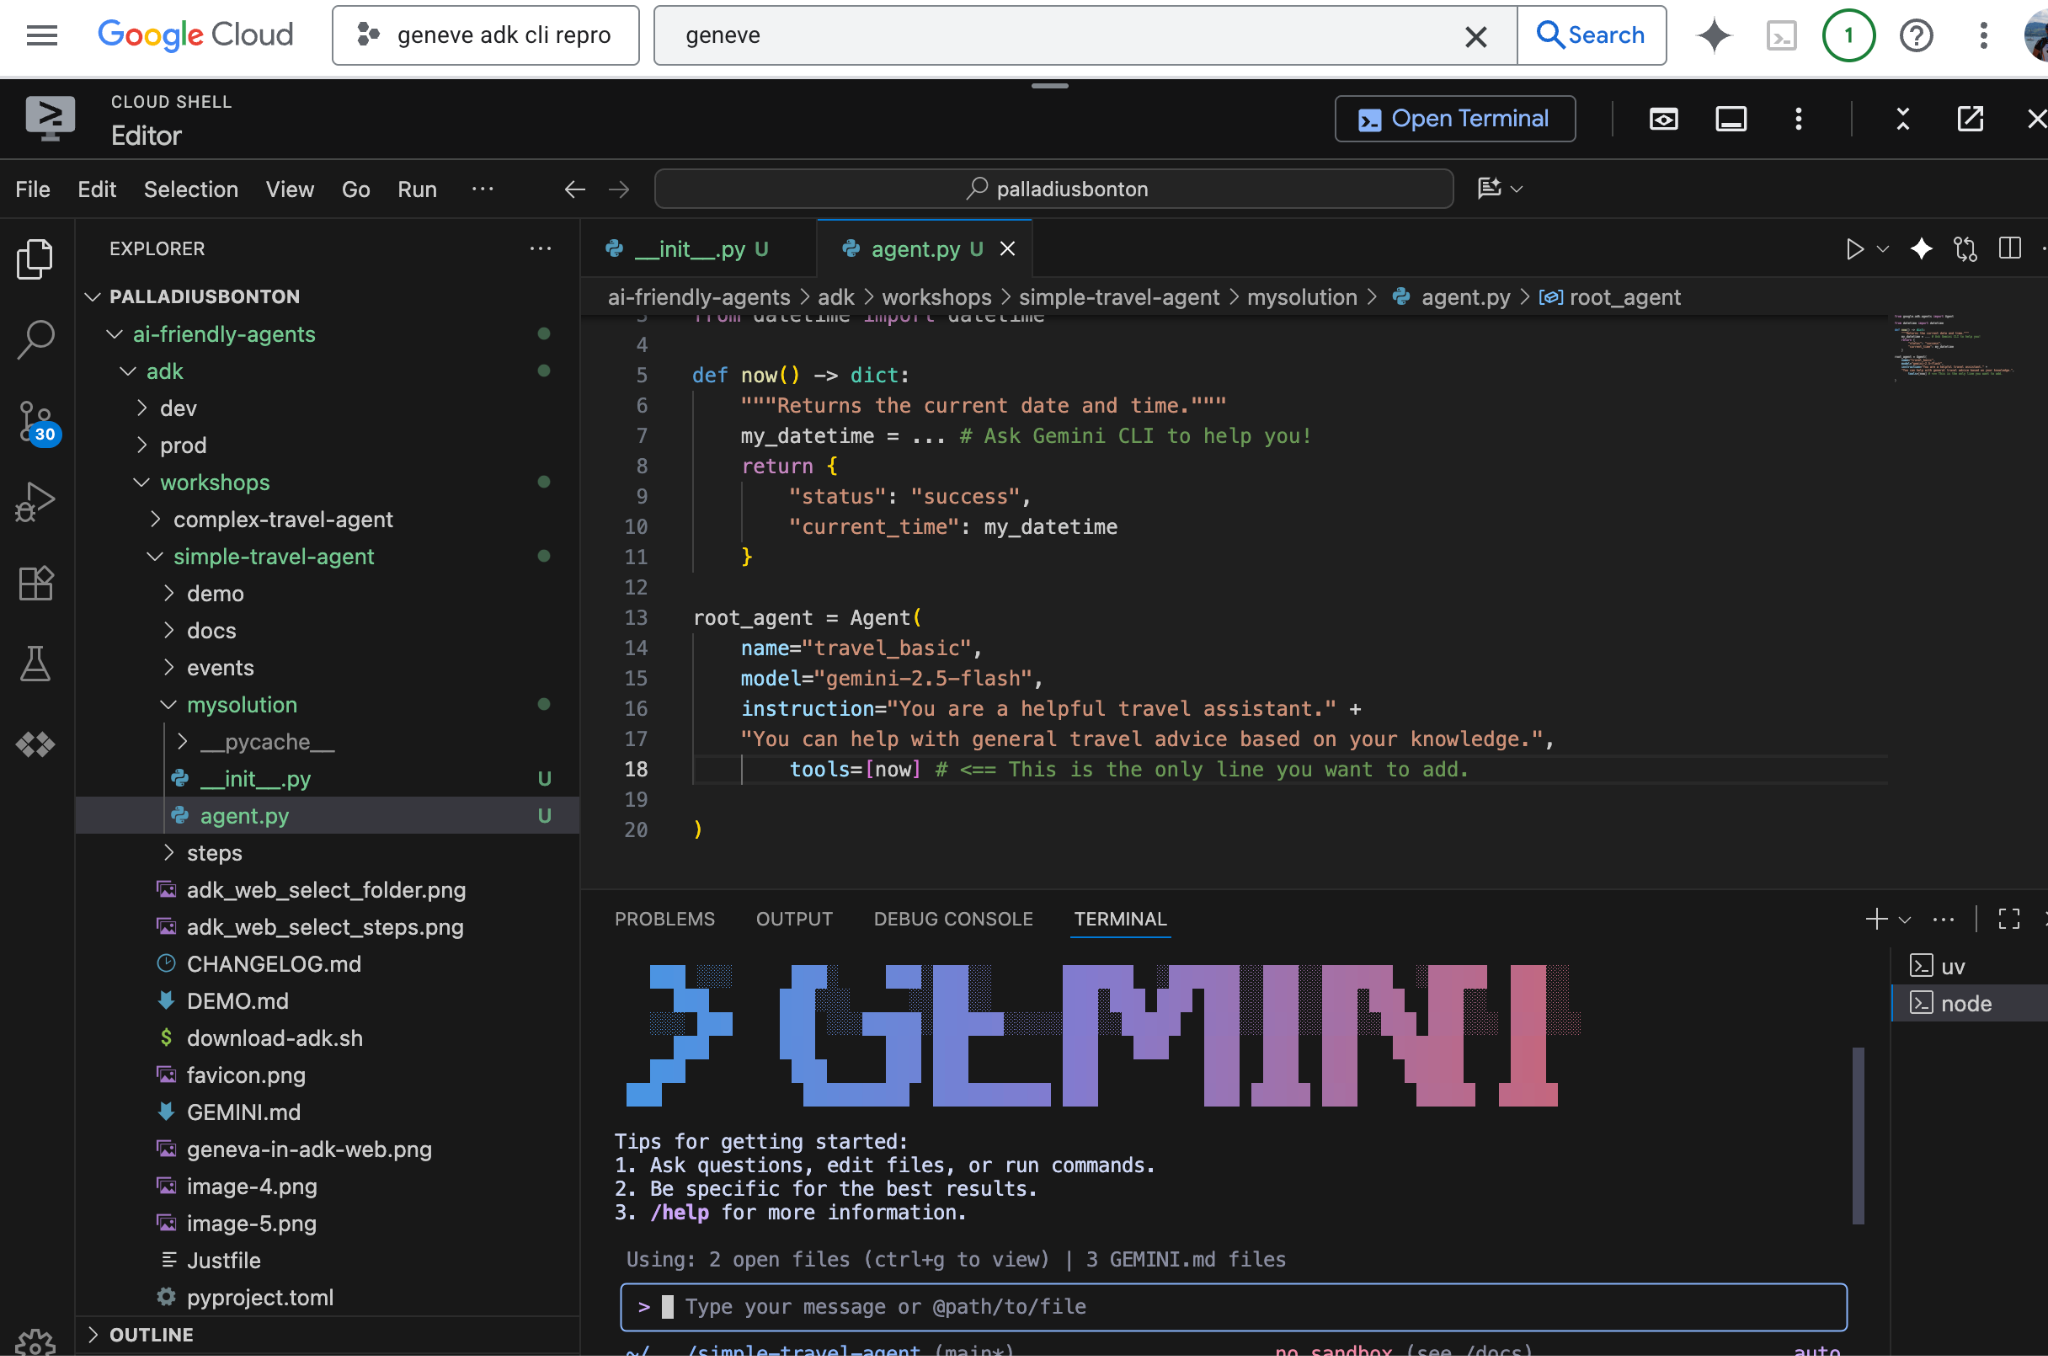
2. Antigravity CLI (agy)
To install the official Antigravity CLI (the agy command), open your terminal and run the bootstrap installer:
For macOS and Linux:
$ curl -fsSL https://antigravity.google/cli/install.sh | bash
For Windows (PowerShell):
irm https://antigravity.google/cli/install.ps1 | iex
This script will dynamically detect your OS and architecture, download the latest compiled
agy
binary, and configure your PATH. Restart your terminal or reload your shell configuration for the changes to take effect.
Authentication
You need either a Google AI Studio API Key.
Export your API Key:
export GEMINI_API_KEY="your-api-key"
Authenticate with gcloud:
export GOOGLE_CLOUD_PROJECT="YOUR_PROJECT_ID"
export GOOGLE_CLOUD_LOCATION="YOUR_PROJECT_LOCATION"
gcloud auth application-default login
Set up your work environment and deploy microservices demo application
Let's clone the microservices-demo application and deploy the infrastructure and application through terraform
This is the moment where you can open your IDE (Visual Studio Code, IntelliJ, RubyMine, ..) and open the folder.
# 1. Find an empty directory, and download this repo.
git clone https://github.com/GoogleCloudPlatform/microservices-demo.git
cd microservices-demo/terraform

# 2. Update project ID to your gcloud project ID
sed -i 's/<project_id_here>/YOUR_ACTUAL_PROJECT_ID/g' terraform.tfvars

# 3. Deploy the microservices-demo application in GKE autopilot
# If there is a prompt answer yes and continue. This step can take up to 10 mins for provision gke autopilot cluster and deploy microservices-demo application
terraform init
terraform plan
terraform apply

# 4. Verify the IP address of frontend-service to access the online-boutique application
kubectl get service frontend-external | awk '{print $4}'

# 5. Find an empty directory , and download this repo.
git clone https://github.com/palladius/sre-testing-suite.git
cd sre-testing-suite/test-scenarios/microservices-demo-gke/breakage-scenarios
To test your setup, you can access the http://[IP ADDRESS] and load the online-boutique app
Set up your work environment for sre-antigravity-cli-extension
# 1. Install the SRE Extension plugin globally
git clone https://github.com/gemini-cli-extensions/sre.git ~/.gemini/config/plugins/sre-extension

# 2. Launch the Antigravity CLI (agy)
agy  # This runs the CLI under your current breakage-scenarios folder.
# Login with your corporate or personal account when prompted.

# 3. Within the agy agent prompt, configure your MCP servers and GCP project
Use the gcp-mcp-setup skill to setup my GCP project "<gcp_project_id>" with email jane-doe-sre@credible-company.com
4. Step 1: Simulate the Outage (Breakage Scenarios)
In this step, we will intentionally break the deployed GKE cluster to simulate a real-world production incident. You have three scenarios to choose from (or try all three sequentially):
Scenario 1: Checkout Service Network Blockage (Standard/Autopilot)
This scenario simulates a broken connection between the frontend and the checkout service by applying a Kubernetes NetworkPolicy that acts as a traffic "black hole".
- Navigate to the scenario folder:
cd breakage1-checkout
- Trigger the breakage:
./break.sh
update-checkout-from-frontendin thedefaultnamespace which denies ingress traffic tocheckoutserviceunless it comes from a pod with labelapp: frontend-checkout-test(which does not exist). - Try to purchase items on the Online Boutique frontend. The checkout page will hang or display an HTTP 500 error.
Scenario 2: Buggy Canary Rollout (Autopilot with Istio)
This scenario simulates a bad deployment where a buggy version of the frontend is rolled out via a Kubernetes Canary deployment.
- Navigate to the scenario folder:
cd ../breakage2-canary
- Trigger the breakage:
./break.sh
frontend-canarythat has a typo in its environment variables:PRODUCT_CATALOG_SERVICE_ADDRis configured toproductcatalogservices:3550instead ofproductcatalogservice:3550. - Load the frontend homepage. It will occasionally fail (depending on routing weights) because the canary service fails to resolve the product catalog.
Scenario 3: VPC Firewall Cluster Blockage
This scenario simulates a mistake in VPC firewall configuration that blocks all ingress traffic to the GKE cluster.
- Navigate to the scenario folder:
cd ../breakage3-firewall
- Trigger the breakage:
./break.sh
frontend-ingress-v2withpriority=1and actionDENYtargeting ingress traffic to ports80,443, and8080. - The Online Boutique website will become completely unreachable, and requests will time out.
5. Step 2: Outage Investigation with the SRE Extension
Now that the application is down, let's start the investigation using your CLI assistant (Antigravity CLI).
- Go back to the main breakage scenarios folder and launch your CLI helper:
cd ..
agy
- Ask the assistant to perform an infrastructure discovery and diagnostic check:
Investigate my GKE cluster for outages. Are all services healthy? - What the Agent Does:
- It activates the
investigation-entrypointandgcp-playbooksskills. - It lists Kubernetes pods, deployments, and services to locate failing targets.
- It inspects network policies (for Scenario 1) or deployment configurations (for Scenario 2) or firewall rules (for Scenario 3).
- It activates the
- For Scenario 1, the agent should report: 🔴 Incident Identified: A
NetworkPolicynamedupdate-checkout-from-frontendis isolating thecheckoutservicepods. - For Scenario 2, the agent should report: 🔴 Incident Identified: Deployment
frontend-canaryis configured with an invalid service endpointproductcatalogservices:3550instead ofproductcatalogservice:3550. - For Scenario 3, the agent should report: 🔴 Incident Identified: A VPC firewall rule
frontend-ingress-v2is denying ingress traffic on ports80,443, and8080.
6. Step 3: Mitigating and Fixing the Outage
Let's use the CLI's Safe Executor pattern to remediate the outage.
- Ask your CLI assistant to propose and apply a fix:
Propose a fix for the outage and apply it. - Safe Executor in Action:
- Before executing command suggestions, the SRE Extension runs a safety audit using the
safe-sre-investigatorskill. - It will show you the exact command it intends to run and rate the risk (e.g., Low, Medium, High).
- For Scenario 1, it will propose:
kubectl delete networkpolicy update-checkout-from-frontend
- For Scenario 2, it will propose:
kubectl delete deployment frontend-canary
- For Scenario 3, it will propose:
gcloud compute firewall-rules delete frontend-ingress-v2 --quiet
- Before executing command suggestions, the SRE Extension runs a safety audit using the
- Confirm the command execution when prompted by the CLI.
- Verify that the website is back up and fully functional by refreshing the Online Boutique homepage.
- In your shell, you can run the corresponding scenario check script to verify health:
./breakage1-checkout/check.sh
# or ./breakage2-canary/check.sh
# or ./breakage3-firewall/check.sh
7. Step 4: Generating the Incident Post Mortem
An essential part of the SRE lifecycle is documenting the incident so the team can learn from it. Let's automate this using the postmortem-create skill.
- In your CLI assistant, ask to write the postmortem document:
Create a postmortem for the checkout service network policy outage. - The agent will collect details about:
- The start time of the incident (retrieved from your CLI command history/logs).
- The root cause (the blocking NetworkPolicy).
- The actions taken to mitigate it.
- It will write a new Markdown file named
postmortem.mdin your workspace. - Open
postmortem.mdto review the details. You will see sections like:- Incident Summary
- Timeline of Events
- Root Cause Analysis (RCA)
- Action Items / Preventive Measures
8. Step 5: Adding Grounded Metrics Graphs
To make the postmortem professional, we need visual proof of the incident. We'll use the monitoring-graphs skill to fetch time-series data from Google Cloud Monitoring (GCM) and generate a PNG chart showing the error spike.
- Ask your CLI helper to generate the graph and add it to the postmortem:
Query GCM for frontend HTTP request error rates over the last 1 hour, generate a line chart, and embed it into postmortem.md. - Under the Hood:
- The agent calls the
monitoring-graphsPython script to query Cloud Monitoring. - It fetches metrics (e.g.,
kubernetes.io/container/restart_countorloadbalancing.googleapis.com/https/request_count). - It plots the chart using
matplotliband saves it asincident_metrics.png. - It updates the
postmortem.mdfile by inserting an image link:
- The agent calls the
- Open the generated
incident_metrics.pngfile to see the chart illustrating the exact moments when the cluster went down and when traffic returned to normal.
9. Step 6: Cleanup
To ensure your Google Cloud account doesn't incur unnecessary charges, let's clean up the deployed infrastructure.
- Navigate to the terraform folder:
cd ../../microservices-demo/terraform
- Run the destroy command:
terraform destroy -auto-approve
- Verify that all GCP GKE resources have been successfully deleted.
10. Congratulations!
You have completed the GKE Cluster Breakage and Outage Investigation Codelab!
What you've covered:
- Deployed the 10-tier Online Boutique microservice demo to GKE.
- Simulated three real-world SRE outages (network policy denial, buggy canary rollout, VPC firewall rule denial).
- Used the SRE Extension for Antigravity CLI to discover and diagnose the outages.
- Leveraged the Safe Executor pattern to review and execute remediation commands.
- Created a professional Markdown postmortem.
- Queried Cloud Monitoring metrics to automatically generate and embed a grounded incident graph.
For more details on extending your CLI agent, check out the SRE Extension GitHub page.