
1. Welcome
Thanks for joining us at the Istio Multi Cloud Burst codelab by Google.This codelab requires beginner-level hands-on experience with Kubernetes, Node and Go. What you will need
|
|

What you will learn
- How to create a Kubernetes cluster on GKE
- How to install Istio on a Kubernetes cluster with Helm
- How to install Istio Multicluster with Helm
- Deploying a web application from source to Kubernetes
- Writing and Applying Traffic Routing rules to Istio
- Prometheus Metrics
- Build and push container images inside a Kubernetes cluster
2. Getting set up
You can follow this codelab on either:
- Google Cloud Shell (recommended): in-browser shell, comes with tools installed
- your laptop (follow the instructions below)
Start with Google Cloud Platform
- Pick up your free user account card from the instructor if you don't have a GCP account.
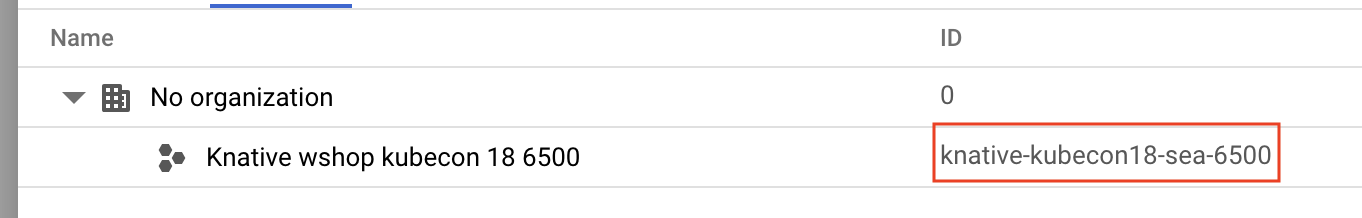
- Go to Google Cloud Console and click "Select a project":

- Make a note of the "ID" of the project somewhere, then click on the project to choose it:
Option 1: Use Google Cloud Shell (recommended)
Cloud Shell provides a command-line shell inside your browser with the tools you need installed and automatically authenticated to your Google Cloud Platform account. (If you don't wish to run this exercise on Cloud Shell, skip to the next section.)
Go to Cloud Console and click "Activate Cloud Shell" on the top right toolbar:

Add tools to Cloud Shell
- Install
kubectx****: by downloading the bash scripts from here into a location in $PATH. - Install
helm****: following these instructions.
Alternatively run these commands to install both to ~/.bin and add it to your $PATH:
mkdir -p ~/.bin && \
cd ~/.bin && \
curl -LO https://raw.githubusercontent.com/ahmetb/kubectx/master/kubectx && \
chmod +x kubectx && \
curl -LO https://raw.githubusercontent.com/ahmetb/kubectx/master/kubens && \
chmod +x kubens && \
curl -LO  https://storage.googleapis.com/kubernetes-helm/helm-v2.12.0-linux-amd64.tar.gz && \
tar xzf helm-v2.12.0-linux-amd64.tar.gz && \
rm helm-v2.12.0-linux-amd64.tar.gz && \
mv linux-amd64/helm ./helm && \
rm -r linux-amd64 && \
export PATH=${HOME}/.bin:${PATH}
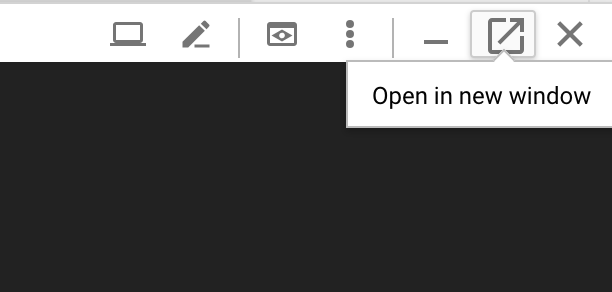
Some quick tips that can make it easier to use Cloud Shell:
1. Detach the shell into a new window: |
|
2. Using file editor: Click the pencil icon on the top right to launch an in-browser file editor. You will find this useful as we will copy code snippets into files. |
|
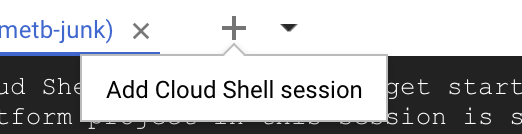
3. Start new tabs: If you need more than one terminal prompts. |
|
4. Make the text larger: Default font size on Cloud Shell can be too small to read. | Ctrl-+ on Linux/Windows⌘-+ on macOS. |

Option 2: Set up your laptop (not recommended)
If you feel more comfortable using your own workstation environment than Cloud Shell, set up the following tools:
- Install
gcloud:(Pre-installed on Cloud Shell.) Follow instructions to installgcloudon your platform. We will use this to create a Kubernetes cluster. - Install
kubectl:(Pre-installed on Cloud Shell.) Run the following command to install:
gcloud components install kubectl
Run the following command to authenticate gcloud. It will ask you to log in with your Google account. Then, choose the pre-created project (seen above) as the default project. (You can skip configuring a compute zone):
gcloud init
- Install
curl:Pre-installed on most Linux/macOS systems. You probably have it already. Otherwise, search the internet on how to install it. - Install
kubectx****: by downloading the bash scripts from here into a location in $PATH - Install
helm****: following these instructions.
3. Setup GCP Project
Enable GKE (Google Kubernetes Engine), GCR (Google Container Registry), and GCB (Google Cloud Build) APIs on your project:
gcloud services enable \
  cloudapis.googleapis.com \
  container.googleapis.com \
  containerregistry.googleapis.com \
  cloudbuild.googleapis.com
Set up Environment Variables
We will be working with our Google Cloud project extensively during setup, let's set an environment variable for quick reference
export GCLOUD_PROJECT=$(gcloud config get-value project)
We will be creating some code and configuration files during this workshop so let's create a project directory and change into it
mkdir -p src/istio-burst && \
cd src/istio-burst && \
export proj=$(pwd)
4. Create "primary" Kubernetes cluster
You can easily create managed Kubernetes cluster with Google Kubernetes Engine (GKE).
The following command will create a Kubernetes cluster:
- named "primary",
- in us-west1-a zone,
- The latest version of Kubernetes available,
- with 4 initial nodes
export cluster=primary
export zone=us-west1-a
gcloud container clusters create $cluster --zone $zone --username "admin" \
--cluster-version latest --machine-type "n1-standard-2" \
--image-type "COS" --disk-size "100" \
--scopes "https://www.googleapis.com/auth/compute",\
"https://www.googleapis.com/auth/devstorage.read_only",\
"https://www.googleapis.com/auth/logging.write",\
"https://www.googleapis.com/auth/monitoring",\
"https://www.googleapis.com/auth/servicecontrol",\
"https://www.googleapis.com/auth/service.management.readonly",\
"https://www.googleapis.com/auth/trace.append" \
--num-nodes "4" --network "default" \
--enable-cloud-logging --enable-cloud-monitoring --enable-ip-alias
(This may take around 5 minutes. You can watch the cluster being created at Cloud Console.)
After the Kubernetes cluster is created, gcloud configures kubectl with the credentials pointing to the cluster.
gcloud container clusters get-credentials $cluster --zone=$zone
You should be able to use kubectl with your new cluster now.
Run the following command to list Kubernetes nodes of your cluster (they should show status "Ready"):
kubectl get nodes
Modify Kubeconfig names for ease of use
We'll be switching between contexts frequently so having a short alias for our clusters is handy.
This command will rename the kubeconfig entry you just created to primary
kubectx ${cluster}=gke_${GCLOUD_PROJECT}_${zone}_${cluster}
Set permissions:
Deploying Istio requires you be a cluster admin. This command will set the email associated with your Google Cloud account as the cluster admin
kubectl create clusterrolebinding cluster-admin-binding \
    --clusterrole=cluster-admin \
    --user=$(gcloud config get-value core/account)
5. Create "burst" cluster
The following command will create a Kubernetes cluster:
- named "burst",
- in us-west1-a zone,
- The latest version of Kubernetes available,
- With 1 initial nodes
- Autoscaling enabled up to 5 nodes
export cluster=burst
export zone=us-west1-a
gcloud container clusters create $cluster --zone $zone --username "admin" \
--cluster-version latest --machine-type "n1-standard-2" \
--image-type "COS" --disk-size "100" \
--scopes "https://www.googleapis.com/auth/compute",\
"https://www.googleapis.com/auth/devstorage.read_only",\
"https://www.googleapis.com/auth/logging.write",\
"https://www.googleapis.com/auth/monitoring",\
"https://www.googleapis.com/auth/servicecontrol",\
"https://www.googleapis.com/auth/service.management.readonly",\
"https://www.googleapis.com/auth/trace.append" \
--num-nodes "1" --enable-autoscaling --min-nodes=1 --max-nodes=5 \
--network "default" \
--enable-cloud-logging --enable-cloud-monitoring --enable-ip-alias
(This may take around 5 minutes. You can watch the cluster being created at Cloud Console.)
After the Kubernetes cluster is created, gcloud configures kubectl with the credentials pointing to the cluster.
gcloud container clusters get-credentials $cluster --zone=$zone
You should be able to use kubectl with your new cluster now.
Run the following command to list Kubernetes nodes of your cluster (they should show status "Ready"):
kubectl get nodes
Modify Kubeconfig names for ease of use
This command will modify the kubeconfig entry you just made to burst
kubectx ${cluster}=gke_${GCLOUD_PROJECT}_${zone}_${cluster}
Set permissions:
Deploying Istio Remote requires you be a cluster admin. This command will set the email associated with your Google Cloud account as the cluster admin
kubectl create clusterrolebinding cluster-admin-binding \
    --clusterrole=cluster-admin \
    --user=$(gcloud config get-value core/account)
6. Apply Firewall Rules
In order for our two clusters to communicate with each other, we will need to create a Firewall rule.
Run the following commands to create a Firewall rule in Google Cloud Platform that will allow our clusters to communicate
function join_by { local IFS="$1"; shift; echo "$*"; }
ALL_CLUSTER_CIDRS=$(gcloud container clusters list \
--filter="(name=burst OR name=primary) AND zone=$zone" \
--format='value(clusterIpv4Cidr)' | sort | uniq)
ALL_CLUSTER_CIDRS=$(join_by , $(echo "${ALL_CLUSTER_CIDRS}"))
ALL_CLUSTER_NETTAGS=$(gcloud compute instances list \
--filter="(metadata.cluster-name=burst OR metadata.cluster-name=primary) AND metadata.cluster-location=us-west1-a" \
--format='value(tags.items.[0])' | sort | uniq)
ALL_CLUSTER_NETTAGS=$(join_by , $(echo "${ALL_CLUSTER_NETTAGS}"))
gcloud compute firewall-rules create istio-multicluster-test-pods \
  --allow=tcp,udp,icmp,esp,ah,sctp \
  --direction=INGRESS \
  --priority=900 \
  --source-ranges="${ALL_CLUSTER_CIDRS}" \
  --target-tags="${ALL_CLUSTER_NETTAGS}" --quiet
We have both of our clusters setup and ready for us to deploy our application and Istio on them!
7. Introduction to Istio
What Is Istio?
Istio is a service mesh control plane that aims to "connect, secure, control, and observe services". It does so in a variety of ways, but primarily by sidecar-ing a proxy container ( Envoy) into each of your deployed Kubernetes Pods. The proxy container controls all network communication between microservices in tandem with a general-purpose policy and telemetry hub ( Mixer).
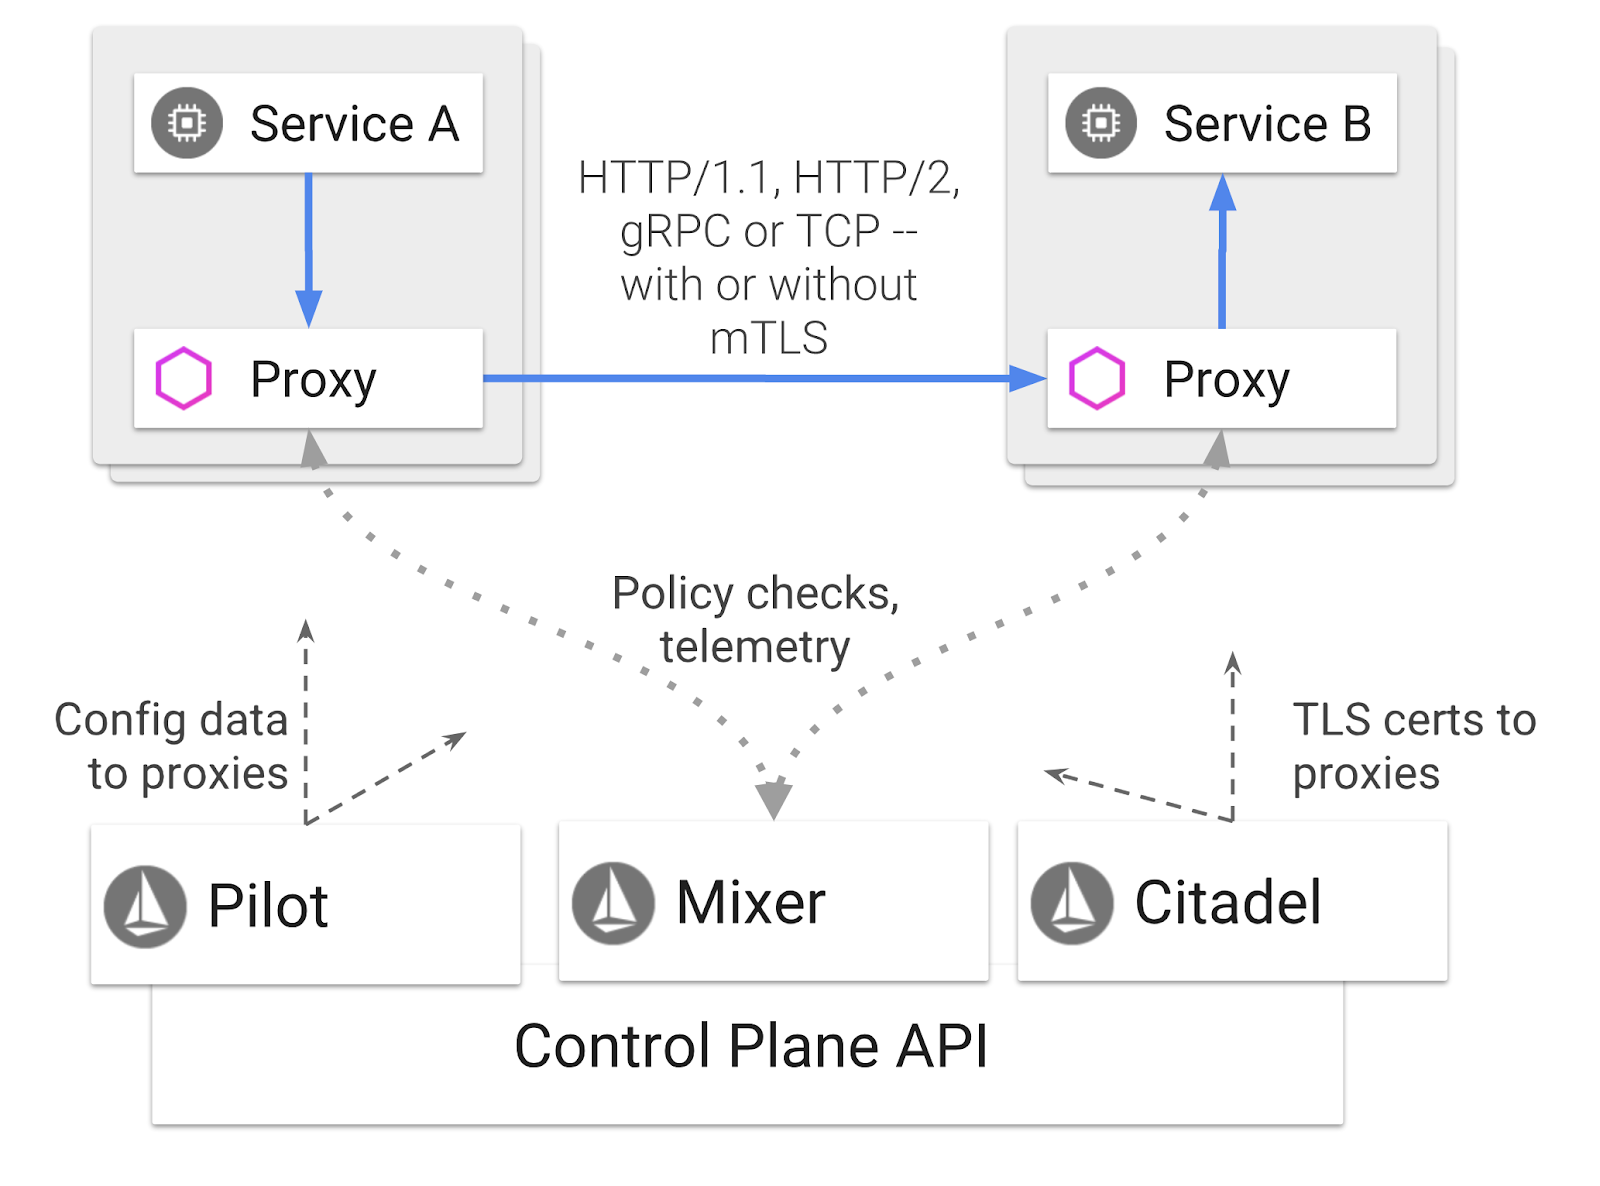
These policies can be applied independently of your Kubernetes Deployments and Services, which means the Network Operator can observe the network activity, restrict, redirect or rewrite network policies without redeploying the associated applications.
Some of the Traffic Management features Istio Supports are:
- Circuit breakers
- Percentage-based traffic splitting
- URL rewriting
- TLS termination
- Health checks
- Load balancing
For the purposes of this workshop, we will be focusing on percentage-based traffic splitting.
Istio Terms We will Be Working With
VirtualService
A VirtualService defines a set of traffic routing rules to apply when a host is addressed.
Gateway
A Gateway is a load balancer operating at the edge of the mesh receiving incoming or outgoing HTTP/TCP connections. Gateways can specify Ports, SNI configurations, etc.
DestinationRule
A DestinationRule defines policies that apply to traffic intended for a service after routing has occurred. They specify configuration for load balancing, connection pool size from the sidecar, and outlier detection settings.
Istio Multicluster
You may have noticed when we created our two clusters, that our primary cluster was 4 nodes without autoscaling, and our burst cluster was 1 node with autoscaling up to 5 nodes.
There are two reasons for this configuration.
First, we want to simulate an "on-prem" to Cloud scenario. In an on-prem environment you don't have access to autoscaling clusters as you have fixed infrastructure.
Second, a 4 node setup (as defined above) is the minimum requirements to run Istio. This begs the question: if Istio requires a minimum of 4 nodes, how can our burst cluster run Istio with 1 node? The answer is that Istio Multicluster installs a much smaller set of the Istio services, and communicates with the Istio installation in the primary cluster to retrieve the policy rules and publish telemetry information.
8. Application Architecture Overview
Components Overview
We will be deploying a three tiered application using NodeJS and Redis.
Worker
The worker application is written in NodeJS and will listen for incoming POST HTTP requests, perform a hashing operation on them and, if an environment variable named PREFIX is defined, it will prepend the hash with that value. Once the hash has been calculated, the application sends the result on the channel "calculation" on the specified Redis server.
We will be using the PREFIX environment variable later on to demonstrate the multicluster functionality.
For reference: these are the packages the application uses.
body-parser:Allows us to parse our http requestscors:Allows use of Cross Origin Resource Sharingdotenv:Easy parsing of environment variablesexpress:Easy web site hostingioredis:Client library to communicate with Redis databasesmorgan:Provides nice structured log
Frontend
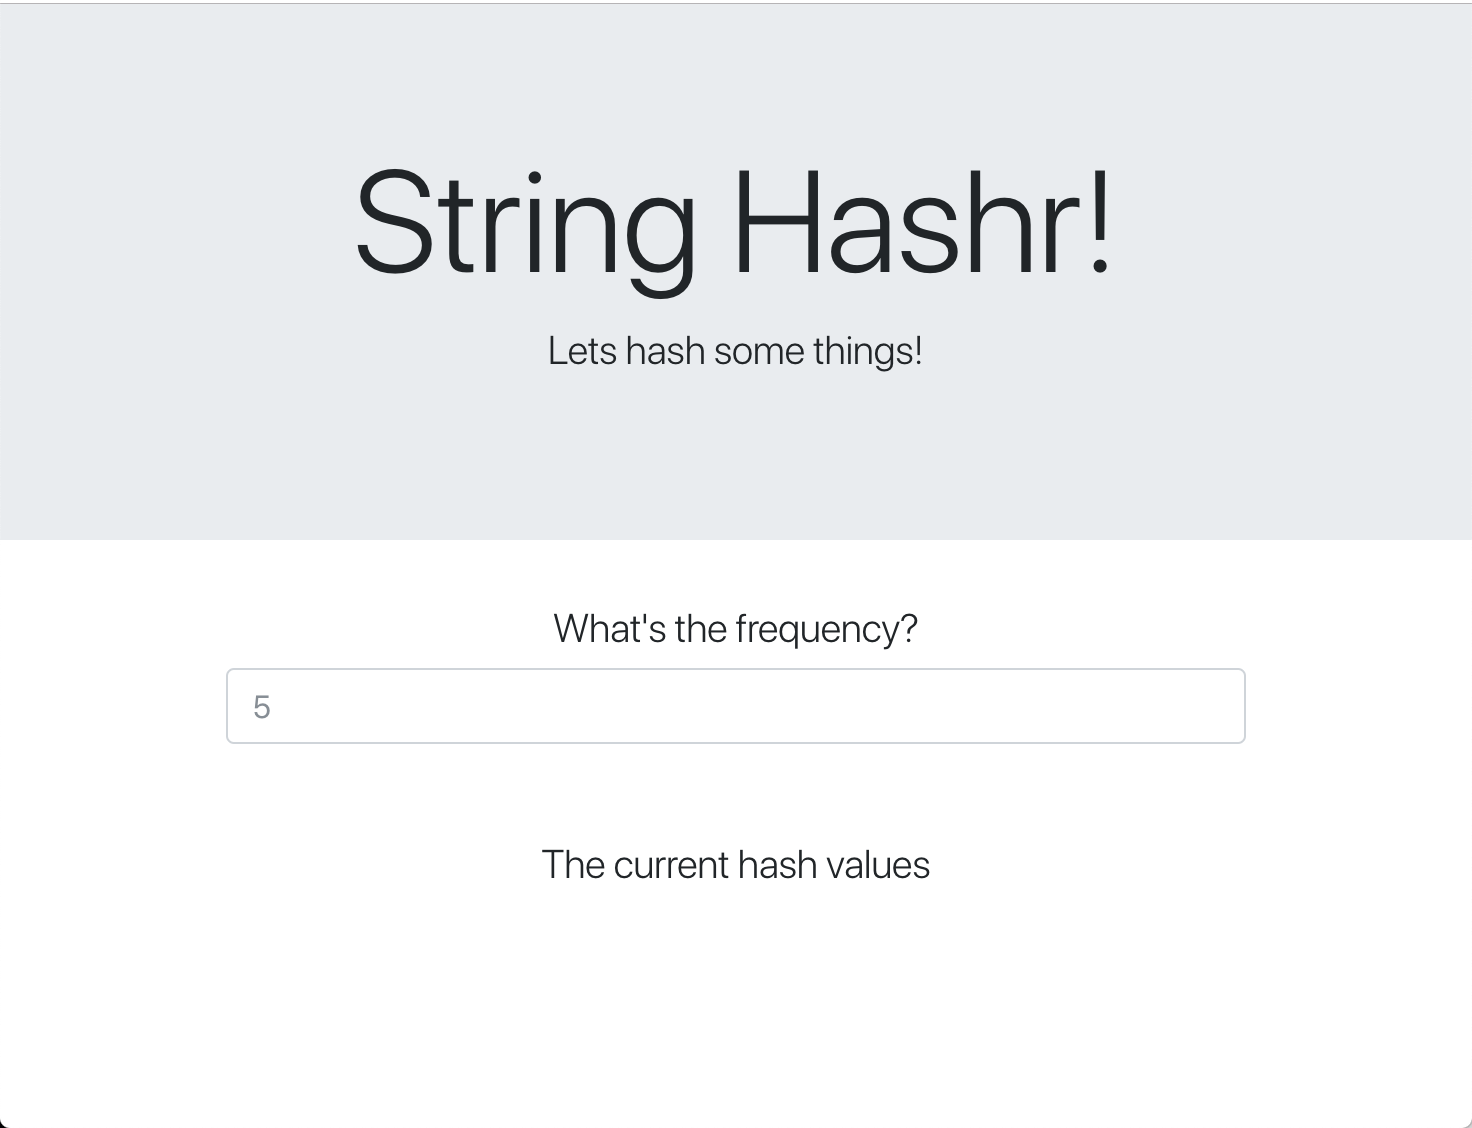
Our frontend is also a NodeJS application that hosts a web page using express. It takes a user inputted frequency and sends requests to our worker application at that rate. This application also subscribes to messages on a Redis channel named "calculation" and displays the results in a web page.
The application uses the following dependencies.
body-parser:Allows us to parse our http requestsdotenv:Easy parsing of environment variablesexpress:Easy web site hostingioredis:Client library to communicate with Redis databasesmorgan:Provides nice structured logsrequest:Allows for making HTTP requestssocket.io:Allows for bidirectional communication from the Web Page to the server
This webpage uses Bootstrap for styling and, when run, looks like the following
Architecture Diagram
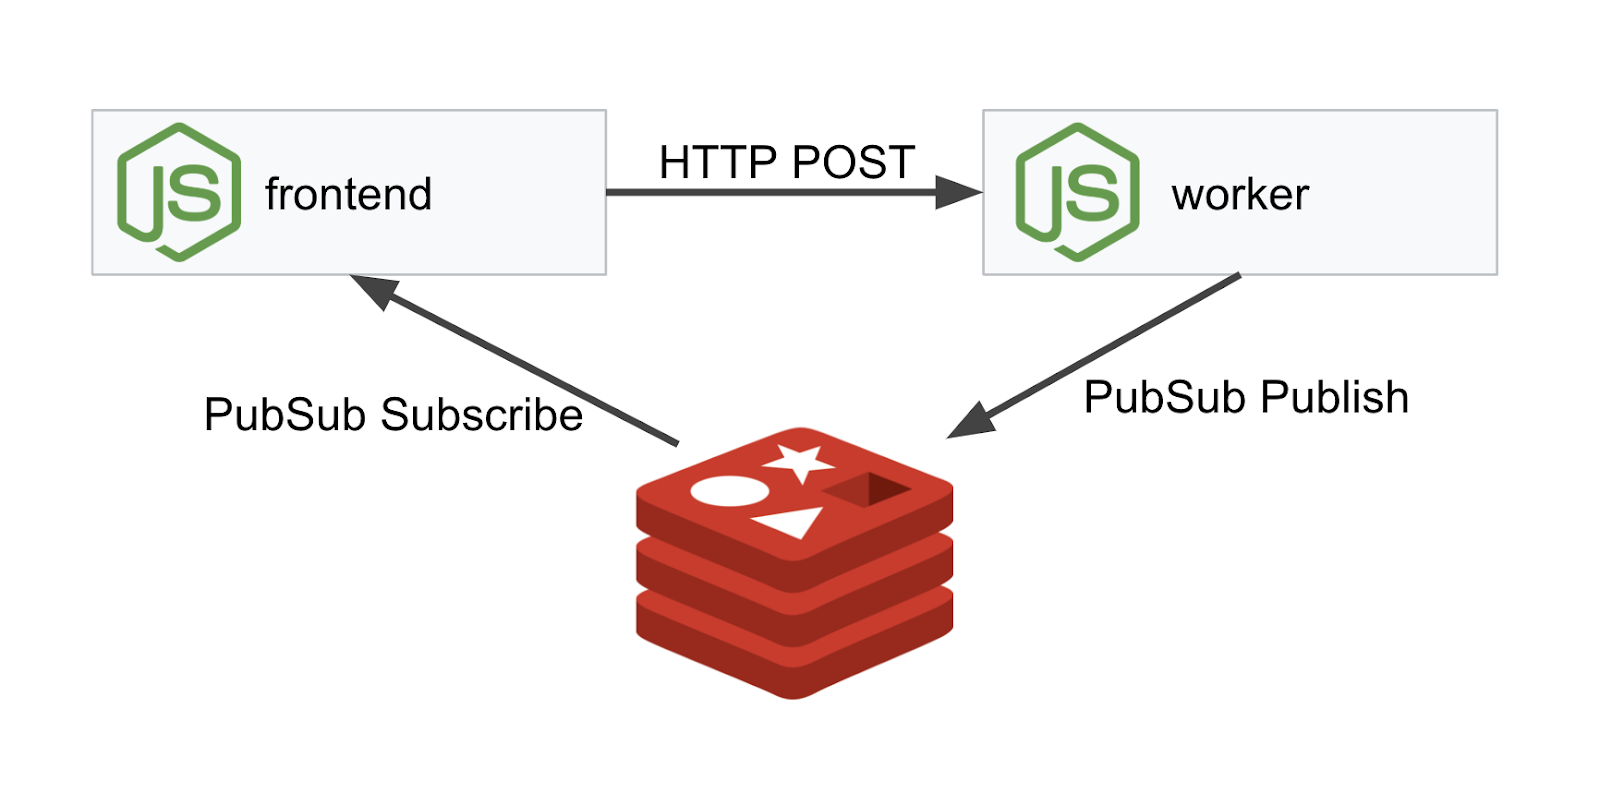
Deployment Diagram
We will be deploying our final application across the two clusters we created. The primary cluster will have all components (frontend, worker, and Redis) deployed to it, but burst cluster will only have the worker application deployed.
Here is a diagram describing the two clusters. The boxes outlined in red are Kubernetes Services, the ones in blue are Kubernetes Deployments. The yellow boxes signify our installation of Istio.
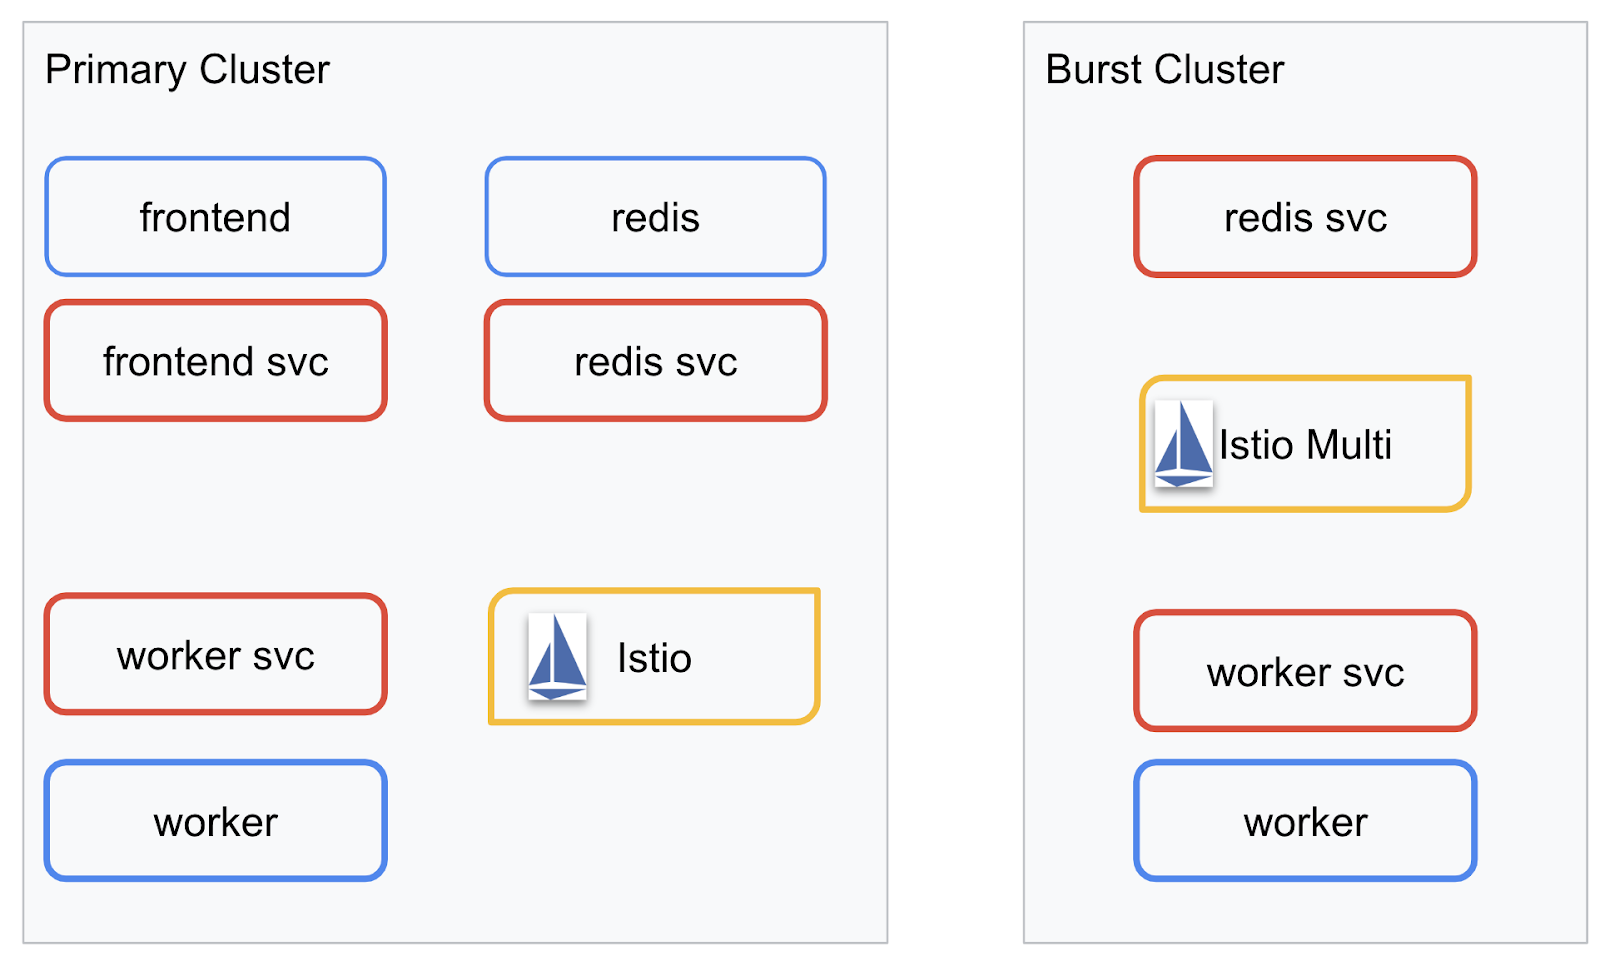
Notice how the burst cluster still has a service for Redis deployed to it even though there is no Deployment for Redis in the cluster. We need to have this service in the cluster so Kubernetes DNS can resolve the request, but when the request is actually made, the Istio Proxy will re-route the request to the Redis deployment in the primary cluster.
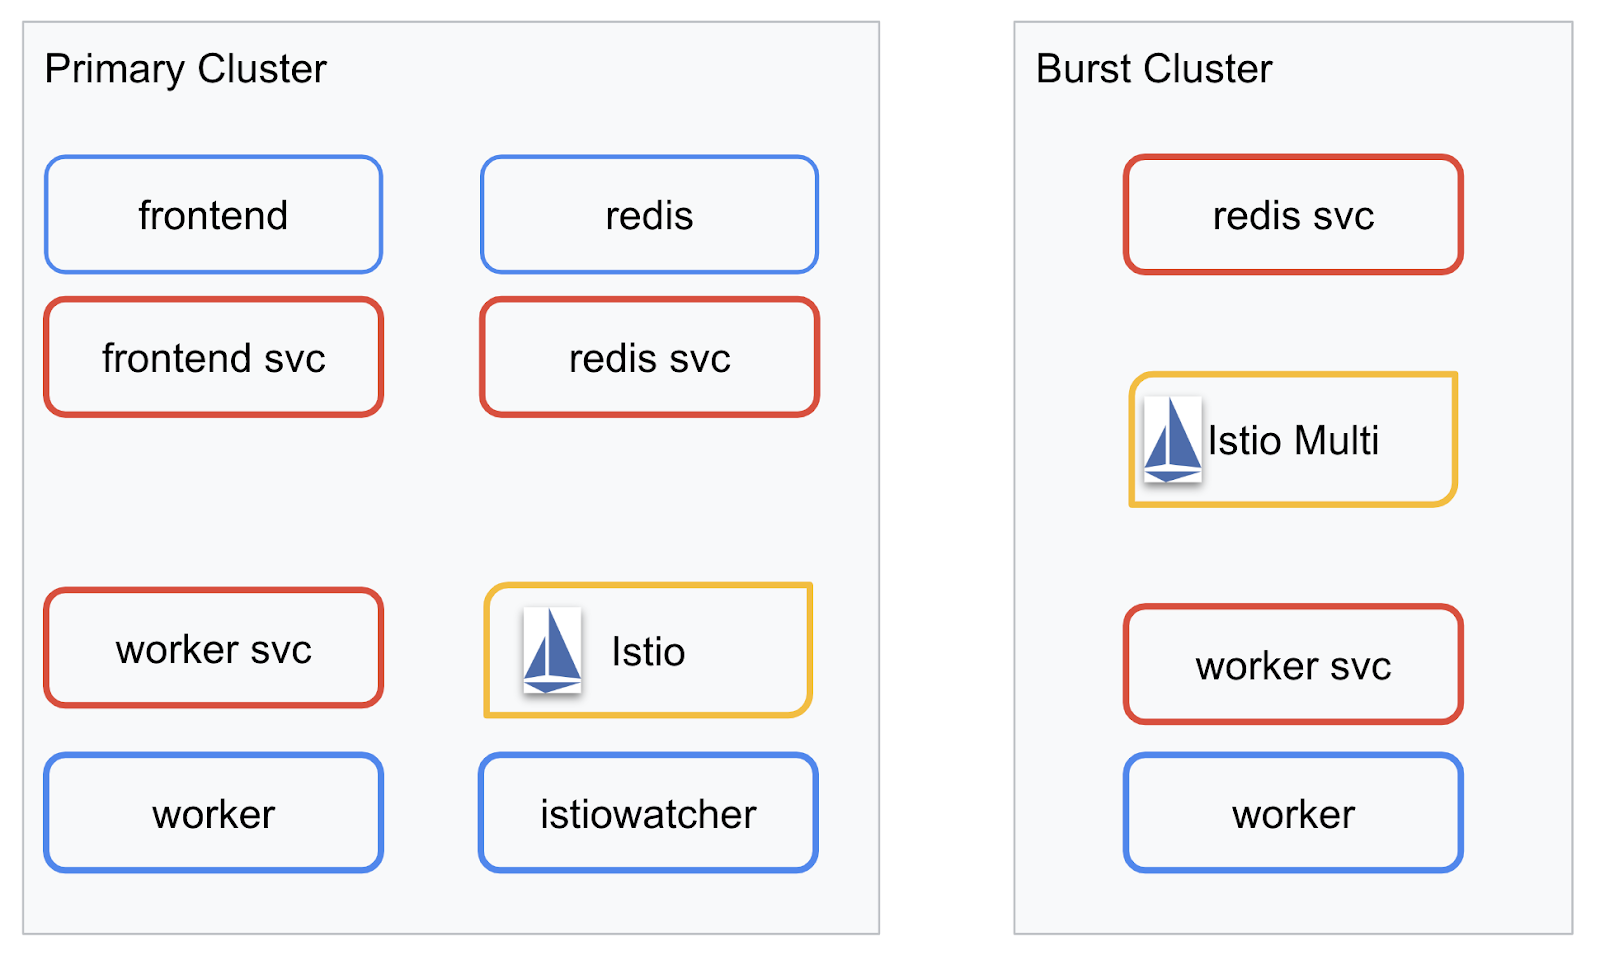
The final application will have an additional Deployment running in the primary cluster named istiowatcher. This is what will allow us to dynamically reroute traffic to the burst automatically when our traffic goes over a certain threshold.
9. Create Application Deployment Files
We need to create a set of Kubernetes manifests to deploy our application
Change into the root directory of the project and make a new folder called kubernetes
mkdir ${proj}/kubernetes && cd ${proj}/kubernetes
Write frontend.yaml
This will create both a Kubernetes Deployment and Service to access our frontend image.
Insert the following into frontend.yaml.
apiVersion: extensions/v1beta1
kind: Deployment
metadata:
  name: frontend-deployment
  labels:
    app: frontend
spec:
  replicas: 1
  selector:
    matchLabels:
      app: frontend
  template:
    metadata:
      labels:
        app: frontend
    spec:
      containers:
      - name: frontend
        image: gcr.io/istio-burst-workshop/frontend
        ports:
        - containerPort: 8080
        readinessProbe:
            initialDelaySeconds: 10
            httpGet:
              path: "/_healthz"
              port: 8080
              httpHeaders:
              - name: "Cookie"
                value: "istio_session-id=x-readiness-probe"
        livenessProbe:
          initialDelaySeconds: 10
          httpGet:
            path: "/"
            port: 8080
            httpHeaders:
            - name: "Cookie"
              value: "istio_session-id=x-liveness-probe"
        env:
        - name: PORT
          value: "8080"
        - name: PROCESSOR_URL
          value: "http://worker-service"
        - name: REDIS_URL
          value: "redis-cache-service:6379"
---
apiVersion: v1
kind: Service
metadata:
  name: frontend-service
spec:
  type: ClusterIP
  selector:
    app: frontend
  ports:
  - name: http
    port: 80
    targetPort: 8080
Key things to notice in the Deployment
- We have specified the port the application will run on to be
8080 - We have set the address for the worker to be "
http://worker-service" and will use Kubernetes built in DNS feature to resolve the resulting service - We have set the address for our
REDIS_URLto be "redis-cache-service:6379" and will use Kubernetes built in DNS feature to resolve the resulting IP addresses. - We have also set
livenessandreadinessprobes to the container to help inform Kubernetes when the container is up and running.
Write worker-service.yaml
We are writing the Kubernetes service definition in a separate file than the Deployment definition as we will be re-using this service across multiple clusters, but will be writing a different Deployment for each cluster.
Insert the following in worker-service.yaml
apiVersion: v1
kind: Service
metadata:
 name: worker-service
spec:
 type: ClusterIP
 selector:
   app: worker
 ports:
 - name: http
   port: 80
   targetPort: 8081
Write worker-primary.yaml
This will be the deployment of worker we will push to the primary cluster.
Insert the following into worker-primary.yaml.
apiVersion: extensions/v1beta1
kind: Deployment
metadata:
 name: worker-deployment
 labels:
   app: worker
spec:
 replicas: 1
 selector:
   matchLabels:
     app: worker
 template:
   metadata:
     labels:
       app: worker
       cluster-type: primary-cluster
   spec:
     containers:
     - name: worker
       image: gcr.io/istio-burst-workshop/worker
       imagePullPolicy: Always
       ports:
       - containerPort: 8081
       readinessProbe:
           initialDelaySeconds: 10
           httpGet:
             path: "/_healthz"
             port: 8081
             httpHeaders:
             - name: "Cookie"
               value: "istio_session-id=x-readiness-probe"
       livenessProbe:
         initialDelaySeconds: 10
         httpGet:
           path: "/"
           port: 8081
           httpHeaders:
           - name: "Cookie"
             value: "istio_session-id=x-liveness-probe"
       env:
       - name: PORT
         value: "8081"
       - name: REDIS_URL
         value: "redis-cache-service:6379"
Notice in this, we are following the same pattern of providing liveness and readiness probes as well as specifying the PORT and REDIS_URL environment variables for our application to use.
Another thing to note in this deployment is the lack of the PREFIX environment variable. This means that our calculation results will be raw hashes (nothing prefixing them).
The final key point of this deployment is the cluster-type: primary-cluster label. We will be using that later when we do Traffic Routing on Istio Multicluster
Write redis.yaml
The communication from our worker back to the frontend is through a Redis channel, and as such we need to deploy a Redis application into our cluster.
Insert the following to redis.yaml
apiVersion: extensions/v1beta1
kind: Deployment
metadata:
 name: redis-cache
spec:
 template:
   metadata:
     labels:
       app: redis-cache
   spec:
     containers:
     - name: redis
       image: redis:alpine
       ports:
       - containerPort: 6379
       readinessProbe:
         periodSeconds: 5
         tcpSocket:
           port: 6379
       livenessProbe:
         periodSeconds: 5
         tcpSocket:
           port: 6379
       volumeMounts:
       - mountPath: /data
         name: redis-data
       resources:
         limits:
           memory: 256Mi
           cpu: 125m
         requests:
           cpu: 70m
           memory: 200Mi
     volumes:
     - name: redis-data
       emptyDir: {}
This is a semi standard deployment of a Redis application. It stands up a container based on the redis:alpine image, exposes the appropriate ports and sets sensible resource limits.
Write redis-service.yaml
We need a Kubernetes Service to communicate with our Redis application
Insert the following to redis-service.yaml
apiVersion: v1
kind: Service
metadata:
 name: redis-cache-service
spec:
 type: ClusterIP
 selector:
   app: redis-cache
 ports:
 - port: 6379
   targetPort: 6379
This provides service named redis-cache-service to access our Redis Deployment.
10. Deploy the Application
With our images pushed to GCR and our Kubernetes manifests written, this is a good point to deploy our application and see how it works!
Run the following commands to deploy the application
- Ensure we are in the right cluster
kubectx primary
- Deploy Redis Cache
kubectl apply -f redis.yaml
- Deploy Redis Service
kubectl apply -f redis-service.yaml
- Deploy frontend
kubectl apply -f frontend.yaml
- Deploy Worker
kubectl apply -f worker-primary.yaml
- Deploy Worker Service
kubectl apply -f worker-service.yaml
We've deployed our application to GKE. Congrats!
Test
Wait for the pods to come up online
kubectl get pods -w
Once all the pods are all "Running" hit Ctrl + C
NAME                                   READY     STATUS    RESTARTS   AGE
frontend-deployment-695d95fbf7-76sd8   1/1       Running   0          2m
redis-cache-7475999bf5-nxj8x           1/1       Running   0          2m
worker-deployment-5b9cf9956d-g975p     1/1       Running   0          2m
You'll notice that we did not expose our frontend via a LoadBalancer. That's because later we'll be accessing the application via Istio. To test that everything is up and running, we'll use kubectl port-forward. Run the following command to forward port 8080 on your local (or Cloud Shell) machine to port 8080 running the frontend deployment.
kubectl port-forward \
$(kubectl get pods -l app=frontend -o jsonpath='{.items[0].metadata.name}') \
8080:8080
If you are running locally: open a web browser and navigate to http://localhost:8080
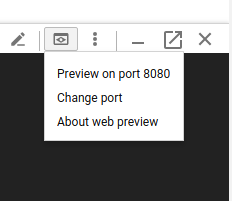
If you are running in Cloud Shell: click on the "Web Preview" button and select "Preview on port 8080"
You should see the frontend! And if you enter a number in the "frequency" box you should see hashes start appearing
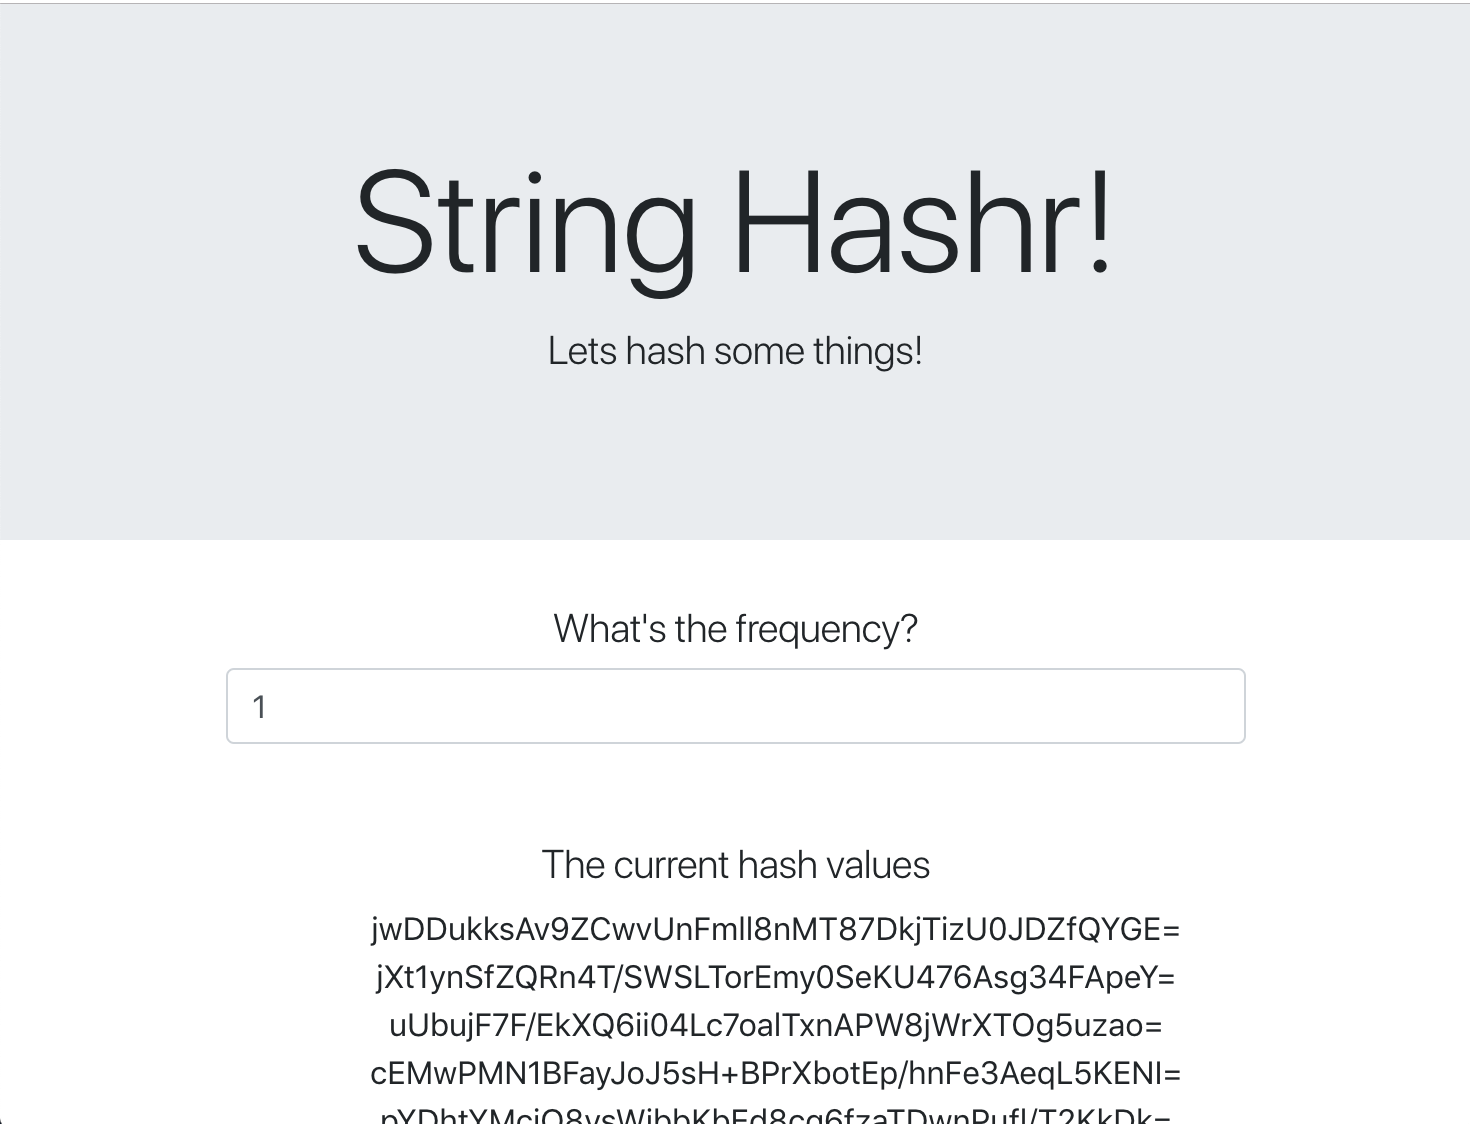
Congrats; it's all up and running!
Hit Ctrl+C to stop forwarding the port.
11. Cleanup Deployed Application
We are going to apply Istio to our cluster and then redeploy our application, so let's clean up our current application first.
Run the following commands to delete all the Deployments and services you just created
- Delete
redis-cache-service
kubectl delete -f redis-service.yaml
- Delete
redis
kubectl delete -f redis.yaml
- Delete
frontend
kubectl delete -f frontend.yaml
- Delete
worker
kubectl delete -f worker-primary.yaml
- Delete
worker-service
kubectl delete -f worker-service.yaml
12. Install Istio on primary Cluster
Get Istio
Istio's releases are hosted on GitHub. The following commands will download the 1.0.0 version of istio and unpack it.
- Change to the root of your project
cd ${proj}
- Download the archive
curl -LO https://github.com/istio/istio/releases/download/1.0.0/istio-1.0.0-linux.tar.gz
- Extract and remove the archive
tar xzf istio-1.0.0-linux.tar.gz && rm istio-1.0.0-linux.tar.gz
Create Istio Template
Running the following Helm command will create the template to install Istio to your cluster.
helm template istio-1.0.0/install/kubernetes/helm/istio \
--name istio --namespace istio-system \
--set prometheus.enabled=true \
--set servicegraph.enabled=true  > istio-primary.yaml
This creates a file named istio-primary.yaml in your current directory that contains all the definitions and specifications needed to deploy and run Istio.
Notice the two --set parameters. These add Prometheus and ServiceGraph support to the Istio system. We will be using the Prometheus service later on in the lab.
Deploy Istio
To deploy istio we first need to create a namespace called istio-system that the Istio Deployments and Services can run in.
kubectl create namespace istio-system
And finally apply the istio-primary.yaml file we created with Helm
kubectl apply -f istio-primary.yaml
Label default Namespace
Istio works by injecting a sidecar proxy service into each of your Deployments. This is done on an opt-in basis so we need to label our default namespace with istio-injection=enabled so Istio can automatically inject the sidecar for us.
kubectl label namespace default istio-injection=enabled
Congrats! We have a cluster up and running with Istio ready for us to deploy our application!
13. Deploy Our Application with Istio Traffic Management
Create Istio Traffic Management Config Files
Istio works similarly to Kubernetes as it uses yaml files for configuration. In that vein, we need to create a set of files tell Istio how to expose and route our traffic.
Create a directory named istio-manifests and change into it
mkdir ${proj}/istio-manifests && cd ${proj}/istio-manifests
Write frontend-gateway.yaml
This file will expose our Kubernetes cluster in a manner similar to a GKE LoadBalancer and will route all incoming traffic to our frontend service.
Create a file called frontend-gateway.yaml and insert the following.
apiVersion: networking.istio.io/v1alpha3
kind: Gateway
metadata:
 name: frontend-gateway
spec:
 selector:
   istio: ingressgateway # use Istio default gateway implementation
 servers:
 - port:
     number: 80
     name: http
     protocol: HTTP
   hosts:
   - "*"
---
apiVersion: networking.istio.io/v1alpha3
kind: VirtualService
metadata:
 name: frontend-ingress-virtual-service
spec:
 hosts:
 - "*"
 gateways:
 - frontend-gateway
 http:
 - route:
   - destination:
       host: frontend-service
       port:
         number: 80
Write redis-virtualservice.yaml
Create a file named redis-virtualservice.yaml and insert the following
apiVersion: networking.istio.io/v1alpha3
kind: VirtualService
metadata:
 name: redis-virtual-service
spec:
 hosts:
 - redis-cache-service
 gateways:
 - mesh
 tcp:
 - route:
   - destination:
       host: redis-cache-service.default.svc.cluster.local
Write worker-virtualservice.yaml
Create a file named worker-virtualservice.yaml and insert the following
apiVersion: networking.istio.io/v1alpha3
kind: VirtualService
metadata:
 name: worker-virtual-service
spec:
 hosts:
 - worker-service
 gateways:
 - mesh
 http:
 - route:
   - destination:
       host: worker-service.default.svc.cluster.local
       port:
         number: 80
Deploy Istio Traffic Management Policies
Deploying the Istio policies is done in the same manner as other Kubernetes resources, with kubectl apply
- Apply our Gateway
kubectl apply -f frontend-gateway.yaml
- Apply our Redis VirtualService
kubectl apply -f redis-virtualservice.yaml
- Apply our Worker VirtualService
kubectl apply -f worker-virtualservice.yaml
Deploy Application
- Change back to our
kubernetesdirectory
cd ${proj}/kubernetes
- Deploy Redis Cache
kubectl apply -f redis.yaml
- Deploy Redis Service
kubectl apply -f redis-service.yaml
- Deploy frontend
kubectl apply -f frontend.yaml
- Deploy Worker
kubectl apply -f worker-primary.yaml
- Deploy Worker Service
kubectl apply -f worker-service.yaml
Verify
At this point we have re-deployed our application on a cluster with Istio and traffic management policies.
Let's wait for all of our workloads to come online
Once they are all online, get the IngressGateway we configured in frontend-ingressgateway.yaml
$ kubectl -n istio-system get svc istio-ingressgateway
NAME                   TYPE           CLUSTER-IP    EXTERNAL-IP     PORT(S)                                                                                                     AGE
istio-ingressgateway   LoadBalancer   10.36.3.112   35.199.158.10   80:31380/TCP,
Either browse to the <EXTERNAL-IP> address, or curl it and you should see the frontend!
$ curl 35.199.158.10
<!doctype html>
<html>

<head>
    <title>String Hashr</title>
    <!-- Bootstrap -->
...
14. Install Istio On "burst" Cluster
We've been spending a lot of time setting up and deploying on our primary cluster, but we have another whole cluster to deploy to!
In this section we'll need to grab configuration variables across both our clusters so pay close attention to which cluster we are pointed to for each command.
Create the Istio Remote Manifest
Much like when we deployed Istio to the primary cluster, we are going to use Helm to template out our deployment of istio remote to the burst cluster. Before we can do so however, we need to get some information about our primary cluster
Gather primary cluster information
Change to primary cluster
kubectx primary
The following commands retrieve the IP addresses of various pods in the primary cluster. These are used by Istio Remote to communicate back with the primary cluster.
export PILOT_POD_IP=$(kubectl -n istio-system get pod -l istio=pilot -o jsonpath='{.items[0].status.podIP}')
export POLICY_POD_IP=$(kubectl -n istio-system get pod -l istio-mixer-type=policy -o jsonpath='{.items[0].status.podIP}')
export STATSD_POD_IP=$(kubectl -n istio-system get pod -l istio=statsd-prom-bridge -o jsonpath='{.items[0].status.podIP}')
export TELEMETRY_POD_IP=$(kubectl -n istio-system get pod -l istio-mixer-type=telemetry -o jsonpath='{.items[0].status.podIP}')
export ZIPKIN_POD_IP=$(kubectl -n istio-system get pod -l app=jaeger -o jsonpath='{range .items[*]}{.status.podIP}{end}')
Create Remote Template
Now we will use helm to create a file named istio-remote-burst.yaml which we can then deploy to the burst cluster.
Change to project root
cd $proj
helm template istio-1.0.0/install/kubernetes/helm/istio-remote --namespace istio-system \
--name istio-remote \
--set global.remotePilotAddress=${PILOT_POD_IP} \
--set global.remotePolicyAddress=${POLICY_POD_IP} \
--set global.remoteTelemetryAddress=${TELEMETRY_POD_IP} \
--set global.proxy.envoyStatsd.enabled=true \
--set global.proxy.envoyStatsd.host=${STATSD_POD_IP} \
--set global.remoteZipkinAddress=${ZIPKIN_POD_IP} > istio-remote-burst.yaml
Install Istio Remote on the burst Cluster
To install Istio on our burst cluster, we need to follow the same steps as when installing on the primary cluster, but we need to use the istio-remote-burst.yaml file instead.
Change kubecontext to burst
kubectx burst
Create istio-system namespace
kubectl create ns istio-system
Apply istio-burst.yaml
kubectl apply -f istio-remote-burst.yaml
Label default namespace
Once again, we need to label the default namespace so that the proxy can be automatically injected.
kubectl label namespace default istio-injection=enabled
Congrats! At this point we have set up Istio Remote on the burst cluster. At this point, however, the clusters are still unable to communicate. We need to generate a kubeconfig file for the burst cluster that we can deploy to the primary cluster to link them together.
Create kubeconfig for "burst" cluster
Change to burst cluster
kubectx burst
Set up environment
We need to gather some information about the cluster in order to create a kubeconfig file for it.
- Get the name of the cluster
CLUSTER_NAME=$(kubectl config view --minify=true -o "jsonpath={.clusters[].name}")
- Get the cluster server name
SERVER=$(kubectl config view --minify=true -o "jsonpath={.clusters[].cluster.server}")
- Get the name of the secret for the
istio-multiservice account Certificate Authority
SECRET_NAME=$(kubectl get sa istio-multi -n istio-system -o jsonpath='{.secrets[].name}')
- Get the Certificate Authority data stored in the previous secret
CA_DATA=$(kubectl get secret ${SECRET_NAME} -n istio-system -o "jsonpath={.data['ca\.crt']}")
- Get the token stored in the previous secret
TOKEN=$(kubectl get secret ${SECRET_NAME} -n istio-system -o "jsonpath={.data['token']}" | base64 --decode)
Create kubeconfig file
With all those environment variables set, we need to create our kubeconfig file
cat <<EOF > burst-kubeconfig
apiVersion: v1
clusters:
   - cluster:
       certificate-authority-data: ${CA_DATA}
       server: ${SERVER}
     name: ${CLUSTER_NAME}
contexts:
   - context:
       cluster: ${CLUSTER_NAME}
       user: ${CLUSTER_NAME}
     name: ${CLUSTER_NAME}
current-context: ${CLUSTER_NAME}
kind: Config
preferences: {}
users:
   - name: ${CLUSTER_NAME}
     user:
       token: ${TOKEN}
EOF
This will make a new file called burst-kubeconfig in your current directory which can be used by the primary cluster to authenticate and manage the burst cluster.
Change back to the primary cluster
kubectx primary
Apply the kubeconfig for "burst", by creating a secret and labeling it
kubectl create secret generic burst-kubeconfig --from-file burst-kubeconfig -n istio-system
Label the secret so that Istio knows to use it for multicluster authentication
kubectl label secret burst-kubeconfig istio/multiCluster=true -n istio-system
Congrats! We have both clusters authenticated and communicating with each other via Istio Multicluster. Let's deploy our application Cross-Cluster
15. Deploy a Cross-Cluster Application
Create Deployments
Change to the kubernetes directory
cd ${proj}/kubernetes
Create worker deployment for "burst" cluster: worker-burst.yaml
Create a file named worker-burst.yaml and insert the following into it:
apiVersion: extensions/v1beta1
kind: Deployment
metadata:
  name: worker-deployment
  labels:
    app: worker
spec:
  replicas: 1
  selector:
    matchLabels:
      app: worker
  template:
    metadata:
      labels:
        app: worker
        cluster-type: burst-cluster
    spec:
      containers:
      - name: worker
        image: gcr.io/istio-burst-workshop/worker
        imagePullPolicy: Always
        ports:
        - containerPort: 8081
        readinessProbe:
            initialDelaySeconds: 10
            httpGet:
              path: "/_healthz"
              port: 8081
              httpHeaders:
              - name: "Cookie"
                value: "istio_session-id=x-readiness-probe"
        livenessProbe:
          initialDelaySeconds: 10
          httpGet:
            path: "/"
            port: 8081
            httpHeaders:
            - name: "Cookie"
              value: "istio_session-id=x-liveness-probe"
        env:
        - name: PORT
          value: "8081"
        - name: REDIS_URL
          value: "redis-cache-service:6379"
        - name: PREFIX
          value: "bursty-"
Notice how this is almost identical to the worker-primary.yaml we created earlier. There are two key differences.
The first key difference is we have added the PREFIX environment variable with value "bursty-"
env:
- name: PORT
  value: "8081"
- name: REDIS_URL
  value: "redis-cache-service:6379"
- name: PREFIX
  value: "bursty-"
This means that our worker in the burst cluster will prefix all the hashes it sends with "bursty-" we can use this to know that our application is truly cross-cluster.
The second key difference is that we have changed the cluster-type label on this deployment from primary-cluster to burst-cluster
labels:
  app: worker
  cluster-type: burst-cluster
We will be using this label later when we update our VirtualService.
Modify Istio Services
Right now our Istio services are not taking advantage of both our deployments. 100% of our traffic is being routed to the "primary" cluster. Let's change that.
Change to our istio-manifests directory
cd ${proj}/istio-manifests
Edit worker-virtualservice.yaml to include DestinationRules
apiVersion: networking.istio.io/v1alpha3
kind: VirtualService
metadata:
  name: worker-virtual-service
spec:
  hosts:
  - worker-service
  gateways:
  - mesh
  http:
  - route:
    - destination:
        host: worker-service.default.svc.cluster.local
        subset: primary
        port:
          number: 80
      weight: 50
    - destination:
        host: worker-service.default.svc.cluster.local
        subset: burst
        port:
          number: 80
      weight: 50
---
apiVersion: networking.istio.io/v1alpha3
kind: DestinationRule
metadata:
  name: worker-destination-rule
spec:
  host: worker-service
  trafficPolicy:
    loadBalancer:
      simple: RANDOM
  subsets:
  - name: primary
    labels:
      cluster-type: primary-cluster
  - name: burst
    labels:
     cluster-type: burst-cluster
You can see we have added a second destination to our VirtualService. It still references the same host (worker-service.default.svc.cluster.local), but 50% of the traffic is being routed to the primary subset and the other 50% is routed to the burst subset.
We have defined the primary subset to be deployments who have the label cluster-type: primary-cluster and the burst subset the deployments who have the label cluster-type: burst-cluster.
This effectively splits our traffic 50/50 between the two clusters.
Deploy to Cluster
Deploy redis-service.yaml to burst cluster
Change to burst kubeconfig
kubectx burst
Change to our project root
cd ${proj}
Then deploy
Deploy redis-service.yaml to the burst cluster
kubectl apply -f kubernetes/redis-service.yaml
Deploy worker-burst.yaml to the burst cluster
kubectl apply -f kubernetes/worker-burst.yaml
Deploy worker-service.yaml to the burst cluster
kubectl apply -f kubernetes/worker-service.yaml
Apply Istio VirtualServices
Change to primary kubeconfig
kubectx primary
Then Deploy
kubectl apply -f istio-manifests/worker-virtualservice.yaml
Verify It Works
To verify it works, browse to your Istio Ingress point, and notice how about 50% of the hashes are prefixed with "burst-".
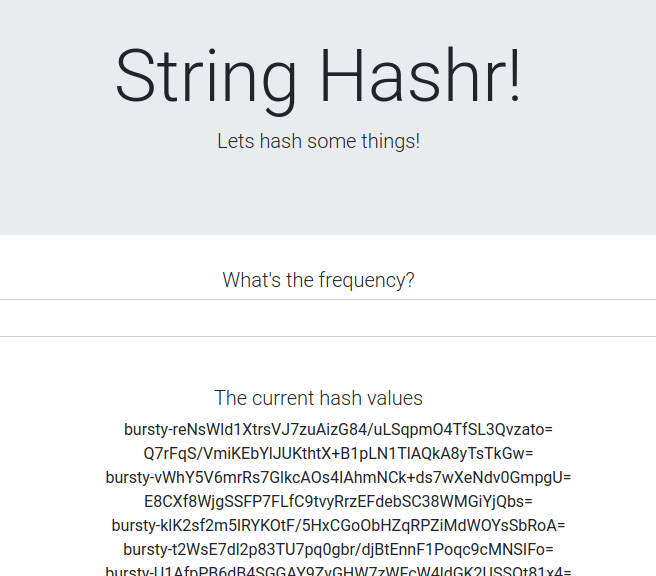
This means we are successfully talking cross cluster! Try changing the weights on the different services and applying the worker-virtualservice.yaml file. This is a great way to balance traffic between clusters, but what if we can do it automatically?
16. Leveraging Prometheus Metrics
An Introduction to Prometheus
Prometheus, is an open-source systems monitoring and alerting toolkit originally built at SoundCloud. It maintains a multi-dimensional data model with time series data identified by metric name and key/value pairs.
For reference, here is the Prometheus Architecture diagram:
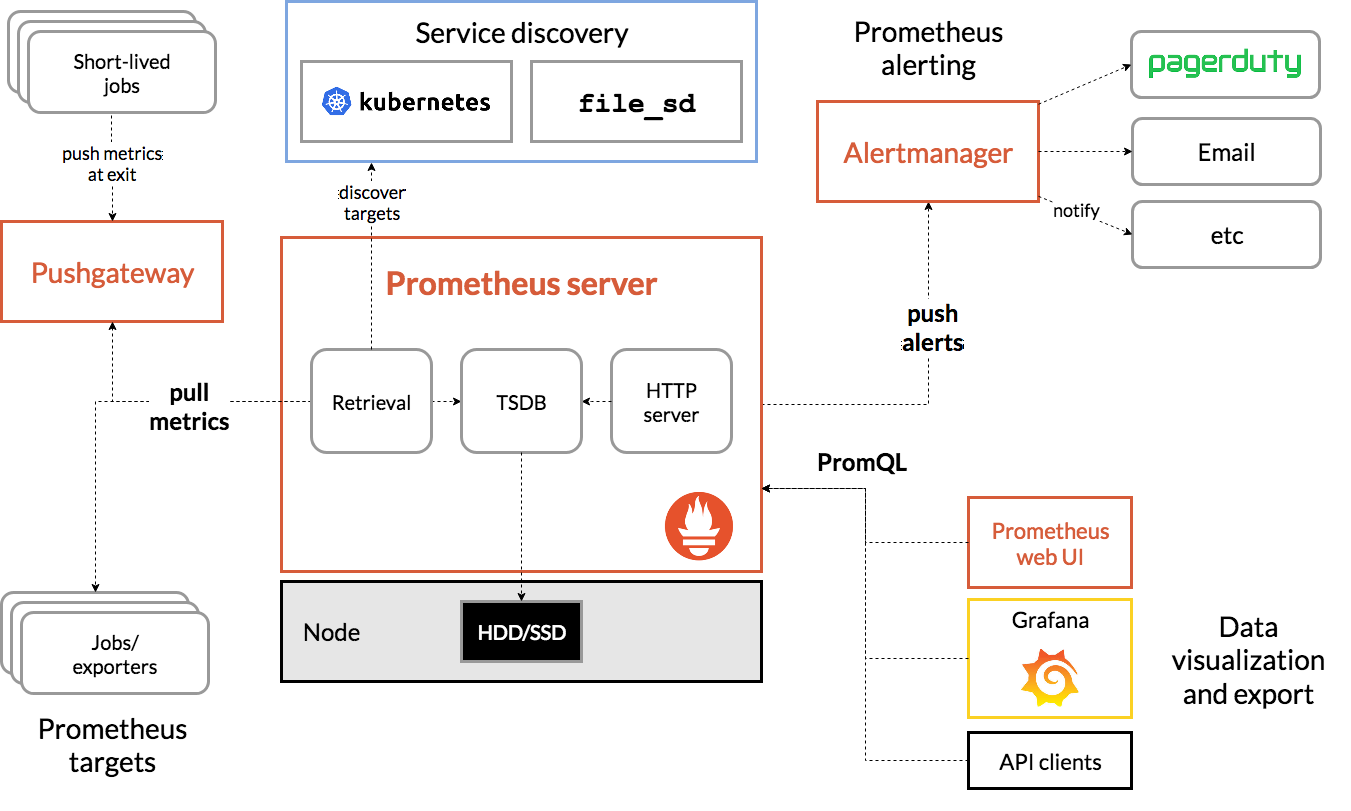
Istio, when deployed with Prometheus, automatically reports various metrics to the Prometheus server. We can use these metrics to manage our clusters on the fly.
Exploring our Prometheus Metrics
To get started, we need to expose the Prometheus Deployment.
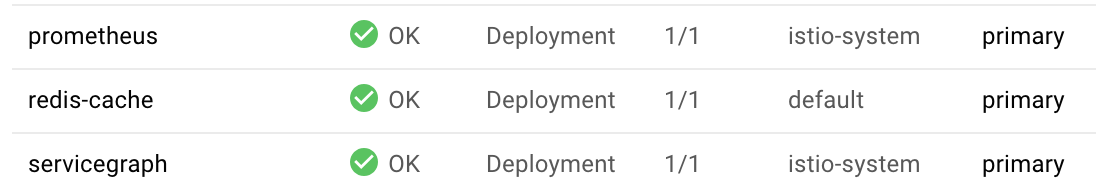
Navigate to the Workloads tab in GKE, drill down to the "prometheus" workload.
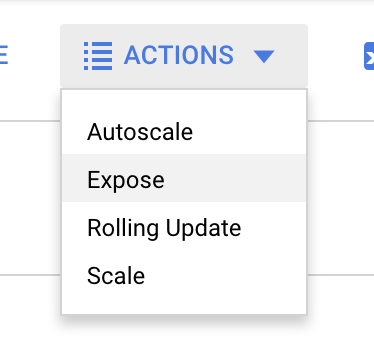
Once you are viewing the details of the deployment, go to Actions -> Expose.
Choose to forward to port 9090, and type "Load balancer"
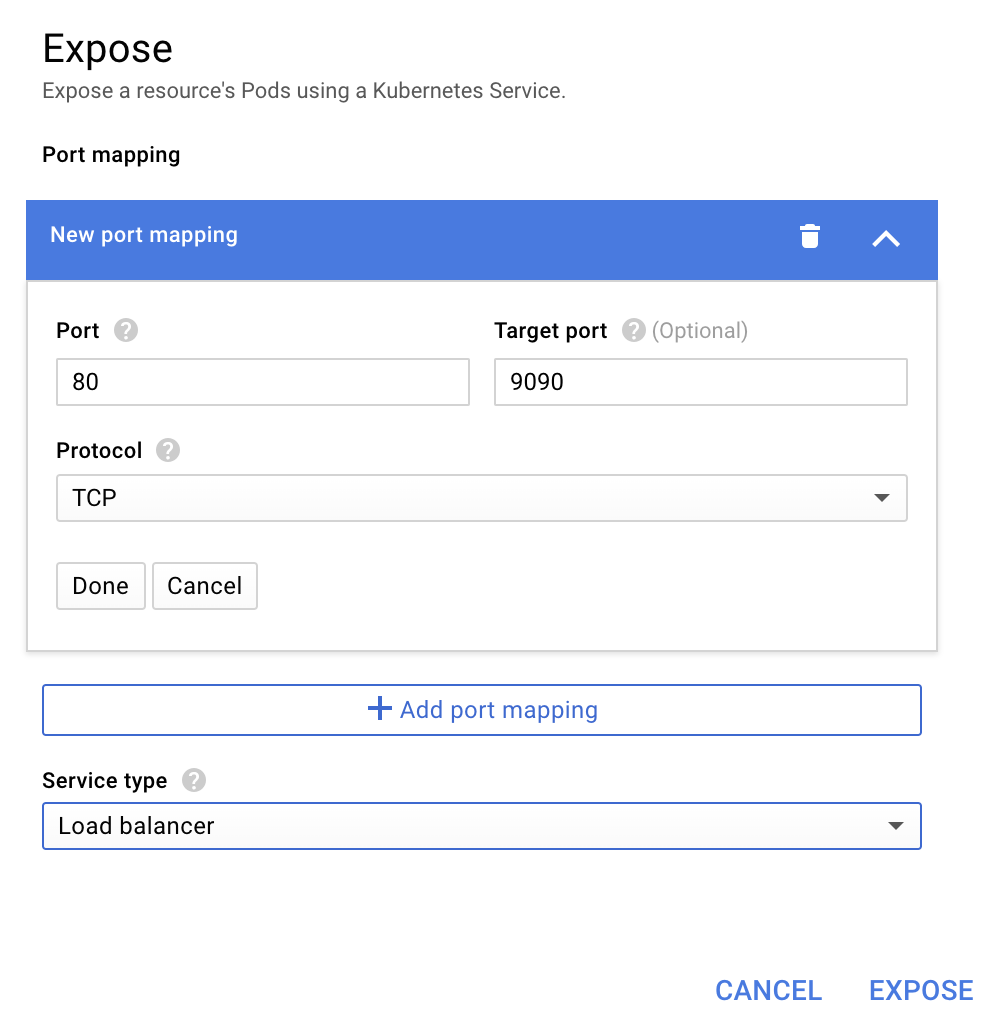
And choose "Expose"
This will create a Service on a publicly accessible IP address we can use to explore our Prometheus Metrics
Wait for the endpoint to become operational, and once so click, on the IP address next to "External endpoints" 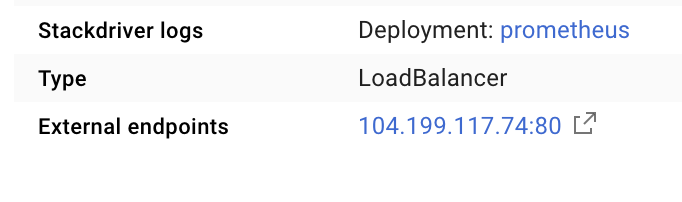
You should now be looking at the Prometheus UI.
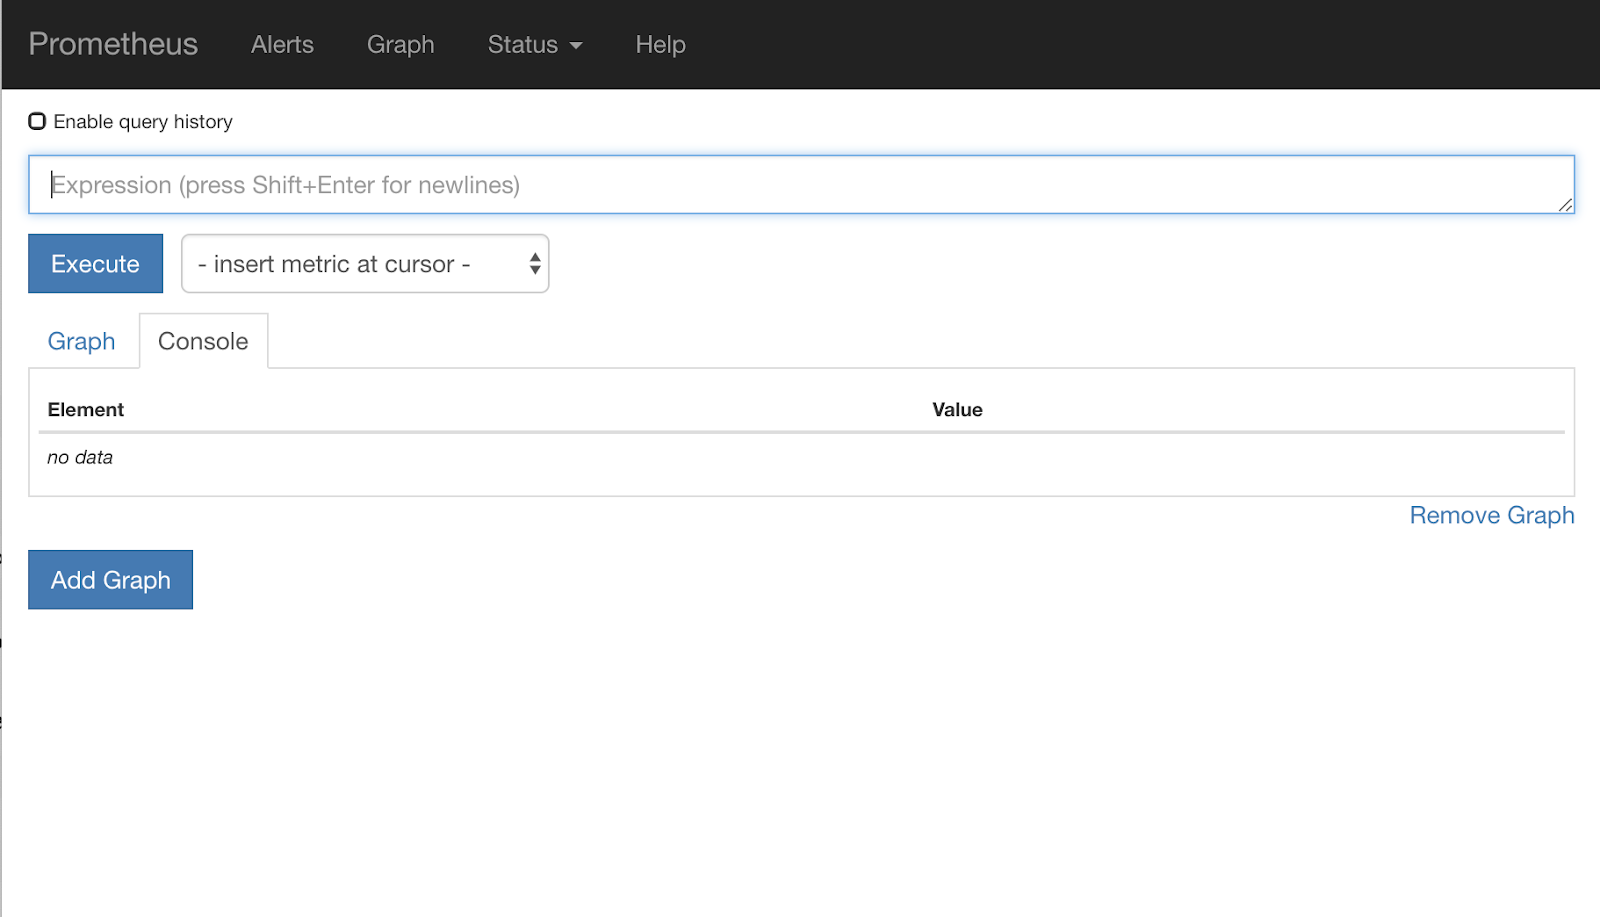
Prometheus provides enough metrics to be its own workshop. For now though, we will begin by exploring the istio_requests_total metric.
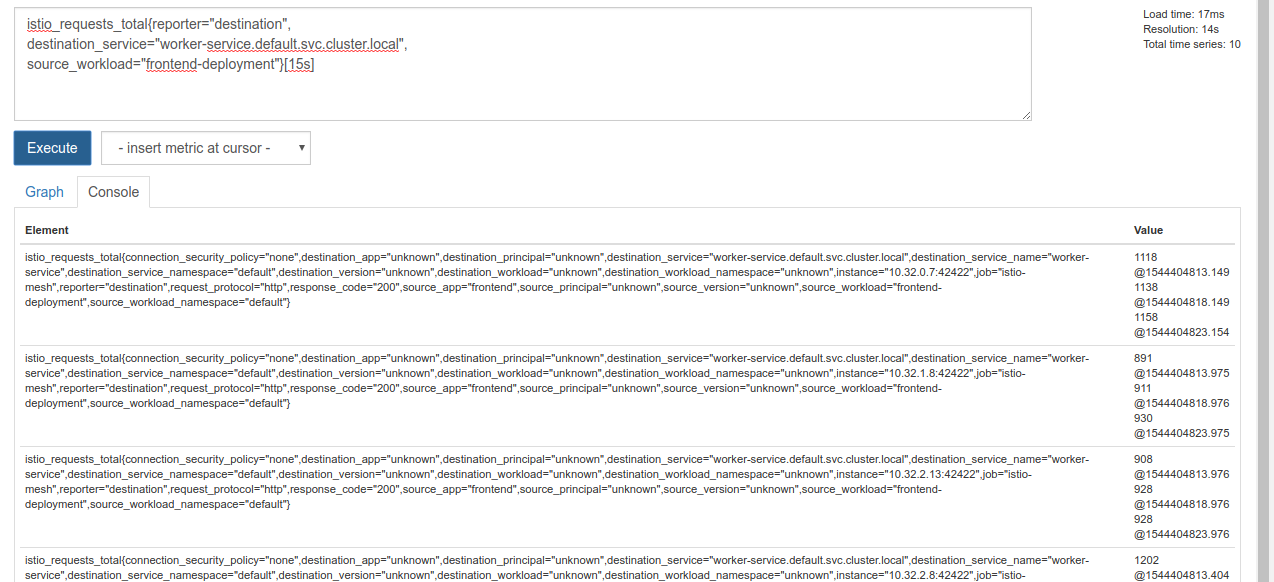
Executing that query returns a bunch of data. It is metrics on all the requests that are going through the Istio service mesh, and that's a lot! We'll change our expression to filter down to what we are really interested in:
Requests where the destination service is worker-service.default.svc.cluster.local, and whose source is frontend-deployment limited to the last 15 seconds
That query looks like:
istio_requests_total{reporter="destination",
destination_service="worker-service.default.svc.cluster.local",
source_workload="frontend-deployment"}[15s]
And gives us a much more manageable set of data to work with
But is still a little dense. We want to know the requests per second, not all of the requests.
To get that, we can use the builtin rate function
rate(istio_requests_total{reporter="destination",
destination_service="worker-service.default.svc.cluster.local",
source_workload="frontend-deployment"}[15s])
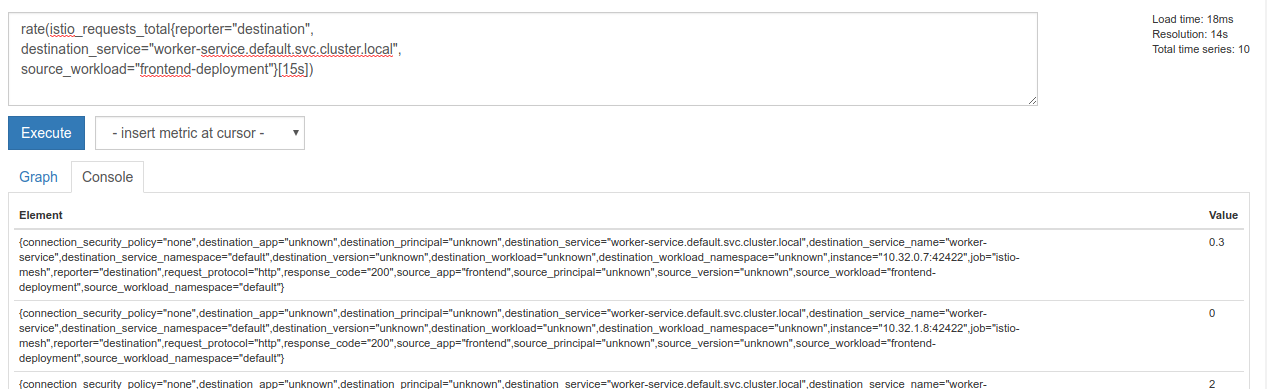
This is getting us closer, but we need to reduce those metrics a bit further into a logical group.
To do this we can use the sum and by keywords to group and sum our results
sum(rate(istio_requests_total{reporter="destination",
destination_service="worker-service.default.svc.cluster.local",
source_workload="frontend-deployment"}[15s])) by (source_workload,
source_app, destination_service)
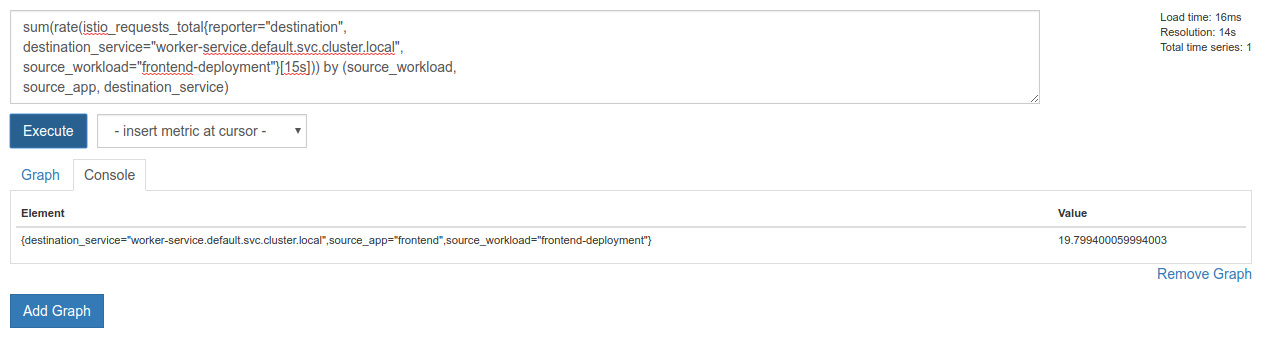
Perfect! We can get the exact metrics we need out of Prometheus.
Our final Prometheus Query
With all we learned, the final query we need to ask Prometheus is
sum(rate(istio_requests_total{reporter="destination",
destination_service="worker-service.default.svc.cluster.local",
source_workload="frontend-deployment"}[15s])) by (source_workload,
source_app, destination_service)
Now we can use their HTTP API to get the metric.
We can query their api with our query by making an http GET request like so. Replace <prometheus-ip-here>
curl http://<prometheus-ip-here>/api/v1/query?query=sum\(rate\(istio_requests_total%7Breporter%3D%22destination%22%2C%0Adestination_service%3D%22worker-service.default.svc.cluster.local%22%2C%0Asource_workload%3D%22frontend-deployment%22%7D%5B15s%5D\)\)%20by%20\(source_workload%2C%0Asource_app%2C%20destination_service\)
Here is an example response:
{
    "status": "success",
    "data": {
        "resultType": "vector",
        "result": [
            {
                "metric": {
                    "destination_service": "worker-service.default.svc.cluster.local",
                    "source_app": "frontend",
                    "source_workload": "frontend-deployment"
                },
                "value": [
                    1544404907.503,
                    "18.892886390062788"
                ]
            }
        ]
    }
}
Now, we can extract our metric value from the JSON
Cleanup
We need to delete the Service we just used to expose Prometheus. In the Google Cloud Console, go to the top of the service we just created and click "Delete"
Next Steps:
Having come up with a way to discover how traffic is moving through the cluster, and at what rate, our next step is to write a small binary that periodically queries prometheus, and if the requests per second to worker get above a certain threshold, apply different destination weights on our worker virtual service to send all traffic to the burst cluster. Once the requests per second gets below a lower threshold, send all traffic back to primary.
17. Create a Cross Cluster Burst
Setup
Set all traffic for worker-service to the primary cluster
We will consider all traffic destined for worker-service being routed to the primary cluster to be the "default" state of our application
Edit $proj/istio-manifests/worker-virtualservice.yaml to look like the following
apiVersion: networking.istio.io/v1alpha3
kind: VirtualService
metadata:
  name: worker-virtual-service
spec:
  hosts:
  - worker-service
  gateways:
  - mesh
  http:
  - route:
    - destination:
        host: worker-service.default.svc.cluster.local
        subset: primary
        port:
          number: 80
      weight: 100
    - destination:
        host: worker-service.default.svc.cluster.local
        subset: burst
        port:
          number: 80
      weight: 0
---
apiVersion: networking.istio.io/v1alpha3
kind: DestinationRule
metadata:
  name: worker-destination-rule
spec:
  host: worker-service
  trafficPolicy:
    loadBalancer:
      simple: RANDOM
  subsets:
  - name: primary
    labels:
      cluster-type: primary-cluster
  - name: burst
    labels:
     cluster-type: burst-cluster
Ensure you are connected to the primary cluster
kubectx primary
Apply istio-manifests/worker-virtualservice.yaml
kubectl apply -f istio-manifests/worker-virtualservice.yaml
Write istiowatcher daemon
We'll be using Go to write this service for its speed and portability. The overall flow of the application will be to start up and every second, query prometheus,
Make a new directory in src named istiowatcher
mkdir -p ${proj}/src/istiowatcher && cd ${proj}/src/istiowatcher
We will be calling istioctl from within our container in order to manipulate the Istio control plane from within the cluster.
Write istiowatcher.go
Make a file in that directory named istiowatcher.go and insert the following into it
package main

import (
        "github.com/tidwall/gjson"
        "io/ioutil"
        "log"
        "net/http"
        "os/exec"
        "time"
)

func main() {
        //These are in requests per second
        var targetLow float64 = 10
        var targetHigh float64 = 15
        // This is for the ticker in milliseconds
        ticker := time.NewTicker(1000 * time.Millisecond)

        isBurst := false

        // Our prometheus query
        reqQuery := `/api/v1/query?query=sum(rate(istio_requests_total{reporter="destination",destination_service="worker-service.default.svc.cluster.local",source_workload="frontend-deployment"}[15s]))by(source_workload,source_app,destination_service)`

        for t := range ticker.C {
                log.Printf("Checking Prometheus at %v", t)

                // Check prometheus
                // Note that b/c we are querying over the past 5 minutes, we are getting a very SLOW ramp of our reqs/second
                // If we wanted this to be a little "snappier" we can scale it down to say 30s
                resp, err := http.Get("http://prometheus.istio-system.svc.cluster.local:9090" + reqQuery)
                if err != nil {
                        log.Printf("Error: %v", err)
                        continue
                }
                defer resp.Body.Close()
                body, _ := ioutil.ReadAll(resp.Body)

                val := gjson.Get(string(body), "data.result.0.value.1")
                log.Printf("Value: %v", val)

                currentReqPerSecond := val.Float()
                log.Printf("Reqs per second %f", currentReqPerSecond)

                if currentReqPerSecond > targetHigh && !isBurst {
                        applyIstio("burst.yaml")
                        log.Println("Entering burst mode")
                        isBurst = true
                } else if currentReqPerSecond < targetLow && isBurst {
                        applyIstio("natural.yaml")
                        log.Println("Returning to natural state.")
                        isBurst = false
                }
        }
}

func applyIstio(filename string) {
        cmd := exec.Command("istioctl", "replace", "-f", filename)
        if err := cmd.Run(); err != nil {
                log.Printf("Error hit applying istio manifests: %v", err)
        }
}
Write Dockerfile
Create a new file named Dockerfile and insert the following into it.
FROM golang:1.11.2-stretch as base

FROM base as builder

WORKDIR /workdir
RUN curl -LO https://github.com/istio/istio/releases/download/1.0.0/istio-1.0.0-linux.tar.gz
RUN tar xzf istio-1.0.0-linux.tar.gz
RUN cp istio-1.0.0/bin/istioctl ./istioctl

FROM base

WORKDIR /go/src/istiowatcher
COPY . .
COPY --from=builder /workdir/istioctl /usr/local/bin/istioctl

RUN go get -d -v ./...
RUN go install -v ./...

CMD ["istiowatcher"]
This multi-stage Dockerfile downloads and extracts the 1.0.0 release of Istio in the first stage. The second stage copies everything from our directory into the image, then copies istioctl from the build stage to /usr/local/bin (so it can be called by our application), gets the dependencies, compiles the code and sets the CMD to be "istiowatcher"
Write burst.yaml
This is the file istiowatcher will apply when the requests/second to worker from frontend exceeds 15.
Create a new file named burst.yaml and insert the following into it.
apiVersion: networking.istio.io/v1alpha3
kind: VirtualService
metadata:
 name: worker-virtual-service
spec:
 hosts:
 - worker-service
 gateways:
 - mesh
 http:
 - route:
   - destination:
       host: worker-service.default.svc.cluster.local
       subset: primary
       port:
         number: 80
     weight: 0
   - destination:
       host: worker-service.default.svc.cluster.local
       subset: burst
       port:
         number: 80
     weight:  100
Write natural.yaml
We will consider this the "natural" state we return to when the requests/second from frontend to worker falls below 10. In this state, 100% of the traffic is being routed to the primary cluster.
Create a new file named natural.yaml and insert the following into it
apiVersion: networking.istio.io/v1alpha3
kind: VirtualService
metadata:
 name: worker-virtual-service
spec:
 hosts:
 - worker-service
 gateways:
 - mesh
 http:
 - route:
   - destination:
       host: worker-service.default.svc.cluster.local
       subset: primary
       port:
         number: 80
     weight: 100
   - destination:
       host: worker-service.default.svc.cluster.local
       subset: burst
       port:
         number: 80
     weight: 0
Build and Push istiowatcher
Run the following to send the current directory to Google Could Build (GCB), which will build and tag the image in GCR.
gcloud builds submit -t gcr.io/${GCLOUD_PROJECT}/istiowatcher
Deploy istiowatcher
Change to our kubernetes directory
cd ${proj}/kubernetes/
Write a deployment file: istiowatcher.yaml
Create a file named istiowatcher.yaml and insert the following (Replace <your-project-id>).
apiVersion: extensions/v1beta1
kind: Deployment
metadata:
  name: istiowatcher-deployment
  labels:
    app: istiowatcher
spec:
  replicas: 1
  selector:
    matchLabels:
      app: istiowatcher
  template:
    metadata:
      labels:
        app: istiowatcher
    spec:
      serviceAccountName: istio-pilot-service-account
      automountServiceAccountToken: true
      containers:
      - name: istiowatcher
        image: gcr.io/<your-project-id>/istiowatcher
        imagePullPolicy: Always
Deploy
Ensure we are running in the primary cluster
kubectx primary
Deploy istiowatcher.yaml in the istio-system namespace
kubectl apply -n istio-system -f istiowatcher.yaml
Important to note is the serviceAccountName and automountServiceAccountToken directives in the yaml. This gives us the credentials needed to run istioctl from within the cluster.
We also need to deploy this within the istio-system namespace to ensure we have the credentials for the istio-pilot-service-account. (it doesn't exist in the default namespace).
Watch the traffic automatically switch over!
Now for the magic moment! Let's go to our frontend and pump up the req/second to 20
Notice it takes a few seconds, but we it ramps up to and all our hashes have "bursty-" prefixed!
This is because we are sampling prometheus over 15s range which makes our response time lag a bit. If we wanted a much tighter band we could change our query to prometheus to be 5s.
18. What's next?
Cleanup
You don't need to clean up if you're using a temporary account provided for this workshop.
You can delete your Kubernetes clusters, the firewall rule, and the images in GCR
gcloud container clusters delete primary --zone=us-west1-a
gcloud container clusters delete burst --zone=us-west1-a
gcloud compute firewall-rules delete istio-multicluster-test-pods
gcloud container images delete gcr.io/$GCLOUD_PROJECT/istiowatcher
Going Forward
- Attend some Istio Talks!
- Get the Cert: Build Your Next App With Kubernetes + Istio
- Keynote: Kubernetes, Istio, Knative: The New Open Cloud Stack - Aparna Sinha, Group Product Manager for Kubernetes, Google
- Tutorial: Using Istio - Lee Calcote & Girish Ranganathan, SolarWinds
- Istio - The Packet's-Eye View - Matt Turner, Tetrate
- Is Istio the Most Next Gen Next Gen Firewall Ever Created? - John Morello, Twistlock
- Read the Istio documentation
- Join the Istio Working Groups
- Follow @IstioMesh on Twitter