
1. 欢迎
感谢您参加 Google 的 Istio 多云突发 Codelab。本 Codelab 需要具备 Kubernetes、Node 和 Go 的初级实操经验。 所需条件
|
|

学习内容
- 如何在 GKE 上创建 Kubernetes 集群
- 如何使用 Helm 在 Kubernetes 集群上安装 Istio
- 如何使用 Helm 安装 Istio 多集群
- 将 Web 应用从源代码部署到 Kubernetes
- 为 Istio 编写和应用流量路由规则
- Prometheus 指标
- 在 Kubernetes 集群内构建和推送容器映像
2. 准备工作
您可以在以下任一设备上学习此 Codelab:
- Google Cloud Shell (推荐):浏览器内 Shell,附带已安装的工具
- 笔记本电脑(请按照以下说明操作)
开始使用 Google Cloud Platform
- 如果您没有 GCP 账号,请向讲师领取免费的用户账号卡。
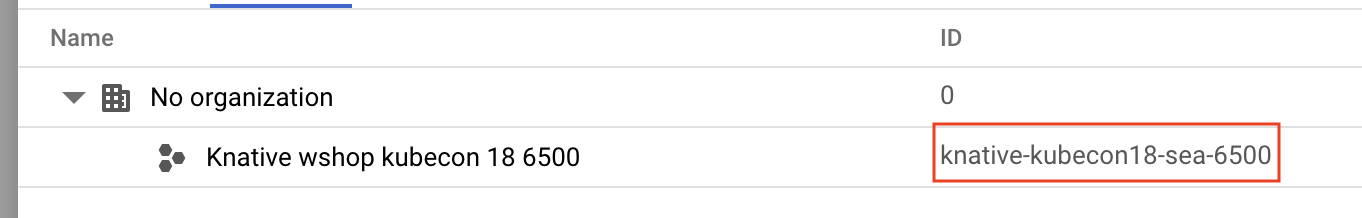
- 前往 Google Cloud 控制台,然后点击“选择项目”图标:

- 记下项目的“ID”,然后点击该项目以选择它:
方法 1:使用 Google Cloud Shell(推荐)
Cloud Shell 在浏览器中提供了一个命令行 shell,其中安装了您需要的工具,并且会自动针对您的 Google Cloud Platform 账号进行身份验证。(如果您不想在 Cloud Shell 中运行此练习,请跳到下一部分。)
前往 Cloud 控制台,然后点击右上角工具栏中的“激活 Cloud Shell”:

向 Cloud Shell 添加工具
或者,运行以下命令将两者都安装到 ~/.bin 并将其添加到您的 $PATH:
mkdir -p ~/.bin && \
cd ~/.bin && \
curl -LO https://raw.githubusercontent.com/ahmetb/kubectx/master/kubectx && \
chmod +x kubectx && \
curl -LO https://raw.githubusercontent.com/ahmetb/kubectx/master/kubens && \
chmod +x kubens && \
curl -LO  https://storage.googleapis.com/kubernetes-helm/helm-v2.12.0-linux-amd64.tar.gz && \
tar xzf helm-v2.12.0-linux-amd64.tar.gz && \
rm helm-v2.12.0-linux-amd64.tar.gz && \
mv linux-amd64/helm ./helm && \
rm -r linux-amd64 && \
export PATH=${HOME}/.bin:${PATH}
以下是一些快速提示,可帮助您更轻松地使用 Cloud Shell:
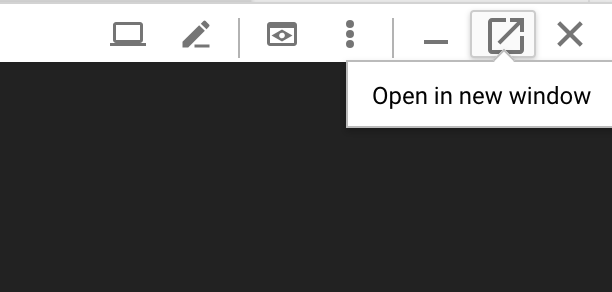
1. 将 shell 分离到新窗口中: |
|
2. 使用文件编辑器: 点击右上角的铅笔图标,启动浏览器内文件编辑器。在将代码段复制到文件时,您会发现此功能非常实用。 |
|
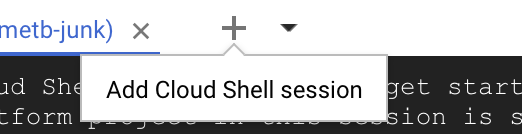
3. 启动新标签页:如果您需要多个终端提示。 |
|
4. 放大文字: Cloud Shell 中的默认字号可能太小,难以阅读。 | 在 Linux/Windows 上按 Ctrl-+,在 macOS 上按 ⌘-+。 |

方法 2:设置笔记本电脑(不推荐)
如果您更喜欢使用自己的工作站环境而不是 Cloud Shell,请设置以下工具:
- 安装
gcloud:(已预安装在 Cloud Shell 上)。按照说明在您的平台上安装gcloud。我们将使用此配置来创建 Kubernetes 集群。 - 安装
kubectl:(已预安装在 Cloud Shell 上)。运行以下命令以进行安装:
gcloud components install kubectl
运行以下命令以对 gcloud 进行身份验证。系统会要求您使用 Google 账号登录。然后,选择预先创建的项目(如上所示)作为默认项目。(您可以跳过配置计算可用区):
gcloud init
3. 设置 GCP 项目
在您的项目中启用 GKE (Google Kubernetes Engine)、GCR (Google Container Registry) 和 GCB (Google Cloud Build) API:
gcloud services enable \
  cloudapis.googleapis.com \
  container.googleapis.com \
  containerregistry.googleapis.com \
  cloudbuild.googleapis.com
设置环境变量
在设置过程中,我们将大量使用 Google Cloud 项目,因此让我们设置一个环境变量以供快速参考
export GCLOUD_PROJECT=$(gcloud config get-value project)
在本次研讨会期间,我们将创建一些代码和配置文件,因此让我们先创建一个项目目录并切换到该目录
mkdir -p src/istio-burst && \
cd src/istio-burst && \
export proj=$(pwd)
4. 创建“主”Kubernetes 集群
您可以轻松使用 Google Kubernetes Engine (GKE) 创建托管式 Kubernetes 集群。
以下命令将创建一个 Kubernetes 集群:
- 名为“primary”,
- 在 us-west1-a 可用区中,
- 可用的最新 Kubernetes 版本,
- 具有 4 个初始节点
export cluster=primary
export zone=us-west1-a
gcloud container clusters create $cluster --zone $zone --username "admin" \
--cluster-version latest --machine-type "n1-standard-2" \
--image-type "COS" --disk-size "100" \
--scopes "https://www.googleapis.com/auth/compute",\
"https://www.googleapis.com/auth/devstorage.read_only",\
"https://www.googleapis.com/auth/logging.write",\
"https://www.googleapis.com/auth/monitoring",\
"https://www.googleapis.com/auth/servicecontrol",\
"https://www.googleapis.com/auth/service.management.readonly",\
"https://www.googleapis.com/auth/trace.append" \
--num-nodes "4" --network "default" \
--enable-cloud-logging --enable-cloud-monitoring --enable-ip-alias
(这可能需要大约 5 分钟的时间。您可以在 Cloud 控制台中观看集群的创建过程。)
创建 Kubernetes 集群后,gcloud 会配置 kubectl,使其凭据指向该集群。
gcloud container clusters get-credentials $cluster --zone=$zone
现在,您应该能够在新集群中使用 kubectl 了。
运行以下命令以列出集群的 Kubernetes 节点(它们应显示“就绪”状态):
kubectl get nodes
修改 Kubeconfig 名称以方便使用
我们将频繁切换上下文,因此为集群设置一个简短的别名非常方便。
此命令会将您刚刚创建的 kubeconfig 条目重命名为 primary
kubectx ${cluster}=gke_${GCLOUD_PROJECT}_${zone}_${cluster}
设置权限:
部署 Istio 需要您是集群管理员。此命令会将与您的 Google Cloud 账号关联的电子邮件地址设置为集群管理员
kubectl create clusterrolebinding cluster-admin-binding \
    --clusterrole=cluster-admin \
    --user=$(gcloud config get-value core/account)
5. 创建“突发”集群
以下命令将创建一个 Kubernetes 集群:
- 名为“burst”,
- 在 us-west1-a 可用区中,
- 可用的最新 Kubernetes 版本,
- 具有 1 个初始节点
- 已启用自动扩缩功能,最多可扩缩到 5 个节点
export cluster=burst
export zone=us-west1-a
gcloud container clusters create $cluster --zone $zone --username "admin" \
--cluster-version latest --machine-type "n1-standard-2" \
--image-type "COS" --disk-size "100" \
--scopes "https://www.googleapis.com/auth/compute",\
"https://www.googleapis.com/auth/devstorage.read_only",\
"https://www.googleapis.com/auth/logging.write",\
"https://www.googleapis.com/auth/monitoring",\
"https://www.googleapis.com/auth/servicecontrol",\
"https://www.googleapis.com/auth/service.management.readonly",\
"https://www.googleapis.com/auth/trace.append" \
--num-nodes "1" --enable-autoscaling --min-nodes=1 --max-nodes=5 \
--network "default" \
--enable-cloud-logging --enable-cloud-monitoring --enable-ip-alias
(这可能需要大约 5 分钟的时间。您可以在 Cloud 控制台中观看集群的创建过程。)
创建 Kubernetes 集群后,gcloud 会配置 kubectl,使其凭据指向该集群。
gcloud container clusters get-credentials $cluster --zone=$zone
现在,您应该能够在新集群中使用 kubectl 了。
运行以下命令以列出集群的 Kubernetes 节点(它们应显示“就绪”状态):
kubectl get nodes
修改 Kubeconfig 名称以方便使用
此命令会将您刚刚创建的 kubeconfig 条目修改为 burst
kubectx ${cluster}=gke_${GCLOUD_PROJECT}_${zone}_${cluster}
设置权限:
部署 Istio Remote 需要您是集群管理员。此命令会将与您的 Google Cloud 账号关联的电子邮件地址设置为集群管理员
kubectl create clusterrolebinding cluster-admin-binding \
    --clusterrole=cluster-admin \
    --user=$(gcloud config get-value core/account)
6. 应用防火墙规则
为了使这两个集群能够相互通信,我们需要创建一条防火墙规则。
运行以下命令,在 Google Cloud Platform 中创建防火墙规则,以允许集群进行通信
function join_by { local IFS="$1"; shift; echo "$*"; }
ALL_CLUSTER_CIDRS=$(gcloud container clusters list \
--filter="(name=burst OR name=primary) AND zone=$zone" \
--format='value(clusterIpv4Cidr)' | sort | uniq)
ALL_CLUSTER_CIDRS=$(join_by , $(echo "${ALL_CLUSTER_CIDRS}"))
ALL_CLUSTER_NETTAGS=$(gcloud compute instances list \
--filter="(metadata.cluster-name=burst OR metadata.cluster-name=primary) AND metadata.cluster-location=us-west1-a" \
--format='value(tags.items.[0])' | sort | uniq)
ALL_CLUSTER_NETTAGS=$(join_by , $(echo "${ALL_CLUSTER_NETTAGS}"))
gcloud compute firewall-rules create istio-multicluster-test-pods \
  --allow=tcp,udp,icmp,esp,ah,sctp \
  --direction=INGRESS \
  --priority=900 \
  --source-ranges="${ALL_CLUSTER_CIDRS}" \
  --target-tags="${ALL_CLUSTER_NETTAGS}" --quiet
我们已设置好两个集群,可以开始在其中部署应用和 Istio 了!
7. Istio 简介
Istio 是什么?
Istio 是一种服务网格控制平面,旨在“连接、保护、控制和观察服务”。它通过多种方式实现此目的,但主要是通过将代理容器 ( Envoy) 边车化到每个已部署的 Kubernetes Pod 中。代理容器与通用政策和遥测中心 ( Mixer) 协同控制微服务之间的所有网络通信。
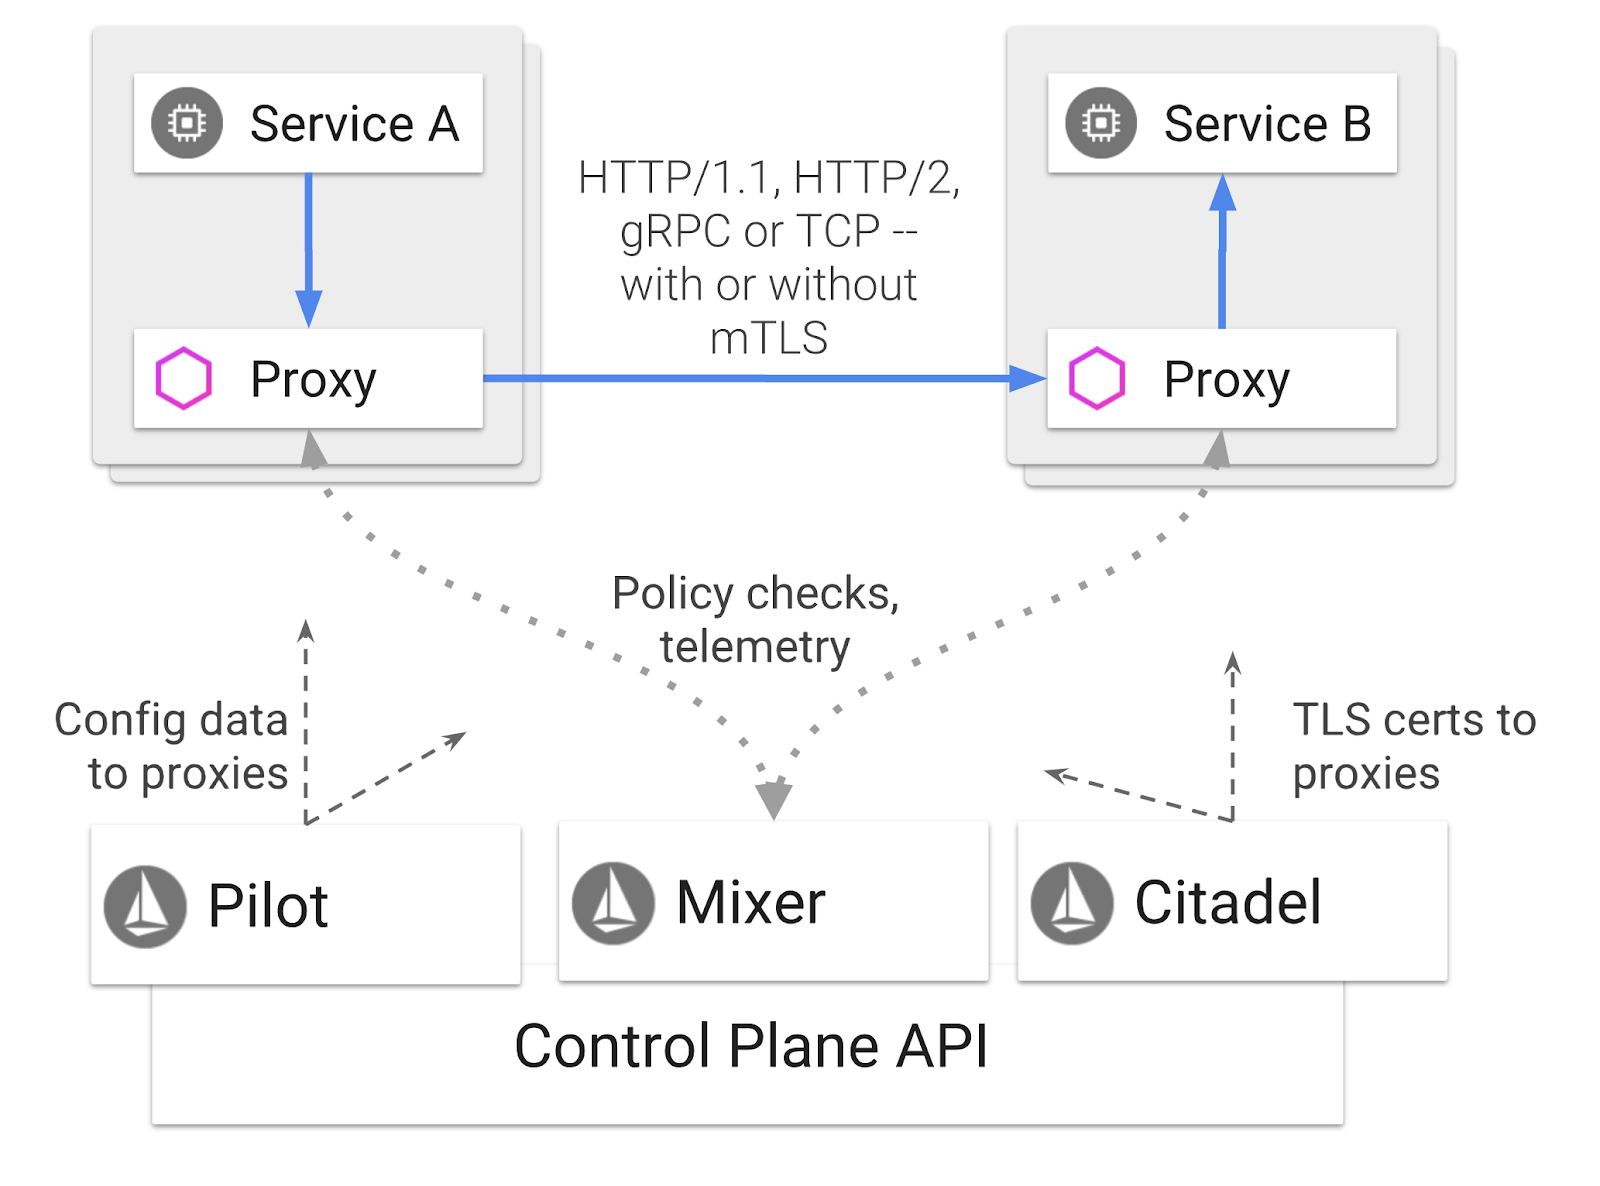
这些政策可以独立于 Kubernetes Deployment 和 Service 应用,这意味着网络运营商可以观察网络活动,限制、重定向或重写网络政策,而无需重新部署关联的应用。
Istio 支持的部分流量管理功能包括:
- 断路器
- 基于百分比的流量拆分
- 网址重写
- TLS 终结
- 健康检查
- 负载均衡
在本研讨会中,我们将重点介绍基于百分比的流量拆分。
我们将使用的 Istio 术语
VirtualService
VirtualService 定义了一组在寻址主机时要应用的流量路由规则。
网关
网关是在网格边缘运行的负载平衡器,用于接收传入或传出 HTTP/TCP 连接。网关可以指定端口、SNI 配置等。
DestinationRule
DestinationRule 定义了在路由发生后应用于以服务为目标的流量的政策。它们用于指定负载均衡的配置、来自 Sidecar 的连接池大小以及离群点检测设置。
Istio 多集群
您可能已经注意到,在创建两个集群时,primary 集群有 4 个节点,没有自动扩缩功能;而 burst 集群有 1 个节点,自动扩缩功能最多可扩容到 5 个节点。
此配置有两个原因。
首先,我们希望模拟从“本地”到云的场景。在本地环境中,由于基础架构是固定的,因此您无法访问自动扩缩集群。
其次,4 节点设置(如上所述)是运行 Istio 的最低要求。这引出了一个问题:如果 Istio 至少需要 4 个节点,那么我们的 burst 集群如何才能在 1 个节点上运行 Istio?答案是,Istio 多集群安装的 Istio 服务集要小得多,并且会与主集群中的 Istio 安装进行通信,以检索政策规则并发布遥测信息。
8. 应用架构概览
组件概览
我们将使用 NodeJS 和 Redis 部署一个三层应用。
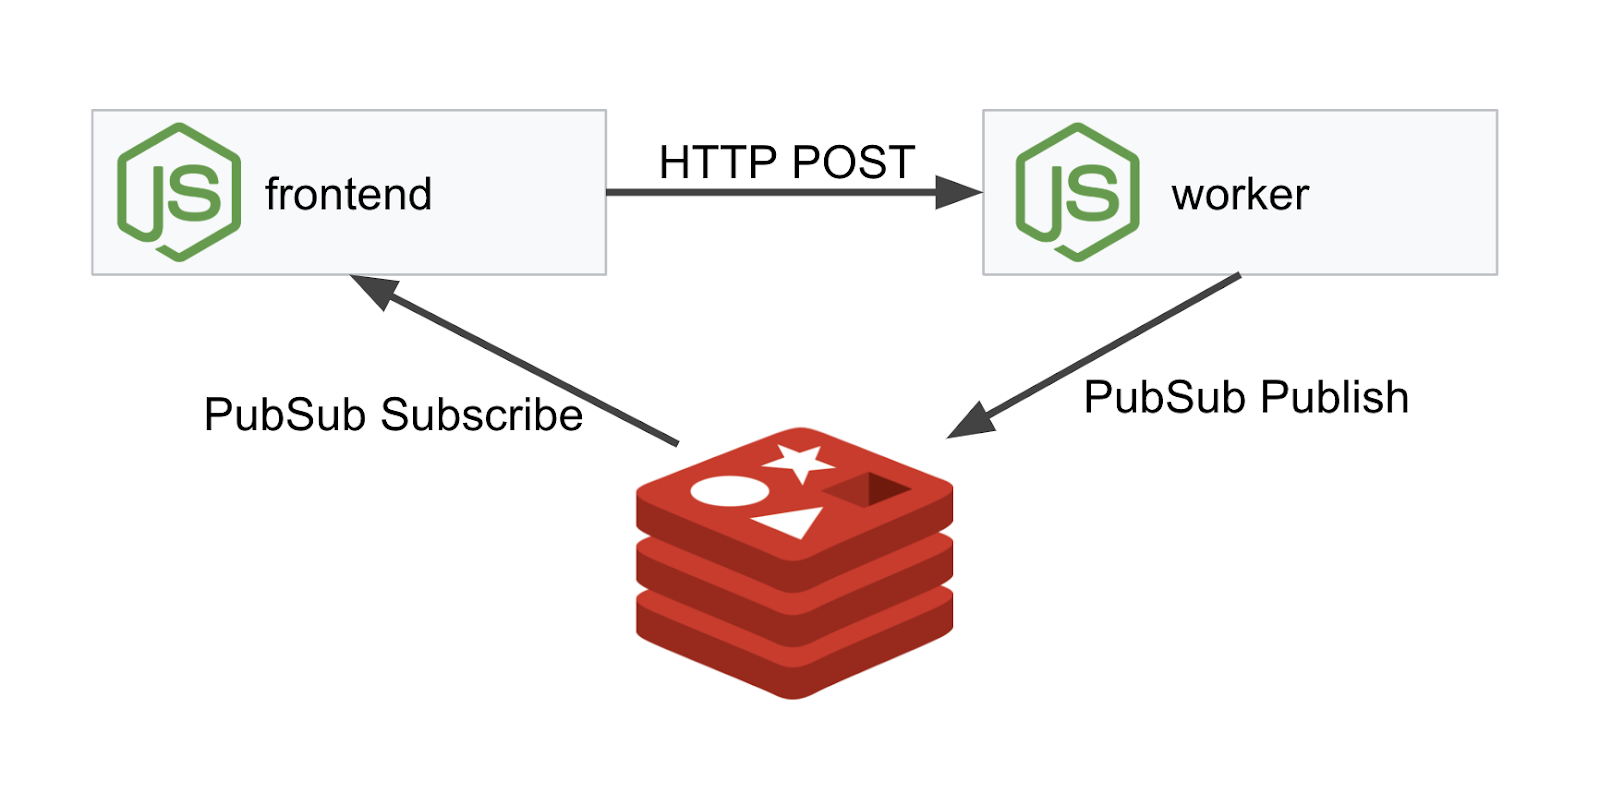
工作器
工作器应用使用 NodeJS 编写,将监听传入的 POST HTTP 请求,对这些请求执行哈希运算,并且如果定义了名为 PREFIX 的环境变量,则会在哈希前面加上该值。计算出哈希后,应用会在指定 Redis 服务器上的“calculation”渠道上发送结果。
我们稍后将使用 PREFIX 环境变量来演示多集群功能。
供参考:以下是应用使用的软件包。
body-parser:允许我们解析 HTTP 请求cors:允许使用跨域资源共享dotenv:轻松解析环境变量express:轻松的网站托管ioredis:用于与 Redis 数据库通信的客户端库morgan:提供结构清晰的日志
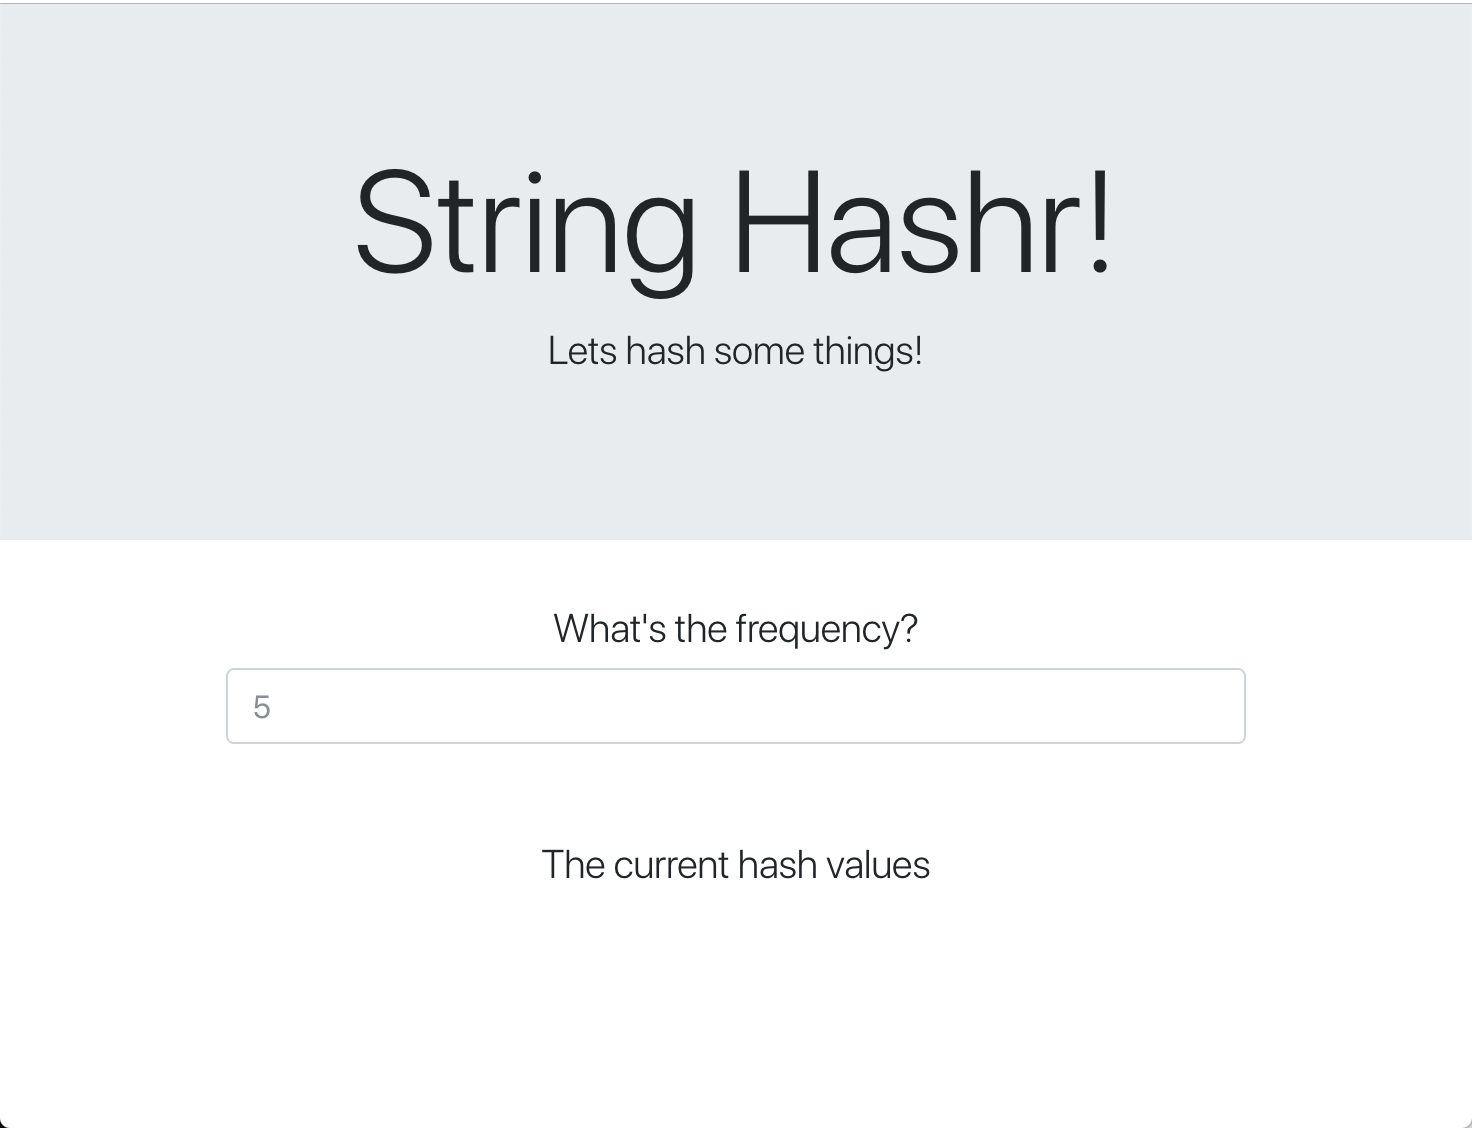
前端
我们的前端也是一个 NodeJS 应用,它使用 express 托管网页。它会获取用户输入的频次,并以该频次向我们的 worker 应用发送请求。此应用还会订阅名为“calculation”的 Redis 渠道上的消息,并在网页中显示结果。
该应用使用以下依赖项。
body-parser:允许我们解析 HTTP 请求dotenv:轻松解析环境变量express:轻松的网站托管ioredis:用于与 Redis 数据库通信的客户端库morgan:提供结构清晰的日志request:允许发出 HTTP 请求socket.io:允许从网页到服务器的双向通信
此网页使用 Bootstrap 进行样式设置,运行时的外观如下所示
架构图
部署图
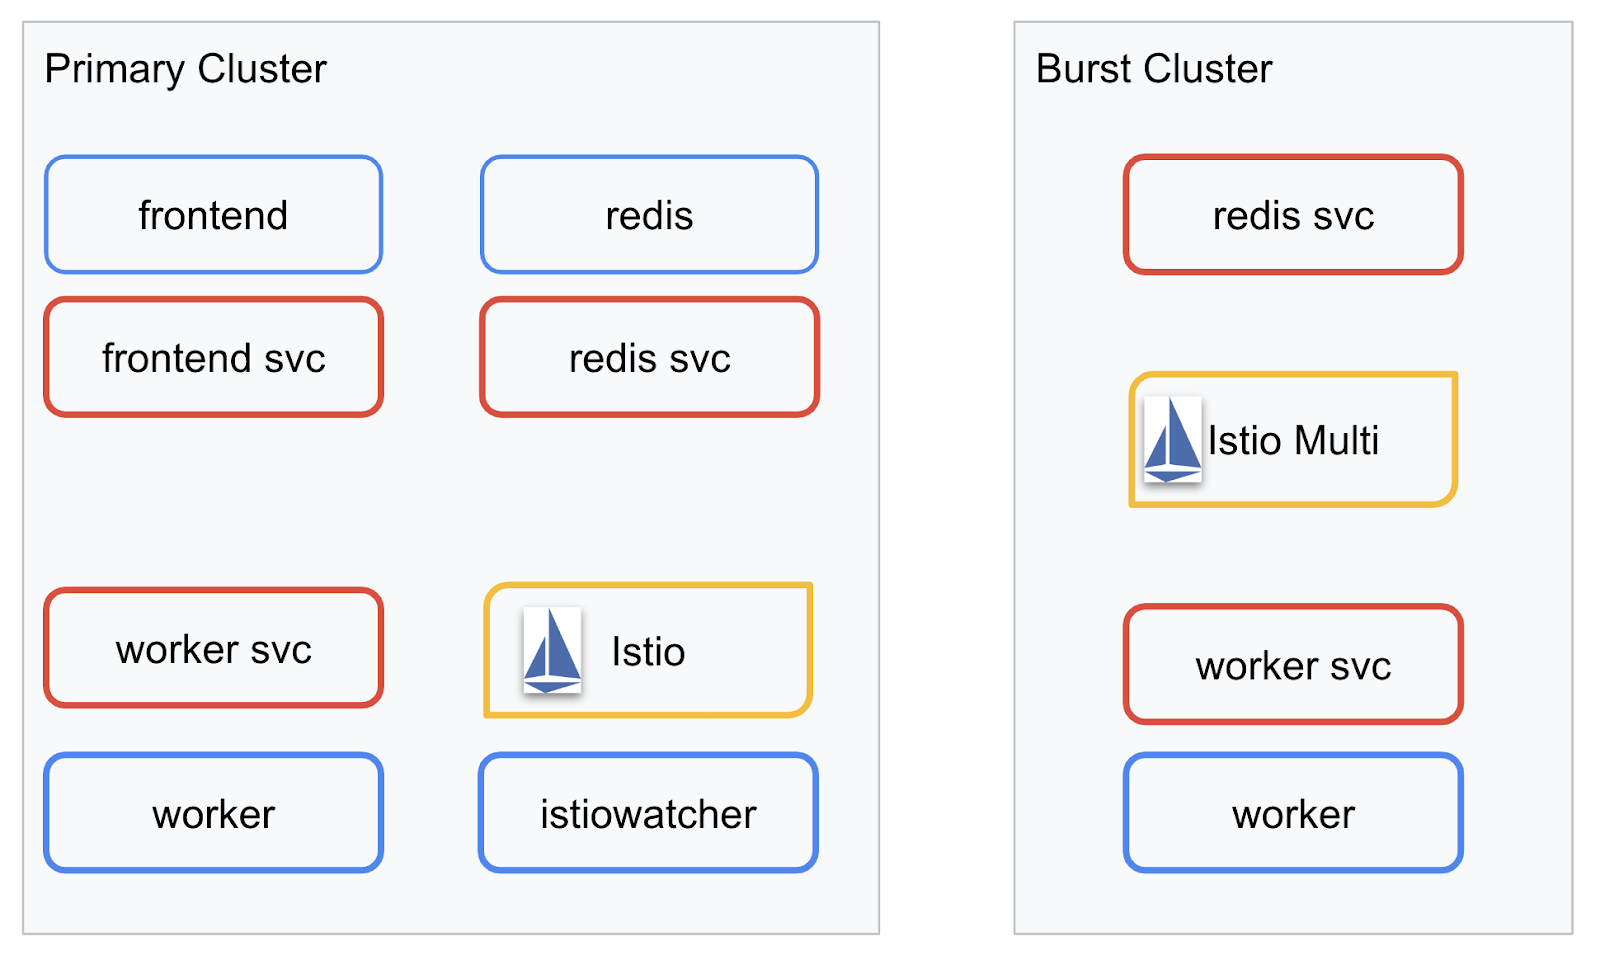
我们将把最终应用部署到我们创建的两个集群中。primary 集群将部署所有组件(frontend、worker 和 Redis),但 burst 集群仅部署 worker 应用。
下图展示了这两个集群。以红色框线标出的为 Kubernetes 服务,以蓝色框线标出的为 Kubernetes Deployment。黄色方框表示我们安装的 Istio。
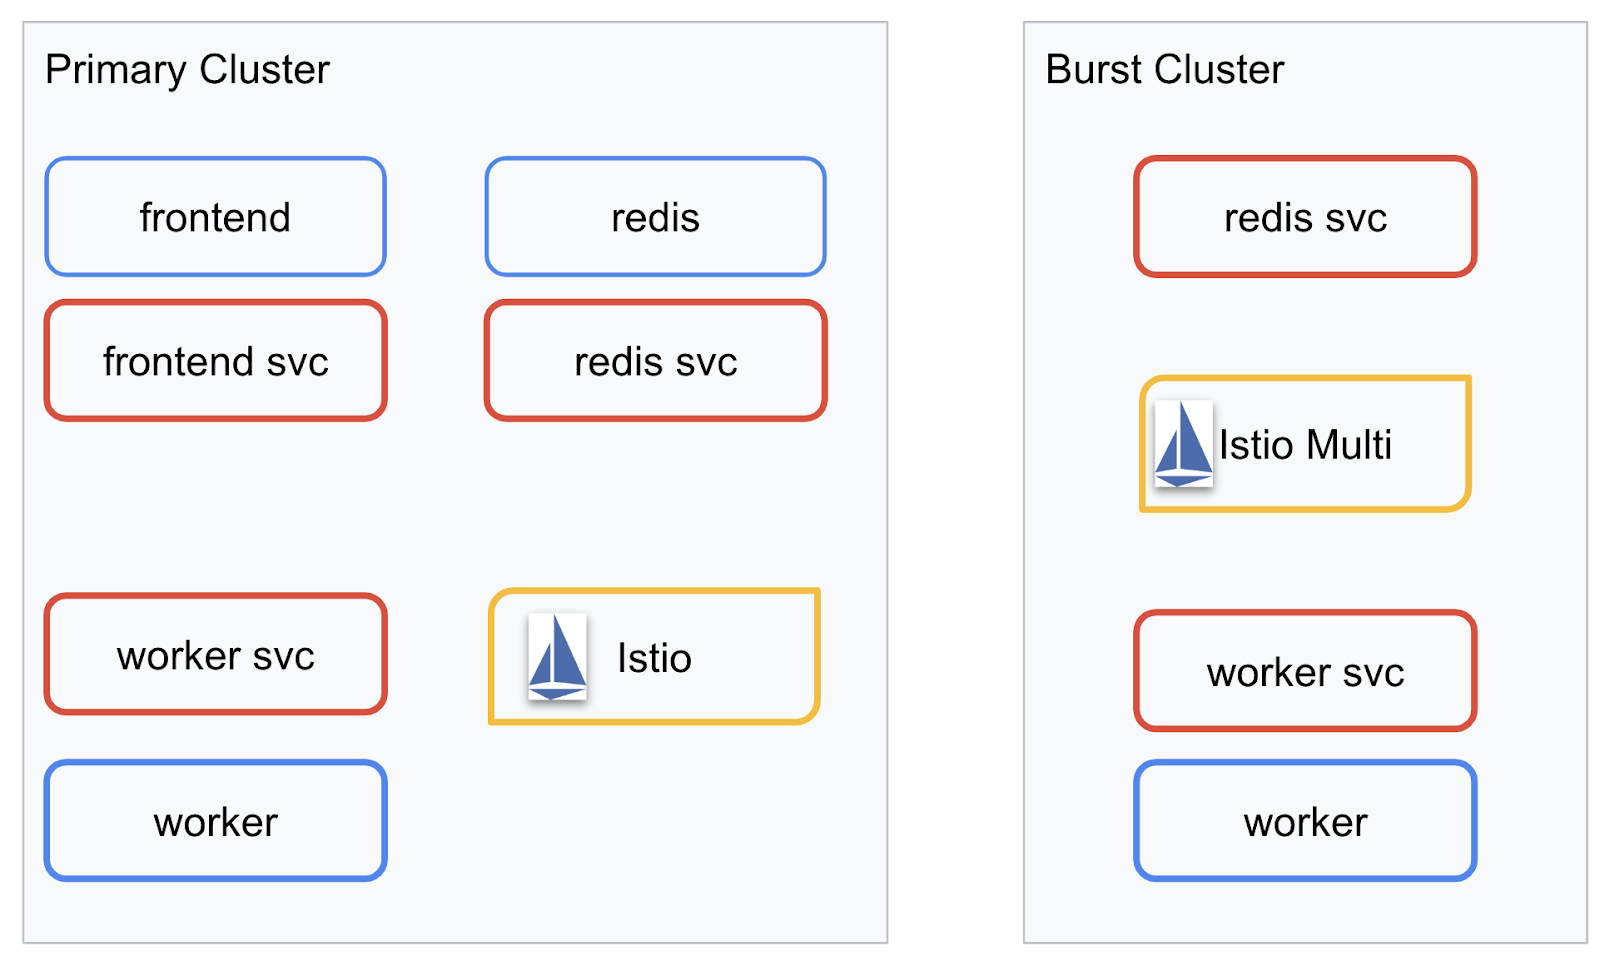
请注意,即使 burst 集群中没有 Redis 的 Deployment,该集群仍然部署了 Redis 的服务。我们需要在集群中提供此服务,以便 Kubernetes DNS 可以解析请求,但当实际发出请求时,Istio 代理会将请求重新路由到 primary 集群中的 Redis 部署。
最终应用将在 primary 集群中运行一个名为 istiowatcher. 的额外部署。这样一来,当流量超过特定阈值时,我们就可以自动将流量动态重新路由到 burst。
9. 创建应用部署文件
我们需要创建一组 Kubernetes 清单来部署应用
进入项目的根目录,然后创建一个名为 kubernetes 的新文件夹
mkdir ${proj}/kubernetes && cd ${proj}/kubernetes
编写 frontend.yaml
此命令将同时创建 Kubernetes Deployment 和 Service,以便访问我们的前端映像。
将以下内容插入到 frontend.yaml 中。
apiVersion: extensions/v1beta1
kind: Deployment
metadata:
  name: frontend-deployment
  labels:
    app: frontend
spec:
  replicas: 1
  selector:
    matchLabels:
      app: frontend
  template:
    metadata:
      labels:
        app: frontend
    spec:
      containers:
      - name: frontend
        image: gcr.io/istio-burst-workshop/frontend
        ports:
        - containerPort: 8080
        readinessProbe:
            initialDelaySeconds: 10
            httpGet:
              path: "/_healthz"
              port: 8080
              httpHeaders:
              - name: "Cookie"
                value: "istio_session-id=x-readiness-probe"
        livenessProbe:
          initialDelaySeconds: 10
          httpGet:
            path: "/"
            port: 8080
            httpHeaders:
            - name: "Cookie"
              value: "istio_session-id=x-liveness-probe"
        env:
        - name: PORT
          value: "8080"
        - name: PROCESSOR_URL
          value: "http://worker-service"
        - name: REDIS_URL
          value: "redis-cache-service:6379"
---
apiVersion: v1
kind: Service
metadata:
  name: frontend-service
spec:
  type: ClusterIP
  selector:
    app: frontend
  ports:
  - name: http
    port: 80
    targetPort: 8080
Deployment 中的关键注意事项
- 我们已将应用运行所要使用的端口指定为
8080 - 我们将工作线程的地址设置为“
http://worker-service”,并将使用 Kubernetes 内置的 DNS 功能来解析生成的服务 - 我们将
REDIS_URL的地址设置为“redis-cache-service:6379”,并将使用 Kubernetes 内置的 DNS 功能来解析生成的 IP 地址。 - 我们还为容器设置了
liveness和readiness探测,以帮助 Kubernetes 了解容器何时启动并运行。
编写 worker-service.yaml
我们将 Kubernetes 服务定义与 Deployment 定义分开写入不同的文件,因为我们将在多个集群中重复使用此服务,但会为每个集群编写不同的 Deployment。
在 worker-service.yaml 中插入以下内容
apiVersion: v1
kind: Service
metadata:
 name: worker-service
spec:
 type: ClusterIP
 selector:
   app: worker
 ports:
 - name: http
   port: 80
   targetPort: 8081
编写 worker-primary.yaml
这是我们将推送到主集群的 worker 部署。
将以下内容插入到 worker-primary.yaml 中。
apiVersion: extensions/v1beta1
kind: Deployment
metadata:
 name: worker-deployment
 labels:
   app: worker
spec:
 replicas: 1
 selector:
   matchLabels:
     app: worker
 template:
   metadata:
     labels:
       app: worker
       cluster-type: primary-cluster
   spec:
     containers:
     - name: worker
       image: gcr.io/istio-burst-workshop/worker
       imagePullPolicy: Always
       ports:
       - containerPort: 8081
       readinessProbe:
           initialDelaySeconds: 10
           httpGet:
             path: "/_healthz"
             port: 8081
             httpHeaders:
             - name: "Cookie"
               value: "istio_session-id=x-readiness-probe"
       livenessProbe:
         initialDelaySeconds: 10
         httpGet:
           path: "/"
           port: 8081
           httpHeaders:
           - name: "Cookie"
             value: "istio_session-id=x-liveness-probe"
       env:
       - name: PORT
         value: "8081"
       - name: REDIS_URL
         value: "redis-cache-service:6379"
请注意,在此示例中,我们遵循了相同的模式,即提供 liveness 和 readiness 探测,并指定供应用使用的 PORT 和 REDIS_URL 环境变量。
在此部署中,还需要注意的一点是缺少 PREFIX 环境变量。这意味着我们的计算结果将是原始哈希值(没有任何前缀)。
此部署的最后一个关键点是 cluster-type: primary-cluster 标签。稍后,我们将在 Istio 多集群上进行流量路由时使用该功能
编写 redis.yaml
工作器与前端之间的通信是通过 Redis 渠道进行的,因此我们需要将 Redis 应用部署到集群中。
将以下内容插入到 redis.yaml
apiVersion: extensions/v1beta1
kind: Deployment
metadata:
 name: redis-cache
spec:
 template:
   metadata:
     labels:
       app: redis-cache
   spec:
     containers:
     - name: redis
       image: redis:alpine
       ports:
       - containerPort: 6379
       readinessProbe:
         periodSeconds: 5
         tcpSocket:
           port: 6379
       livenessProbe:
         periodSeconds: 5
         tcpSocket:
           port: 6379
       volumeMounts:
       - mountPath: /data
         name: redis-data
       resources:
         limits:
           memory: 256Mi
           cpu: 125m
         requests:
           cpu: 70m
           memory: 200Mi
     volumes:
     - name: redis-data
       emptyDir: {}
这是 Redis 应用的半标准部署。它会基于 redis:alpine 映像启动容器,公开适当的端口并设置合理的资源限制。
编写 redis-service.yaml
我们需要一个 Kubernetes 服务来与 Redis 应用通信
将以下内容插入到 redis-service.yaml
apiVersion: v1
kind: Service
metadata:
 name: redis-cache-service
spec:
 type: ClusterIP
 selector:
   app: redis-cache
 ports:
 - port: 6379
   targetPort: 6379
这会提供名为 redis-cache-service 的服务,以访问我们的 Redis 部署。
10. 部署应用
将映像推送到 GCR 并编写 Kubernetes 清单后,就可以部署应用并查看其运行情况了!
运行以下命令以部署应用
- 确保我们位于正确的集群中
kubectx primary
- 部署 Redis 缓存
kubectl apply -f redis.yaml
- 部署 Redis 服务
kubectl apply -f redis-service.yaml
- 部署前端
kubectl apply -f frontend.yaml
- 部署工作器
kubectl apply -f worker-primary.yaml
- 部署 Worker 服务
kubectl apply -f worker-service.yaml
我们已将应用部署到 GKE。恭喜!
测试
等待 pod 上线
kubectl get pods -w
当所有 Pod 都处于“Running”状态时,按 Ctrl + C
NAME                                   READY     STATUS    RESTARTS   AGE
frontend-deployment-695d95fbf7-76sd8   1/1       Running   0          2m
redis-cache-7475999bf5-nxj8x           1/1       Running   0          2m
worker-deployment-5b9cf9956d-g975p     1/1       Running   0          2m
您会注意到,我们没有通过 LoadBalancer 公开前端。这是因为稍后我们将通过 Istio 访问应用。为了测试一切是否正常运行,我们将使用 kubectl port-forward. 运行以下命令,将本地(或 Cloud Shell)机器上的端口 8080 转发到运行 frontend 部署的端口 8080。
kubectl port-forward \
$(kubectl get pods -l app=frontend -o jsonpath='{.items[0].metadata.name}') \
8080:8080
如果您在本地运行:打开网络浏览器,然后前往 http://localhost:8080
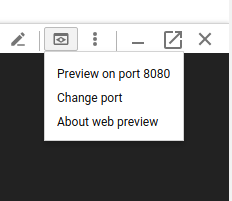
如果您在 Cloud Shell 中运行:请点击“网页预览”按钮,然后选择“在端口 8080 上预览”
您应该会看到前端!如果您在“频次”框中输入一个数字,您应该会看到开始出现哈希
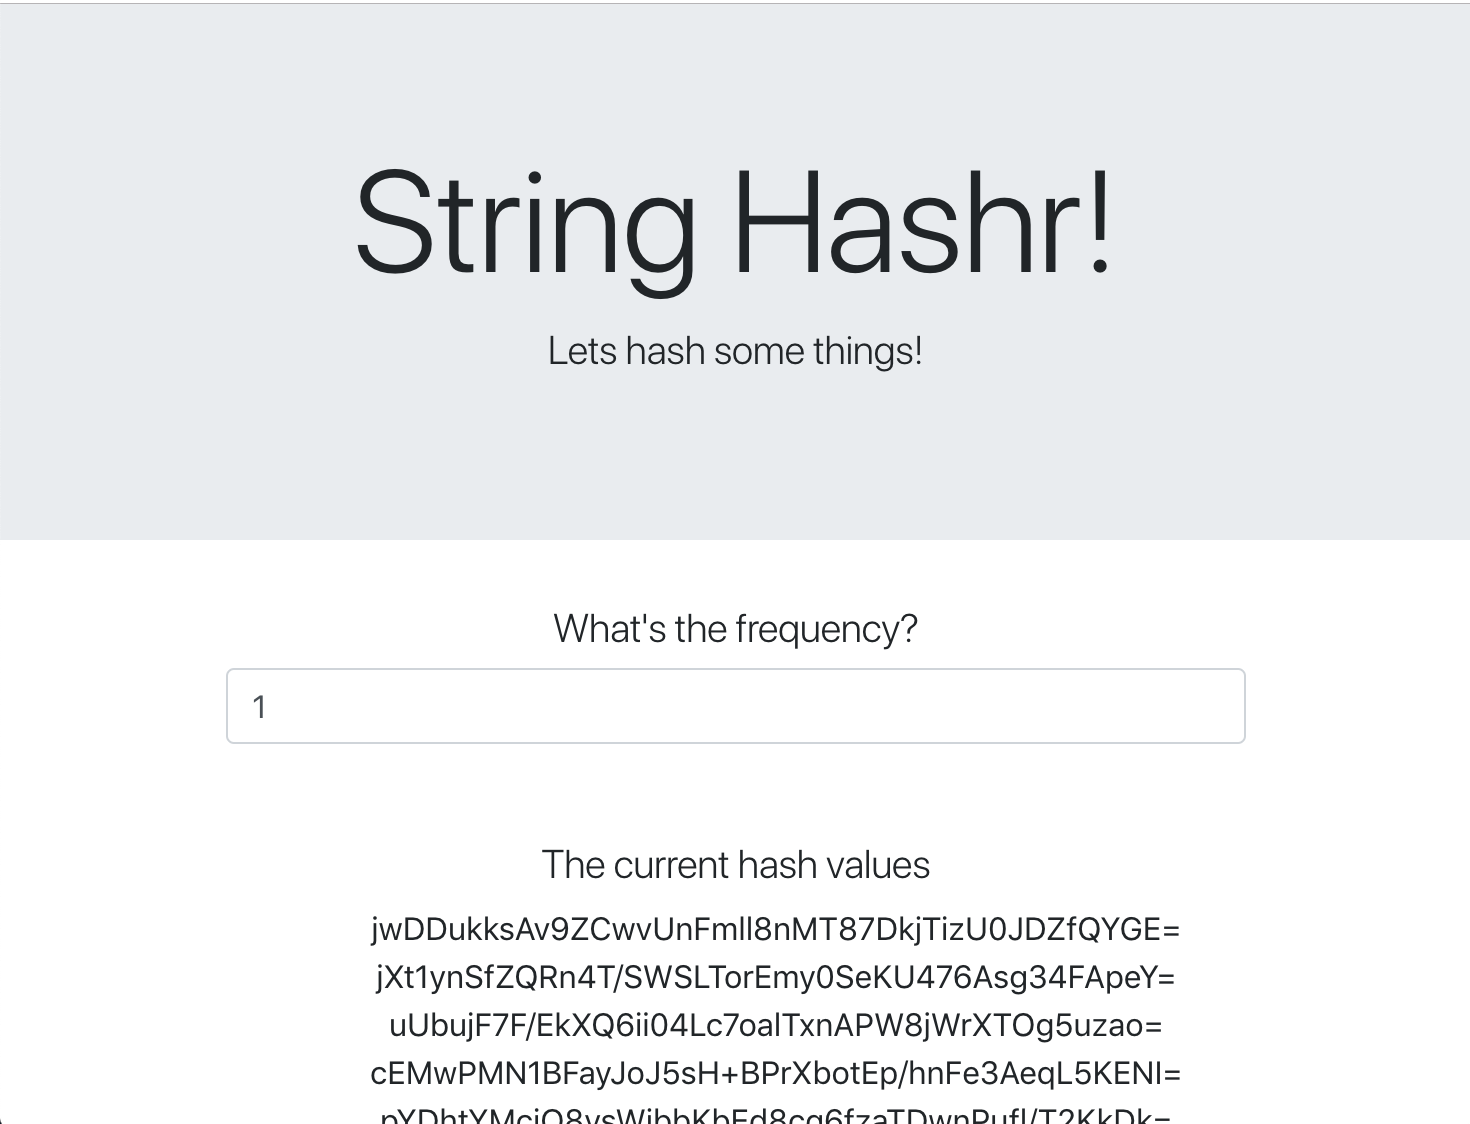
恭喜,一切都已正常运行!
按 Ctrl+C 即可停止转发端口。
11. 清理已部署的应用
我们将对集群应用 Istio,然后重新部署应用,因此我们先清理当前应用。
运行以下命令以删除您刚刚创建的所有 Deployment 和服务
- 删除
redis-cache-service
kubectl delete -f redis-service.yaml
- 删除
redis
kubectl delete -f redis.yaml
- 删除
frontend
kubectl delete -f frontend.yaml
- 删除
worker
kubectl delete -f worker-primary.yaml
- 删除
worker-service
kubectl delete -f worker-service.yaml
12. 在主集群上安装 Istio
获取 Istio
Istio 的版本托管在 GitHub 上。以下命令将下载并解压缩 1.0.0 版的 Istio。
- 切换到项目的根目录
cd ${proj}
- 下载归档文件
curl -LO https://github.com/istio/istio/releases/download/1.0.0/istio-1.0.0-linux.tar.gz
- 提取并移除归档文件
tar xzf istio-1.0.0-linux.tar.gz && rm istio-1.0.0-linux.tar.gz
创建 Istio 模板
运行以下 Helm 命令将创建用于在集群中安装 Istio 的模板。
helm template istio-1.0.0/install/kubernetes/helm/istio \
--name istio --namespace istio-system \
--set prometheus.enabled=true \
--set servicegraph.enabled=true  > istio-primary.yaml
此命令会在当前目录中创建一个名为 istio-primary.yaml 的文件,其中包含部署和运行 Istio 所需的所有定义和规范。
请注意这两个 --set 参数。这些插件为 Istio 系统添加了 Prometheus 和 ServiceGraph 支持。我们将在稍后的实验中使用 Prometheus 服务。
部署 Istio
若要部署 Istio,我们首先需要创建一个名为 istio-system 的命名空间,以便 Istio 部署和服务可以在其中运行。
kubectl create namespace istio-system
最后,使用 Helm 应用我们创建的 istio-primary.yaml 文件
kubectl apply -f istio-primary.yaml
标签默认命名空间
Istio 的工作方式是将一个边车代理服务注入到每个 Deployment 中。此操作是选择性加入的,因此我们需要使用 istio-injection=enabled 为 default 命名空间添加标签,以便 Istio 可以自动为我们注入边车。
kubectl label namespace default istio-injection=enabled
恭喜!我们已创建并运行了集群,并且 Istio 已准备就绪,可以部署应用了!
13. 使用 Istio 流量管理功能部署应用
创建 Istio 流量管理配置文件
Istio 的工作方式与 Kubernetes 类似,因为它使用 YAML 文件进行配置。为此,我们需要创建一组文件来告知 Istio 如何公开和路由我们的流量。
创建名为 istio-manifests 的目录并切换到该目录
mkdir ${proj}/istio-manifests && cd ${proj}/istio-manifests
编写 frontend-gateway.yaml
此文件将以类似于 GKE LoadBalancer 的方式公开我们的 Kubernetes 集群,并将所有入站流量路由到我们的前端服务。
创建一个名为 frontend-gateway.yaml 的文件,并插入以下内容。
apiVersion: networking.istio.io/v1alpha3
kind: Gateway
metadata:
 name: frontend-gateway
spec:
 selector:
   istio: ingressgateway # use Istio default gateway implementation
 servers:
 - port:
     number: 80
     name: http
     protocol: HTTP
   hosts:
   - "*"
---
apiVersion: networking.istio.io/v1alpha3
kind: VirtualService
metadata:
 name: frontend-ingress-virtual-service
spec:
 hosts:
 - "*"
 gateways:
 - frontend-gateway
 http:
 - route:
   - destination:
       host: frontend-service
       port:
         number: 80
编写 redis-virtualservice.yaml
创建一个名为 redis-virtualservice.yaml 的文件,并插入以下内容
apiVersion: networking.istio.io/v1alpha3
kind: VirtualService
metadata:
 name: redis-virtual-service
spec:
 hosts:
 - redis-cache-service
 gateways:
 - mesh
 tcp:
 - route:
   - destination:
       host: redis-cache-service.default.svc.cluster.local
编写 worker-virtualservice.yaml
创建一个名为 worker-virtualservice.yaml 的文件,并插入以下内容
apiVersion: networking.istio.io/v1alpha3
kind: VirtualService
metadata:
 name: worker-virtual-service
spec:
 hosts:
 - worker-service
 gateways:
 - mesh
 http:
 - route:
   - destination:
       host: worker-service.default.svc.cluster.local
       port:
         number: 80
部署 Istio 流量管理政策
部署 Istio 政策的方式与其他 Kubernetes 资源相同,使用 kubectl apply
- 应用我们的网关
kubectl apply -f frontend-gateway.yaml
- 应用 Redis VirtualService
kubectl apply -f redis-virtualservice.yaml
- 应用工作器 VirtualService
kubectl apply -f worker-virtualservice.yaml
部署应用
- 切换回我们的
kubernetes目录
cd ${proj}/kubernetes
- 部署 Redis 缓存
kubectl apply -f redis.yaml
- 部署 Redis 服务
kubectl apply -f redis-service.yaml
- 部署前端
kubectl apply -f frontend.yaml
- 部署工作器
kubectl apply -f worker-primary.yaml
- 部署 Worker 服务
kubectl apply -f worker-service.yaml
验证
至此,我们已在具有 Istio 和流量管理政策的集群上重新部署了应用。
我们等待所有工作负载上线
所有服务都处于在线状态后,获取我们在 frontend-ingressgateway.yaml 中配置的 IngressGateway
$ kubectl -n istio-system get svc istio-ingressgateway
NAME                   TYPE           CLUSTER-IP    EXTERNAL-IP     PORT(S)                                                                                                     AGE
istio-ingressgateway   LoadBalancer   10.36.3.112   35.199.158.10   80:31380/TCP,
浏览 <EXTERNAL-IP> 地址或使用 curl 命令访问该地址,您应该会看到前端!
$ curl 35.199.158.10
<!doctype html>
<html>

<head>
    <title>String Hashr</title>
    <!-- Bootstrap -->
...
14. 在“突发”集群上安装 Istio
我们一直在 primary 集群上进行设置和部署,但我们还有另一个集群需要部署!
在本部分中,我们需要获取两个集群中的配置变量,因此请密切注意每个命令指向哪个集群。
创建 Istio 远程清单
与将 Istio 部署到 primary 集群时类似,我们将使用 Helm 将 Istio 远程部署到 burst 集群。不过,在此之前,我们需要先了解一些有关 primary 集群的信息
收集主集群信息
更改为 primary 集群
kubectx primary
以下命令用于检索主集群中各个 Pod 的 IP 地址。这些用于 Istio Remote 与主集群进行通信。
export PILOT_POD_IP=$(kubectl -n istio-system get pod -l istio=pilot -o jsonpath='{.items[0].status.podIP}')
export POLICY_POD_IP=$(kubectl -n istio-system get pod -l istio-mixer-type=policy -o jsonpath='{.items[0].status.podIP}')
export STATSD_POD_IP=$(kubectl -n istio-system get pod -l istio=statsd-prom-bridge -o jsonpath='{.items[0].status.podIP}')
export TELEMETRY_POD_IP=$(kubectl -n istio-system get pod -l istio-mixer-type=telemetry -o jsonpath='{.items[0].status.podIP}')
export ZIPKIN_POD_IP=$(kubectl -n istio-system get pod -l app=jaeger -o jsonpath='{range .items[*]}{.status.podIP}{end}')
创建远程模板
现在,我们将使用 helm 创建一个名为 istio-remote-burst.yaml 的文件,然后将其部署到 burst 集群。
更改为项目根目录
cd $proj
helm template istio-1.0.0/install/kubernetes/helm/istio-remote --namespace istio-system \
--name istio-remote \
--set global.remotePilotAddress=${PILOT_POD_IP} \
--set global.remotePolicyAddress=${POLICY_POD_IP} \
--set global.remoteTelemetryAddress=${TELEMETRY_POD_IP} \
--set global.proxy.envoyStatsd.enabled=true \
--set global.proxy.envoyStatsd.host=${STATSD_POD_IP} \
--set global.remoteZipkinAddress=${ZIPKIN_POD_IP} > istio-remote-burst.yaml
在突发集群上安装 Istio Remote
若要在 burst 集群上安装 Istio,我们需要按照在 primary 集群上安装时所用的步骤操作,但需要改用 istio-remote-burst.yaml 文件。
将 kubecontext 更改为 burst
kubectx burst
创建 istio-system 命名空间
kubectl create ns istio-system
应用 istio-burst.yaml
kubectl apply -f istio-remote-burst.yaml
标签默认命名空间
同样,我们需要为 default 命名空间添加标签,以便自动注入代理。
kubectl label namespace default istio-injection=enabled
恭喜!至此,我们已在 burst 集群上设置了 Istio Remote。不过,此时集群仍无法通信。我们需要为 burst 集群生成一个 kubeconfig 文件,以便部署到 primary 集群,从而将这两个集群关联起来。
为“突发”集群创建 kubeconfig
更改为突发集群
kubectx burst
设置环境
我们需要收集一些有关集群的信息,以便为其创建 kubeconfig 文件。
- 获取集群的名称
CLUSTER_NAME=$(kubectl config view --minify=true -o "jsonpath={.clusters[].name}")
- 获取集群服务器名称
SERVER=$(kubectl config view --minify=true -o "jsonpath={.clusters[].cluster.server}")
- 获取
istio-multi服务账号证书授权机构的 Secret 名称
SECRET_NAME=$(kubectl get sa istio-multi -n istio-system -o jsonpath='{.secrets[].name}')
- 获取存储在之前 Secret 中的证书授权机构数据
CA_DATA=$(kubectl get secret ${SECRET_NAME} -n istio-system -o "jsonpath={.data['ca\.crt']}")
- 获取存储在之前 Secret 中的令牌
TOKEN=$(kubectl get secret ${SECRET_NAME} -n istio-system -o "jsonpath={.data['token']}" | base64 --decode)
创建 kubeconfig 文件
设置完所有这些环境变量后,我们需要创建 kubeconfig 文件
cat <<EOF > burst-kubeconfig
apiVersion: v1
clusters:
   - cluster:
       certificate-authority-data: ${CA_DATA}
       server: ${SERVER}
     name: ${CLUSTER_NAME}
contexts:
   - context:
       cluster: ${CLUSTER_NAME}
       user: ${CLUSTER_NAME}
     name: ${CLUSTER_NAME}
current-context: ${CLUSTER_NAME}
kind: Config
preferences: {}
users:
   - name: ${CLUSTER_NAME}
     user:
       token: ${TOKEN}
EOF
这将在当前目录中创建一个名为 burst-kubeconfig 的新文件,primary 集群可以使用该文件对 burst 集群进行身份验证和管理。
切换回主集群
kubectx primary
通过创建 Secret 并为其添加标签,应用“突发”的 kubeconfig
kubectl create secret generic burst-kubeconfig --from-file burst-kubeconfig -n istio-system
为 Secret 添加标签,以便 Istio 知道要将其用于多集群身份验证
kubectl label secret burst-kubeconfig istio/multiCluster=true -n istio-system
恭喜!我们已对两个集群进行身份验证,并通过 Istio 多集群功能让它们彼此通信。我们来跨集群部署应用
15. 部署跨集群应用
创建部署
切换到 kubernetes 目录
cd ${proj}/kubernetes
为“爆发期”集群创建工作器 Deployment:worker-burst.yaml
创建一个名为 worker-burst.yaml 的文件,并在其中插入以下内容:
apiVersion: extensions/v1beta1
kind: Deployment
metadata:
  name: worker-deployment
  labels:
    app: worker
spec:
  replicas: 1
  selector:
    matchLabels:
      app: worker
  template:
    metadata:
      labels:
        app: worker
        cluster-type: burst-cluster
    spec:
      containers:
      - name: worker
        image: gcr.io/istio-burst-workshop/worker
        imagePullPolicy: Always
        ports:
        - containerPort: 8081
        readinessProbe:
            initialDelaySeconds: 10
            httpGet:
              path: "/_healthz"
              port: 8081
              httpHeaders:
              - name: "Cookie"
                value: "istio_session-id=x-readiness-probe"
        livenessProbe:
          initialDelaySeconds: 10
          httpGet:
            path: "/"
            port: 8081
            httpHeaders:
            - name: "Cookie"
              value: "istio_session-id=x-liveness-probe"
        env:
        - name: PORT
          value: "8081"
        - name: REDIS_URL
          value: "redis-cache-service:6379"
        - name: PREFIX
          value: "bursty-"
请注意,此文件与我们之前创建的 worker-primary.yaml 几乎完全相同。主要有两个区别。
第一个主要区别在于,我们添加了值为“bursty-”的 PREFIX 环境变量
env:
- name: PORT
  value: "8081"
- name: REDIS_URL
  value: "redis-cache-service:6379"
- name: PREFIX
  value: "bursty-"
这意味着 burst 集群中的工作器将以“bursty-”为前缀发送所有哈希,我们可以使用此信息来确定应用是否真正跨集群。
第二个主要区别是,我们将此部署中的 cluster-type 标签从 primary-cluster 更改为 burst-cluster
labels:
  app: worker
  cluster-type: burst-cluster
稍后,当我们更新 VirtualService 时,将使用此标签。
修改 Istio 服务
目前,我们的 Istio 服务并未同时利用这两个部署。我们 100% 的流量都路由到了“主”集群。我们来修改一下。
切换到 istio-manifests 目录
cd ${proj}/istio-manifests
修改 worker-virtualservice.yaml 以包含 DestinationRules
apiVersion: networking.istio.io/v1alpha3
kind: VirtualService
metadata:
  name: worker-virtual-service
spec:
  hosts:
  - worker-service
  gateways:
  - mesh
  http:
  - route:
    - destination:
        host: worker-service.default.svc.cluster.local
        subset: primary
        port:
          number: 80
      weight: 50
    - destination:
        host: worker-service.default.svc.cluster.local
        subset: burst
        port:
          number: 80
      weight: 50
---
apiVersion: networking.istio.io/v1alpha3
kind: DestinationRule
metadata:
  name: worker-destination-rule
spec:
  host: worker-service
  trafficPolicy:
    loadBalancer:
      simple: RANDOM
  subsets:
  - name: primary
    labels:
      cluster-type: primary-cluster
  - name: burst
    labels:
     cluster-type: burst-cluster
您可以看到,我们已向 VirtualService 添加了第二个目标。它仍然引用同一主机 (worker-service.default.svc.cluster.local)),但 50% 的流量会路由到 primary 子集,另外 50% 的流量会路由到 burst 子集。
我们将 primary 子集定义为具有 cluster-type: primary-cluster 标签的部署,并将 burst 子集定义为具有 cluster-type: burst-cluster 标签的部署。
这样一来,我们就可以有效地将流量在两个集群之间按 50/50 的比例进行分配。
部署到集群
将 redis-service.yaml 部署到突发集群
更改为 burst kubeconfig
kubectx burst
切换到我们的项目根目录
cd ${proj}
然后部署
将 redis-service.yaml 部署到突发集群
kubectl apply -f kubernetes/redis-service.yaml
将 worker-burst.yaml 部署到突发集群
kubectl apply -f kubernetes/worker-burst.yaml
将 worker-service.yaml 部署到突发集群
kubectl apply -f kubernetes/worker-service.yaml
应用 Istio VirtualService
更改为 primary kubeconfig
kubectx primary
然后部署
kubectl apply -f istio-manifests/worker-virtualservice.yaml
验证是否正常运行
如需验证它是否正常运行,请浏览到您的 Istio Ingress 点,并注意大约 50% 的哈希值都带有“burst-”前缀。
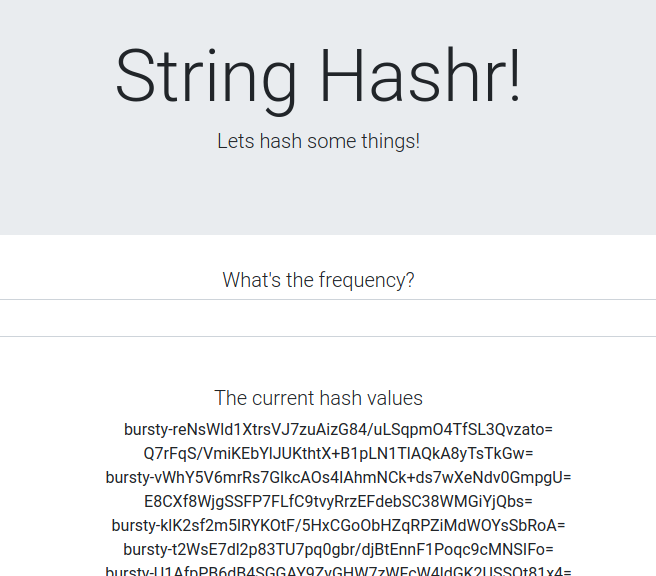
这意味着我们已成功实现跨集群通信!尝试更改不同服务的权重,然后应用 worker-virtualservice.yaml 文件。这是平衡集群之间流量的好方法,但如果我们能自动执行此操作,岂不是更好?
16. 利用 Prometheus 指标
Prometheus 简介
Prometheus 是一种开源系统监控和提醒工具包,最初在 SoundCloud 上构建而成。它维护一个多维数据模型,其中时间序列数据通过指标名称和键值对进行标识。
以下是 Prometheus 架构图,供您参考:
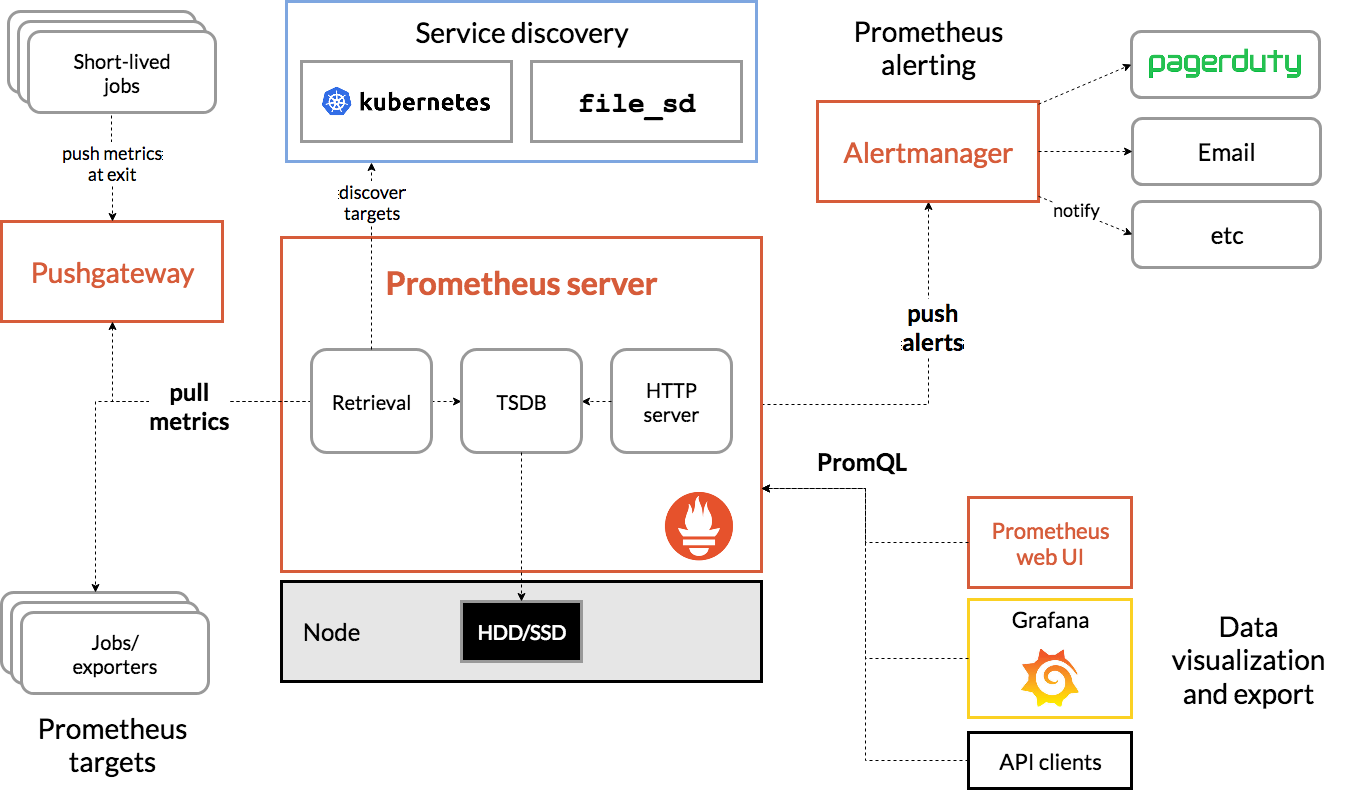
如果 Istio 与 Prometheus 一起部署,则会自动向 Prometheus 服务器报告各种指标。我们可以使用这些指标来动态管理集群。
探索 Prometheus 指标
首先,我们需要公开 Prometheus Deployment。
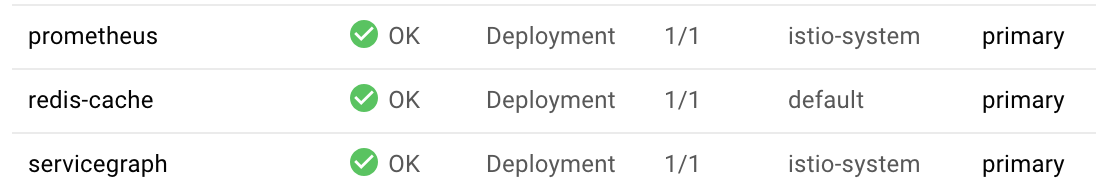
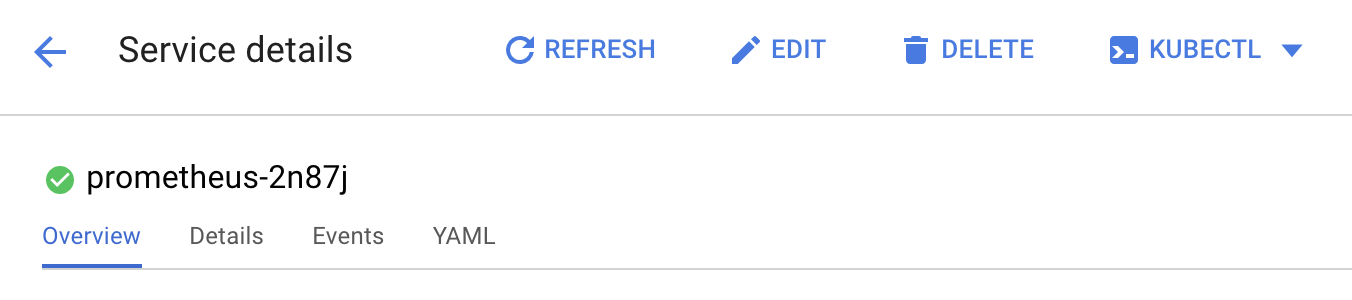
前往 GKE 中的“工作负载”标签页,然后向下钻取到“prometheus”工作负载。
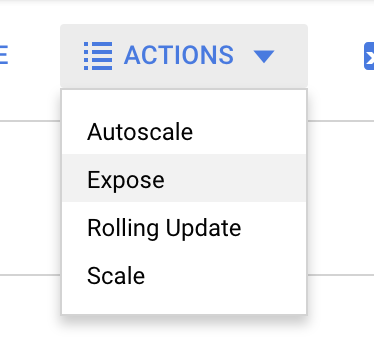
查看部署的详细信息后,依次前往“操作”>“公开”。
选择转发到端口 9090,然后输入“负载平衡器”
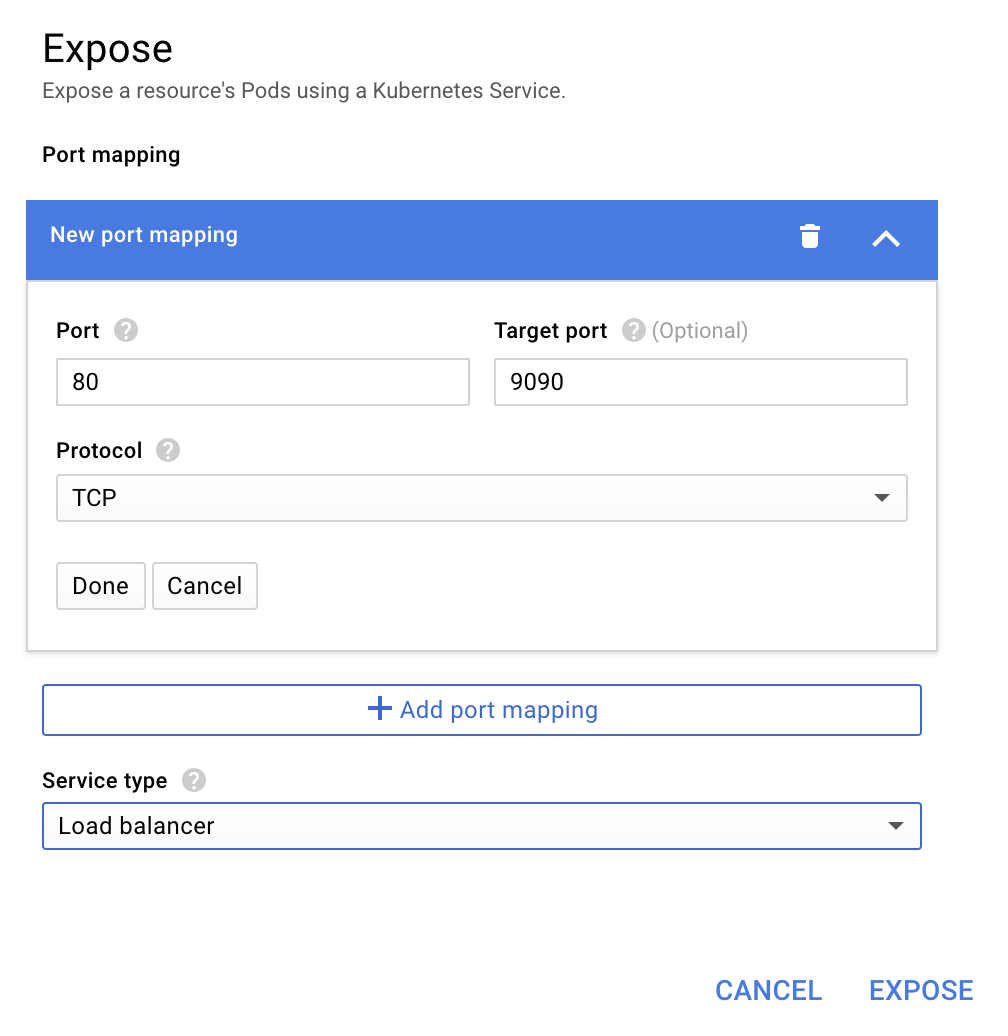
然后选择“公开”
这将在可公开访问的 IP 地址上创建一个服务,我们可以使用该服务来探索 Prometheus 指标
等待端点开始运行,然后点击“外部端点”旁边的 IP 地址 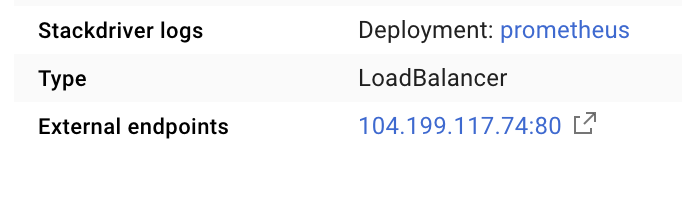
现在,您应该正在查看 Prometheus 界面。
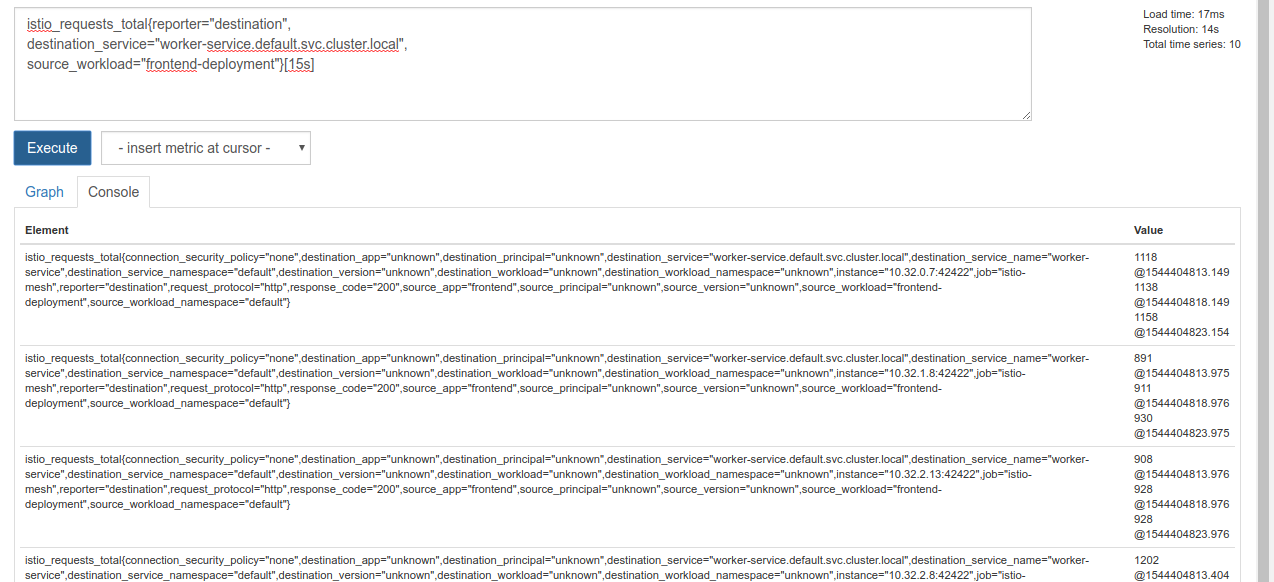
Prometheus 提供了足够的指标,可以成为自己的工作坊。不过,我们先从探索 istio_requests_total 指标开始。
执行该查询会返回大量数据。它是指通过 Istio 服务网格的所有请求的指标,数量非常多!我们将更改表达式,以便过滤出我们真正感兴趣的内容:
目标服务为 worker-service.default.svc.cluster.local 且来源为 frontend-deployment 的请求,仅限过去 15 秒内的请求
该查询如下所示:
istio_requests_total{reporter="destination",
destination_service="worker-service.default.svc.cluster.local",
source_workload="frontend-deployment"}[15s]
并为我们提供了一组更易于管理的数据
但仍有点密集。我们想知道每秒请求数,而不是所有请求。
为此,我们可以使用内置的 rate 函数
rate(istio_requests_total{reporter="destination",
destination_service="worker-service.default.svc.cluster.local",
source_workload="frontend-deployment"}[15s])
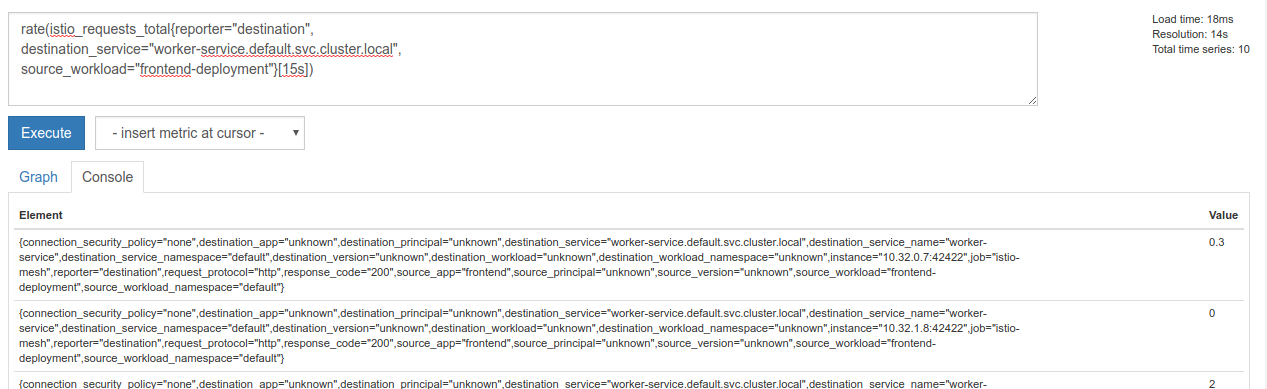
这样就更接近目标了,但我们需要将这些指标进一步归入一个逻辑组。
为此,我们可以使用 sum 和 by 关键字对结果进行分组和求和
sum(rate(istio_requests_total{reporter="destination",
destination_service="worker-service.default.svc.cluster.local",
source_workload="frontend-deployment"}[15s])) by (source_workload,
source_app, destination_service)
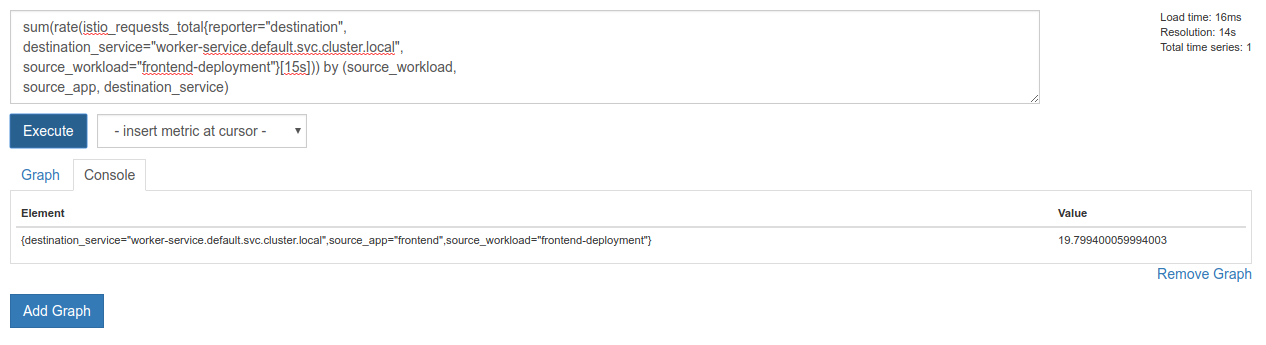
太好了!我们可以从 Prometheus 中获取所需的精确指标。
最终的 Prometheus 查询
根据我们所学到的知识,我们需要向 Prometheus 提出的最终查询是
sum(rate(istio_requests_total{reporter="destination",
destination_service="worker-service.default.svc.cluster.local",
source_workload="frontend-deployment"}[15s])) by (source_workload,
source_app, destination_service)
现在,我们可以使用其 HTTP API 来获取相应指标。
我们可以通过发出如下所示的 HTTP GET 请求,使用查询来查询其 API。将 <prometheus-ip-here> 替换为
curl http://<prometheus-ip-here>/api/v1/query?query=sum\(rate\(istio_requests_total%7Breporter%3D%22destination%22%2C%0Adestination_service%3D%22worker-service.default.svc.cluster.local%22%2C%0Asource_workload%3D%22frontend-deployment%22%7D%5B15s%5D\)\)%20by%20\(source_workload%2C%0Asource_app%2C%20destination_service\)
以下是示例回答:
{
    "status": "success",
    "data": {
        "resultType": "vector",
        "result": [
            {
                "metric": {
                    "destination_service": "worker-service.default.svc.cluster.local",
                    "source_app": "frontend",
                    "source_workload": "frontend-deployment"
                },
                "value": [
                    1544404907.503,
                    "18.892886390062788"
                ]
            }
        ]
    }
}
现在,我们可以从 JSON 中提取指标值
清理
我们需要删除刚刚用于公开 Prometheus 的服务。在 Google Cloud 控制台中,前往我们刚刚创建的服务的顶部,然后点击“删除”
后续步骤:
我们已经找到了一种方法来发现流量在集群中的流动方式和速率,下一步是编写一个定期查询 Prometheus 的小型二进制文件,如果对 worker 的每秒请求数超过某个阈值,则在工作器虚拟服务上应用不同的目标权重,以将所有流量发送到 burst 集群。一旦每秒请求数低于下限,就将所有流量重新发送到 primary。
17. 创建跨集群突发
设置
将工作服务的所有流量都设置为主集群
我们会将所有以 worker-service 为目的地的流量路由到 primary 集群,视为应用的“默认”状态
修改 $proj/istio-manifests/worker-virtualservice.yaml,使其如下所示
apiVersion: networking.istio.io/v1alpha3
kind: VirtualService
metadata:
  name: worker-virtual-service
spec:
  hosts:
  - worker-service
  gateways:
  - mesh
  http:
  - route:
    - destination:
        host: worker-service.default.svc.cluster.local
        subset: primary
        port:
          number: 80
      weight: 100
    - destination:
        host: worker-service.default.svc.cluster.local
        subset: burst
        port:
          number: 80
      weight: 0
---
apiVersion: networking.istio.io/v1alpha3
kind: DestinationRule
metadata:
  name: worker-destination-rule
spec:
  host: worker-service
  trafficPolicy:
    loadBalancer:
      simple: RANDOM
  subsets:
  - name: primary
    labels:
      cluster-type: primary-cluster
  - name: burst
    labels:
     cluster-type: burst-cluster
确保您已连接到 primary 集群
kubectx primary
应用 istio-manifests/worker-virtualservice.yaml
kubectl apply -f istio-manifests/worker-virtualservice.yaml
编写了 istiowatcher 守护程序
我们将使用 Go 来编写此服务,因为该语言具有速度快、可移植性强的特点。应用的总体流程是启动并每秒查询一次 Prometheus,
在 src 中新建一个名为 istiowatcher 的目录
mkdir -p ${proj}/src/istiowatcher && cd ${proj}/src/istiowatcher
我们将从容器内调用 istioctl,以便从集群内操纵 Istio 控制平面。
编写了 istiowatcher.go
在该目录中创建一个名为 istiowatcher.go 的文件,并将以下内容插入其中
package main

import (
        "github.com/tidwall/gjson"
        "io/ioutil"
        "log"
        "net/http"
        "os/exec"
        "time"
)

func main() {
        //These are in requests per second
        var targetLow float64 = 10
        var targetHigh float64 = 15
        // This is for the ticker in milliseconds
        ticker := time.NewTicker(1000 * time.Millisecond)

        isBurst := false

        // Our prometheus query
        reqQuery := `/api/v1/query?query=sum(rate(istio_requests_total{reporter="destination",destination_service="worker-service.default.svc.cluster.local",source_workload="frontend-deployment"}[15s]))by(source_workload,source_app,destination_service)`

        for t := range ticker.C {
                log.Printf("Checking Prometheus at %v", t)

                // Check prometheus
                // Note that b/c we are querying over the past 5 minutes, we are getting a very SLOW ramp of our reqs/second
                // If we wanted this to be a little "snappier" we can scale it down to say 30s
                resp, err := http.Get("http://prometheus.istio-system.svc.cluster.local:9090" + reqQuery)
                if err != nil {
                        log.Printf("Error: %v", err)
                        continue
                }
                defer resp.Body.Close()
                body, _ := ioutil.ReadAll(resp.Body)

                val := gjson.Get(string(body), "data.result.0.value.1")
                log.Printf("Value: %v", val)

                currentReqPerSecond := val.Float()
                log.Printf("Reqs per second %f", currentReqPerSecond)

                if currentReqPerSecond > targetHigh && !isBurst {
                        applyIstio("burst.yaml")
                        log.Println("Entering burst mode")
                        isBurst = true
                } else if currentReqPerSecond < targetLow && isBurst {
                        applyIstio("natural.yaml")
                        log.Println("Returning to natural state.")
                        isBurst = false
                }
        }
}

func applyIstio(filename string) {
        cmd := exec.Command("istioctl", "replace", "-f", filename)
        if err := cmd.Run(); err != nil {
                log.Printf("Error hit applying istio manifests: %v", err)
        }
}
编写 Dockerfile
创建一个名为 Dockerfile 的新文件,并将以下内容插入其中。
FROM golang:1.11.2-stretch as base

FROM base as builder

WORKDIR /workdir
RUN curl -LO https://github.com/istio/istio/releases/download/1.0.0/istio-1.0.0-linux.tar.gz
RUN tar xzf istio-1.0.0-linux.tar.gz
RUN cp istio-1.0.0/bin/istioctl ./istioctl

FROM base

WORKDIR /go/src/istiowatcher
COPY . .
COPY --from=builder /workdir/istioctl /usr/local/bin/istioctl

RUN go get -d -v ./...
RUN go install -v ./...

CMD ["istiowatcher"]
此多阶段 Dockerfile 在第一阶段下载并提取 Istio 1.0.0 版本。第二阶段将我们目录中的所有内容复制到映像中,然后将 istioctl 从构建阶段复制到 /usr/local/bin(以便我们的应用可以调用它),获取依赖项,编译代码并将 CMD 设置为“istiowatcher”
编写 burst.yaml
当从 frontend 到 worker 的每秒请求数超过 15 时,istiowatcher 将应用此文件。
创建一个名为 burst.yaml 的新文件,并将以下内容插入其中。
apiVersion: networking.istio.io/v1alpha3
kind: VirtualService
metadata:
 name: worker-virtual-service
spec:
 hosts:
 - worker-service
 gateways:
 - mesh
 http:
 - route:
   - destination:
       host: worker-service.default.svc.cluster.local
       subset: primary
       port:
         number: 80
     weight: 0
   - destination:
       host: worker-service.default.svc.cluster.local
       subset: burst
       port:
         number: 80
     weight:  100
写入 natural.yaml
当每秒来自 frontend 到 worker 的请求数降至 10 以下时,我们会将此状态视为“自然”状态。在此状态下,100% 的流量会路由到 primary 集群。
创建一个名为 natural.yaml 的新文件,并将以下内容插入其中
apiVersion: networking.istio.io/v1alpha3
kind: VirtualService
metadata:
 name: worker-virtual-service
spec:
 hosts:
 - worker-service
 gateways:
 - mesh
 http:
 - route:
   - destination:
       host: worker-service.default.svc.cluster.local
       subset: primary
       port:
         number: 80
     weight: 100
   - destination:
       host: worker-service.default.svc.cluster.local
       subset: burst
       port:
         number: 80
     weight: 0
构建并推送 istiowatcher
运行以下命令,将当前目录发送到 Google Cloud Build (GCB),后者将在 GCR 中构建并标记映像。
gcloud builds submit -t gcr.io/${GCLOUD_PROJECT}/istiowatcher
部署 istiowatcher
切换到 kubernetes 目录
cd ${proj}/kubernetes/
编写部署文件:istiowatcher.yaml
创建一个名为 istiowatcher.yaml 的文件,并插入以下内容(替换 <your-project-id>)。
apiVersion: extensions/v1beta1
kind: Deployment
metadata:
  name: istiowatcher-deployment
  labels:
    app: istiowatcher
spec:
  replicas: 1
  selector:
    matchLabels:
      app: istiowatcher
  template:
    metadata:
      labels:
        app: istiowatcher
    spec:
      serviceAccountName: istio-pilot-service-account
      automountServiceAccountToken: true
      containers:
      - name: istiowatcher
        image: gcr.io/<your-project-id>/istiowatcher
        imagePullPolicy: Always
部署
确保我们在主集群中运行
kubectx primary
在 istio-system 命名空间中部署 istiowatcher.yaml
kubectl apply -n istio-system -f istiowatcher.yaml
请务必注意 YAML 中的 serviceAccountName 和 automountServiceAccountToken 指令。这样,我们便获得了从集群内部运行 istioctl 所需的凭据。
我们还需要在 istio-system 命名空间内部署此内容,以确保我们拥有 istio-pilot-service-account 的凭据。(它在 default 命名空间中不存在)。
观看流量自动切换!
现在,激动人心的时刻到了!我们前往前端,将每秒请求数提升到 20
请注意,此过程需要几秒钟时间,但我们会逐渐增加哈希值,并且所有哈希值都带有“bursty-”前缀!
这是因为我们是在 15s 范围内对 Prometheus 进行抽样,这会导致我们的响应时间略有延迟。如果我们想要更窄的频段,可以将对 Prometheus 的查询更改为 5s.
18. 接下来做什么?
清理
如果您使用的是为此研讨会提供的临时账号,则无需清理。
您可以删除 Kubernetes 集群、防火墙规则和 GCR 中的映像
gcloud container clusters delete primary --zone=us-west1-a
gcloud container clusters delete burst --zone=us-west1-a
gcloud compute firewall-rules delete istio-multicluster-test-pods
gcloud container images delete gcr.io/$GCLOUD_PROJECT/istiowatcher
展望未来
- 参加一些 Istio 讲座!
- 获取认证:使用 Kubernetes + Istio 构建您的下一个应用
- 主旨演讲:Kubernetes、Istio、Knative:全新的开放云堆栈 - Aparna Sinha,Google 组合产品经理
- 教程:使用 Istio - Lee Calcote 和 Girish Ranganathan,SolarWinds
- Istio - 数据包视角 - Matt Turner,Tetrate
- Istio 是有史以来最先进的下一代防火墙吗?- John Morello,Twistlock
- 阅读 Istio 文档
- 加入 Istio 工作组
- 在 Twitter 上关注 @IstioMesh