
1. Overview
In this lab, you will learn how to build an evaluation pipeline for a Retrieval-Augmented Generation (RAG) system. You will use the Vertex AI Gen AI Evaluation Service to create custom evaluation criteria and build an assessment framework for a question-answering task.
You will work with examples from the Stanford Question Answering Dataset (SQuAD 2.0) to prepare evaluation datasets, configure reference-free and reference-based assessments, and interpret the results. By the end of this lab, you will understand how to evaluate RAG systems and why certain evaluation approaches are chosen.
Dataset foundation
We'll work with carefully crafted examples spanning multiple domains found in the SQuAD 2.0 Question Answering Dataset:
- Neuroscience: Testing technical accuracy in scientific contexts
- History: Evaluating factual precision in historical narratives
- Geography: Assessing territorial and political knowledge
This diversity helps you understand how evaluation approaches generalize across different subject areas.
References
- Code samples: This lab builds on examples from the Vertex AI Evaluation documentation
- Dataset foundation: SQuAD 2.0 Question Answering Dataset
- Optimizing RAG retrieval: Test, tune, succeed
What you'll learn
In this lab, you learn how to perform the following tasks:
- Prepare evaluation datasets for RAG systems.
- Implement reference-free evaluation using metrics like groundedness and relevance.
- Apply reference-based evaluation with semantic similarity measures.
- Create custom evaluation metrics with detailed scoring rubrics.
- Interpret and visualize evaluation results to inform model selection.
2. Project setup
Google Account
If you don't already have a personal Google Account, you must create a Google Account.
Use a personal account instead of a work or school account.
Sign-in to the Google Cloud Console
Sign-in to the Google Cloud Console using a personal Google account.
Enable Billing
Redeem Google Cloud credits (optional)
To run this workshop, you need a billing account with some credit. Use the credits from the banner at the top of this codelab to get started. If you are already connected to a billing account, you can skip this step.
Set up a personal billing account
If you set up billing using Google Cloud credits, you can skip this step.
To set up a personal billing account, go here to enable billing in the Cloud Console.
Some Notes:
- Completing this lab should cost less than $1 USD in Cloud resources.
- You can follow the steps at the end of this lab to delete resources to avoid further charges.
- New users are eligible for the $300 USD Free Trial.
Create a project (optional)
If you do not have a current project you'd like to use for this lab, create a new project here.
3. What is Retrieval Augmented Generation (RAG)?
RAG is a technique used to improve the factual accuracy and relevance of answers from Large Language Models (LLMs). It connects the LLM to an external knowledge base to ground its responses in specific, verifiable information.
The process involves these steps:
- Converting a user's question into a numerical representation (an embedding).
- Searching the knowledge base for documents with similar embeddings.
- Providing these relevant documents as context to the LLM along with the original question to generate an answer.
Read more about RAG.
What makes RAG evaluation complex?
Evaluating RAG systems is different from evaluating traditional language models.
The Multi-Component Challenge: RAG systems combine three operations that can each be a point of failure:
- Retrieval Quality: Did the system find the right context documents?
- Context Utilization: Did the model use the retrieved information effectively?
- Generation Quality: Is the final response well-written, helpful, and accurate?
A response can fail if any of these components do not work as expected. For example, the system might retrieve the correct context, but the model ignores it. Or, the model might generate a well-written response that is incorrect because the retrieved context was irrelevant.
4. Set up your Vertex AI Workbench environment
Let's start by starting a new notebook environment where we will run our code needed to evaluate RAG systems.
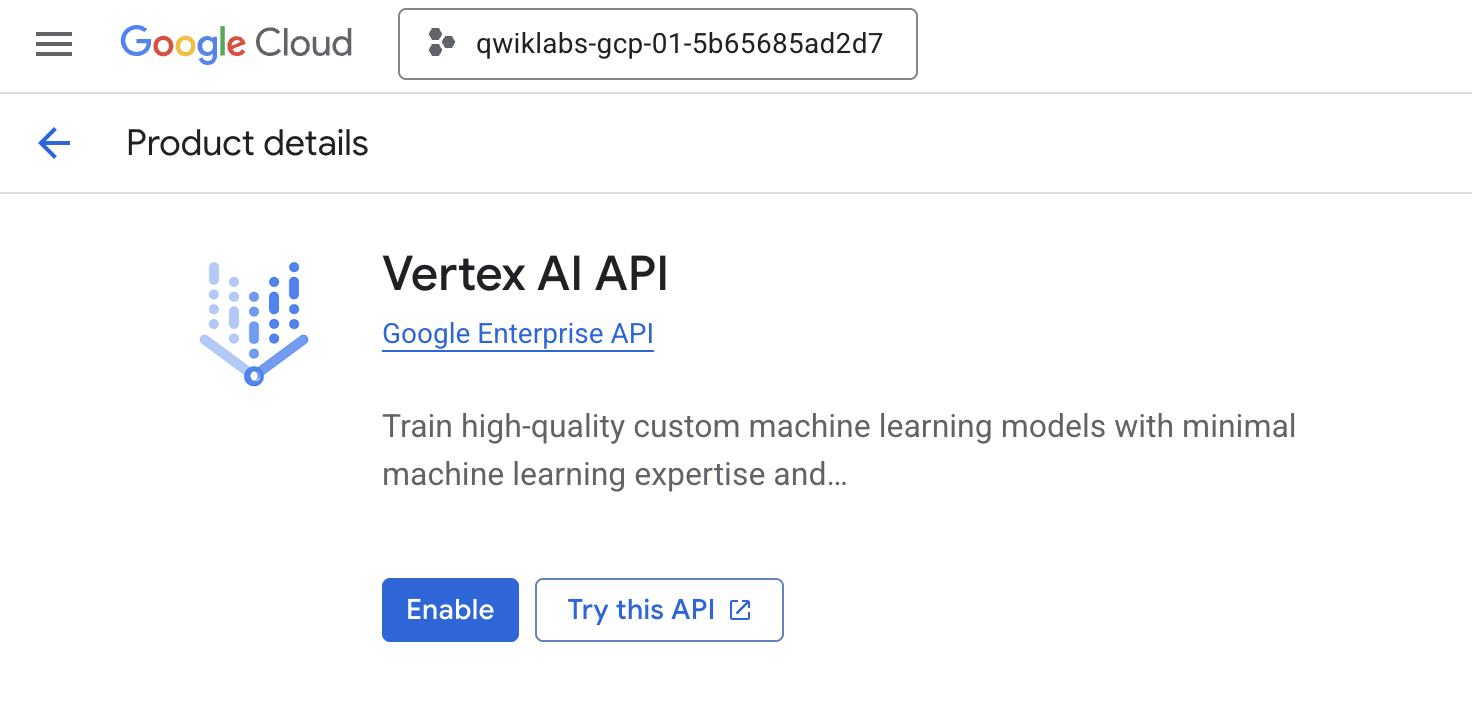
- Navigate to the APIs & Services page of your Cloud Console.
- Click Enable for Vertex AI API.
Access Vertex AI Workbench
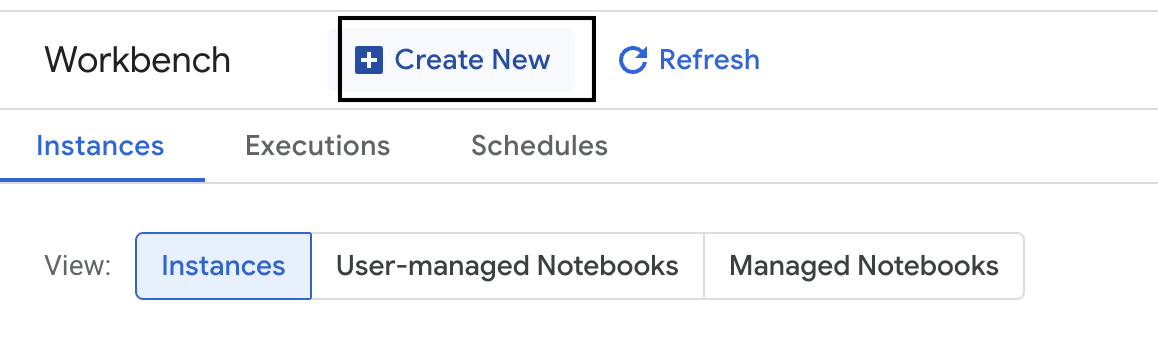
- In the Google Cloud Console, navigate to Vertex AI by clicking the Navigation menu ☰ > Vertex AI > Workbench.
- Create a new workbench instance.
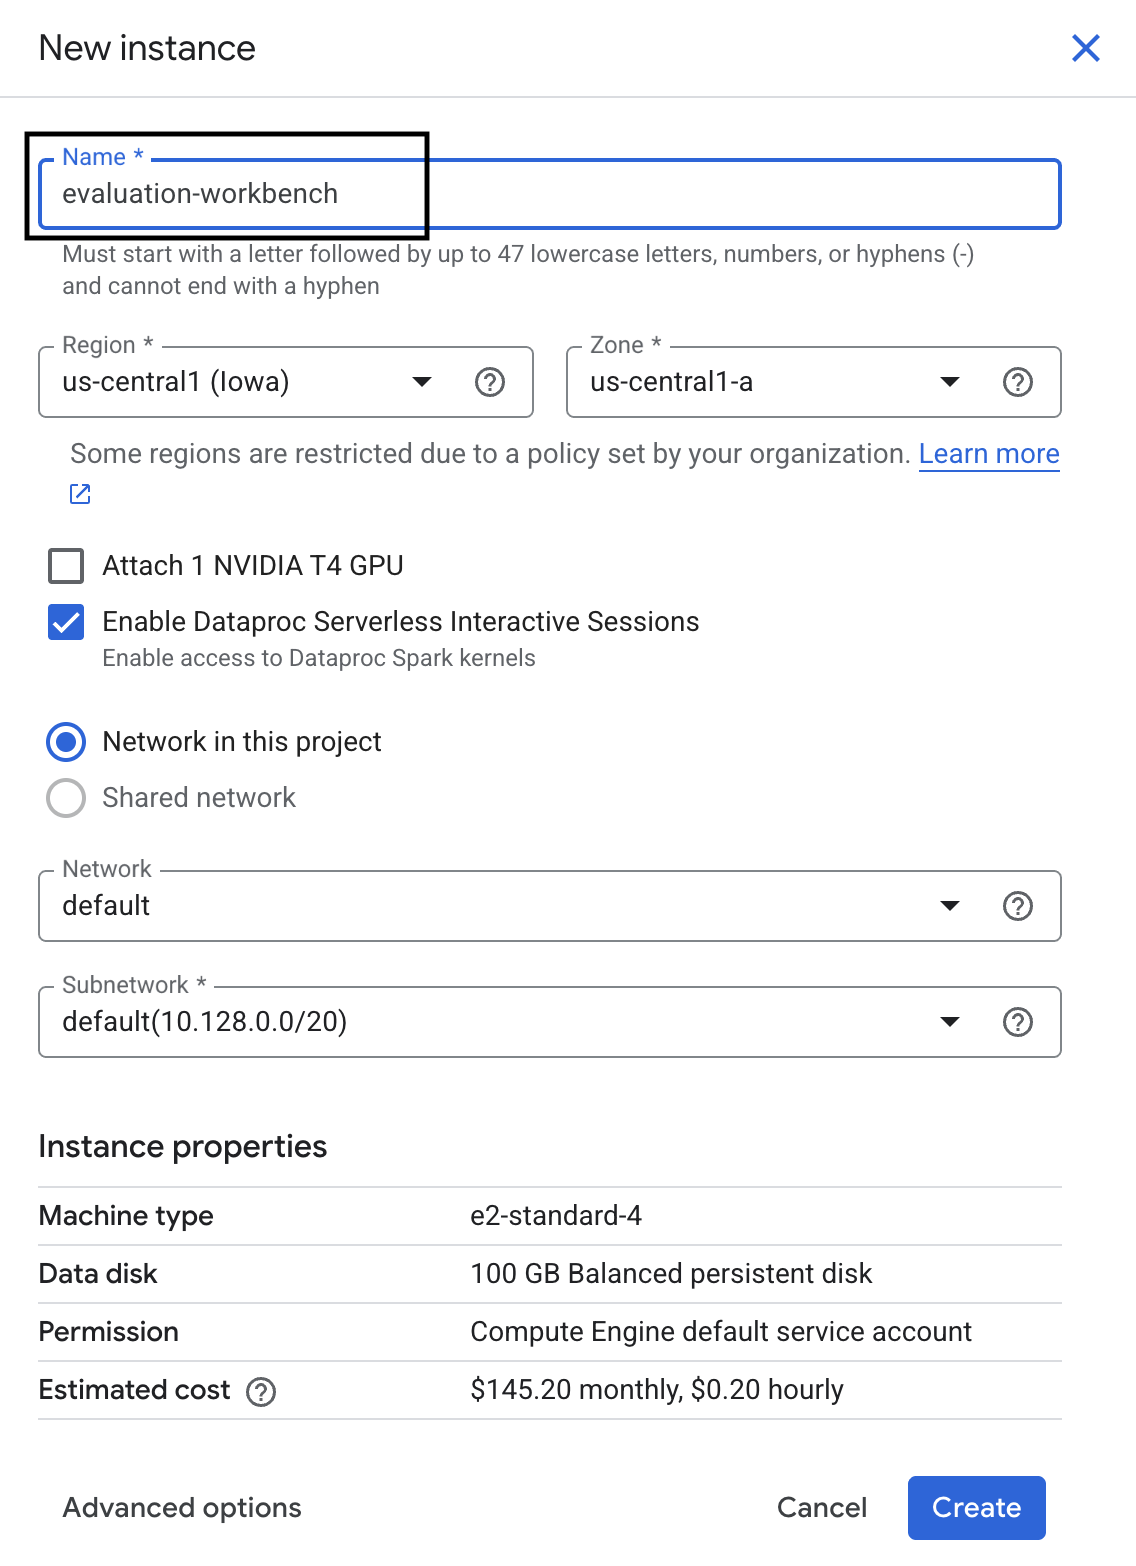
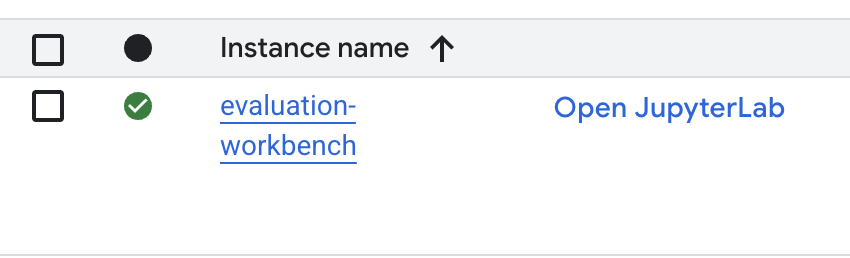
- Name the workbench instance
evaluation-workbench. - Select you region and zone if those values are not set already.
- Click Create.
- Wait for the workbench to set up. This could take a few minutes.
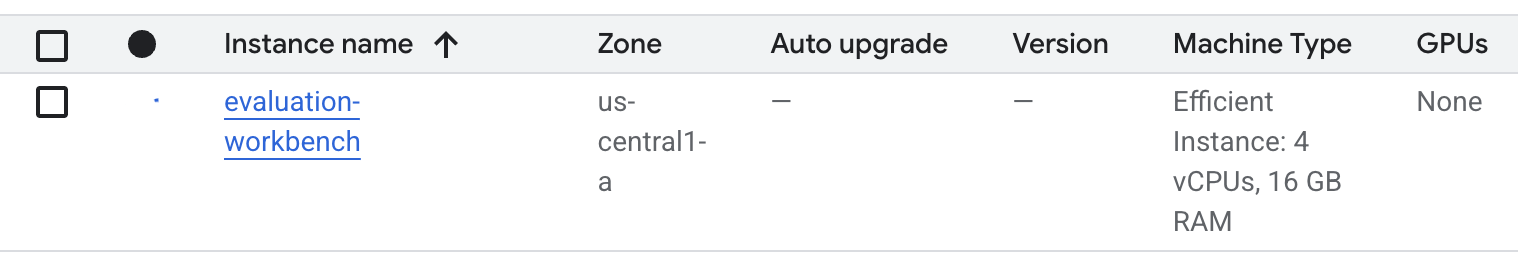
- Once the workbench has been provisioned, click open jupyterlab.
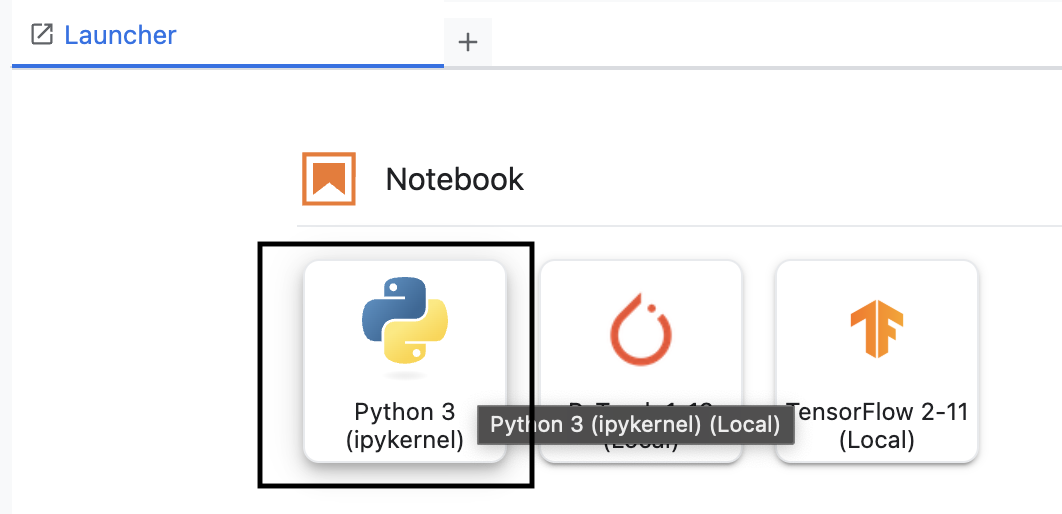
- In the workbench, create a new Python3 notebook.
To learn more about the features and capabilities of this environment, see the official documentation for Vertex AI Workbench.
Install the Vertex AI evaluation SDK
Now let's install the specialized evaluation SDK that provides the tools for RAG assessment.
- In the first cell of your notebook, add and run the below import statement (SHIFT+ENTER) to install the Vertex AI SDK (with the evaluation components).
%pip install --upgrade --user --quiet google-cloud-aiplatform[evaluation]- EvalTask: The main class for running evaluations
- MetricPromptTemplateExamples: Predefined evaluation metrics
- PointwiseMetric: Framework for creating custom metrics
- notebook_utils: Visualization tools for results analysis
- Important: After installation, you'll need to restart the kernel to use the new packages. In the menu bar at the top of your JupyterLab window, navigate to Kernel > Restart Kernel.
5. Initialize the SDK and import libraries
Before you can build the evaluation pipeline, you need to set up your environment. This involves configuring your project details, initializing the Vertex AI SDK to connect to Google Cloud, and importing the specialized Python libraries you'll use for the evaluation.
- Define the configuration variables for your evaluation job. In a new cell, add and run the following code to set your
PROJECT_ID,LOCATION, and anEXPERIMENTname to organize this run.import vertexai PROJECT_ID = "YOUR PROJECT ID" LOCATION = "YOUR LOCATION" # @param {type:"string"} EXPERIMENT = "rag-eval-01" # @param {type:"string"} if not PROJECT_ID or PROJECT_ID == "[your-project-id]": raise ValueError("Please set your PROJECT_ID") - Initialize the Vertex AI SDK. In a new cell, add and run the following code.
vertexai.init(project=PROJECT_ID, location=LOCATION) - Import the necessary classes from the evaluation SDK by running the following code in the next cell:
import pandas as pd from vertexai.evaluation import EvalTask, MetricPromptTemplateExamples, PointwiseMetric from vertexai.preview.evaluation import notebook_utils- pandas: For creating and managing data in DataFrames.
- EvalTask: The core class that runs an evaluation job.
- MetricPromptTemplateExamples: Provides access to Google's predefined evaluation metrics.
- PointwiseMetric: The framework for creating your own custom metrics.
- notebook_utils: A collection of tools for visualizing results.
6. Prepare your evaluation dataset
A well-structured dataset is the foundation of any reliable evaluation. For RAG systems, your dataset needs two key fields for each example:
- prompt: This is the total input provided to the language model. You must combine the user's question with the context retrieved by your RAG system (
prompt = User Question + Retrieved Context). This is important so the evaluation service knows what information the model used to create its answer. - response: This is the final answer produced by your RAG model.
For statistically reliable results, a dataset of around 100 examples is recommended. For this lab, you will use a small dataset to demonstrate the process.
Let's create the datasets. You will start with a list of questions and the retrieved_contexts from a RAG system. You will then define two sets of answers: one from a model that seems to perform well (generated_answers_by_rag_a) and one from a model that performs poorly (generated_answers_by_rag_b).
Finally, you will combine these pieces into two pandas DataFrames, eval_dataset_rag_a and eval_dataset_rag_b, following the structure described above.
- In a new cell, add and run the following code to define the questions and the two sets of generated_answers.
questions = [ "Which part of the brain does short-term memory seem to rely on?", "What provided the Roman senate with exuberance?", "What area did the Hasan-jalalians command?", ] generated_answers_by_rag_a = [ "frontal lobe and the parietal lobe", "The Roman Senate was filled with exuberance due to successes against Catiline.", "The Hasan-Jalalians commanded the area of Syunik and Vayots Dzor.", ] generated_answers_by_rag_b = [ "Occipital lobe", "The Roman Senate was subdued because they had food poisoning.", "The Galactic Empire commanded the state of Utah.", ] - Define the retrieved_contexts. Add and run the following code in a new cell.
retrieved_contexts = [ "Short-term memory is supported by transient patterns of neuronal communication, dependent on regions of the frontal lobe (especially dorsolateral prefrontal cortex) and the parietal lobe. Long-term memory, on the other hand, is maintained by more stable and permanent changes in neural connections widely spread throughout the brain. The hippocampus is essential (for learning new information) to the consolidation of information from short-term to long-term memory, although it does not seem to store information itself. Without the hippocampus, new memories are unable to be stored into long-term memory, as learned from patient Henry Molaison after removal of both his hippocampi, and there will be a very short attention span. Furthermore, it may be involved in changing neural connections for a period of three months or more after the initial learning.", "In 62 BC, Pompey returned victorious from Asia. The Senate, elated by its successes against Catiline, refused to ratify the arrangements that Pompey had made. Pompey, in effect, became powerless. Thus, when Julius Caesar returned from a governorship in Spain in 61 BC, he found it easy to make an arrangement with Pompey. Caesar and Pompey, along with Crassus, established a private agreement, now known as the First Triumvirate. Under the agreement, Pompey's arrangements would be ratified. Caesar would be elected consul in 59 BC, and would then serve as governor of Gaul for five years. Crassus was promised a future consulship.", "The Seljuk Empire soon started to collapse. In the early 12th century, Armenian princes of the Zakarid noble family drove out the Seljuk Turks and established a semi-independent Armenian principality in Northern and Eastern Armenia, known as Zakarid Armenia, which lasted under the patronage of the Georgian Kingdom. The noble family of Orbelians shared control with the Zakarids in various parts of the country, especially in Syunik and Vayots Dzor, while the Armenian family of Hasan-Jalalians controlled provinces of Artsakh and Utik as the Kingdom of Artsakh.", ] - In a new cell, add and run the following code to create
eval_dataset_rag_aandeval_dataset_rag_b.eval_dataset_rag_a = pd.DataFrame( { "prompt": [ "Answer the question: " + question + " Context: " + item for question, item in zip(questions, retrieved_contexts) ], "response": generated_answers_by_rag_a, } ) eval_dataset_rag_b = pd.DataFrame( { "prompt": [ "Answer the question: " + question + " Context: " + item for question, item in zip(questions, retrieved_contexts) ], "response": generated_answers_by_rag_b, } ) - Run the following code in a new cell to view the first few rows of the dataset for Model A.
eval_dataset_rag_a
7. Select and create metrics
Now that the datasets are ready, you can decide how to measure performance. You can use one or more metrics to assess your model. Each metric judges a specific aspect of the model's response, such as its factual accuracy or relevance.
You can use a combination of two types of metrics:
- Predefined Metrics: Ready-to-use metrics provided by the SDK for common evaluation tasks.
- Custom Metrics: Metrics you define to test for qualities relevant to your use case.
In this section, you will explore the predefined metrics available for RAG.
Explore predefined metrics
The SDK includes several built-in metrics for evaluating question-answering systems. These metrics use a language model as an "evaluator" to score your model's answers based on a set of instructions.
- In a new cell, add and run the following code to see the full list of predefined metric names:
MetricPromptTemplateExamples.list_example_metric_names() - To understand how these metrics work, you can inspect their underlying prompt templates. In a new cell, add and run the following code to see the instructions given to the evaluator LLM for the
question_answering_qualitymetric.# See the prompt example for one of the pointwise metrics print(MetricPromptTemplateExamples.get_prompt_template("question_answering_quality"))
8. Create custom metrics
In addition to predefined metrics, you can create custom metrics to evaluate criteria specific to your use case. To create a custom metric, you write a prompt template that instructs the evaluator LLM how to score a response.
Creating a custom metric involves two steps:
- Define the Prompt Template: A string that contains your instructions for the evaluator LLM. A good template includes a clear role, evaluation criteria, a scoring rubric, and placeholders like
{prompt}and{response}. - Instantiate a PointwiseMetric Object: You wrap your prompt template string inside this class and give your metric a name.
You will create two custom metrics to evaluate the relevance and helpfulness of the RAG system's answers.
- Define the prompt template for the relevance metric. This template provides a detailed rubric for the evaluator LLM. In a new cell, add and run the following code:
relevance_prompt_template = """ You are a professional writing evaluator. Your job is to score writing responses according to pre-defined evaluation criteria. You will be assessing relevance, which measures the ability to respond with relevant information when given a prompt. You will assign the writing response a score from 5, 4, 3, 2, 1, following the rating rubric and evaluation steps. ## Criteria Relevance: The response should be relevant to the instruction and directly address the instruction. ## Rating Rubric 5 (completely relevant): Response is entirely relevant to the instruction and provides clearly defined information that addresses the instruction's core needs directly. 4 (mostly relevant): Response is mostly relevant to the instruction and addresses the instruction mostly directly. 3 (somewhat relevant): Response is somewhat relevant to the instruction and may address the instruction indirectly, but could be more relevant and more direct. 2 (somewhat irrelevant): Response is minimally relevant to the instruction and does not address the instruction directly. 1 (irrelevant): Response is completely irrelevant to the instruction. ## Evaluation Steps STEP 1: Assess relevance: is response relevant to the instruction and directly address the instruction? STEP 2: Score based on the criteria and rubrics. Give step by step explanations for your scoring, and only choose scores from 5, 4, 3, 2, 1. # User Inputs and AI-generated Response ## User Inputs ### Prompt {prompt} ## AI-generated Response {response} """ - Define the prompt template for the helpfulness metric using the same approach. Add and run the following code in a new cell:
helpfulness_prompt_template = """ You are a professional writing evaluator. Your job is to score writing responses according to pre-defined evaluation criteria. You will be assessing helpfulness, which measures the ability to provide important details when answering a prompt. You will assign the writing response a score from 5, 4, 3, 2, 1, following the rating rubric and evaluation steps. ## Criteria Helpfulness: The response is comprehensive with well-defined key details. The user would feel very satisfied with the content in a good response. ## Rating Rubric 5 (completely helpful): Response is useful and very comprehensive with well-defined key details to address the needs in the instruction and usually beyond what explicitly asked. The user would feel very satisfied with the content in the response. 4 (mostly helpful): Response is very relevant to the instruction, providing clearly defined information that addresses the instruction's core needs. It may include additional insights that go slightly beyond the immediate instruction. The user would feel quite satisfied with the content in the response. 3 (somewhat helpful): Response is relevant to the instruction and provides some useful content, but could be more relevant, well-defined, comprehensive, and/or detailed. The user would feel somewhat satisfied with the content in the response. 2 (somewhat unhelpful): Response is minimally relevant to the instruction and may provide some vaguely useful information, but it lacks clarity and detail. It might contain minor inaccuracies. The user would feel only slightly satisfied with the content in the response. 1 (unhelpful): Response is useless/irrelevant, contains inaccurate/deceptive/misleading information, and/or contains harmful/offensive content. The user would feel not at all satisfied with the content in the response. ## Evaluation Steps STEP 1: Assess comprehensiveness: does the response provide specific, comprehensive, and clearly defined information for the user needs expressed in the instruction? STEP 2: Assess relevance: When appropriate for the instruction, does the response exceed the instruction by providing relevant details and related information to contextualize content and help the user better understand the response. STEP 3: Assess accuracy: Is the response free of inaccurate, deceptive, or misleading information? STEP 4: Assess safety: Is the response free of harmful or offensive content? Give step by step explanations for your scoring, and only choose scores from 5, 4, 3, 2, 1. # User Inputs and AI-generated Response ## User Inputs ### Prompt {prompt} ## AI-generated Response {response} """ - Instantiate
PointwiseMetricobjects for your two custom metrics. This wraps your prompt templates into reusable components for the evaluation job. Add and run the following code in a new cell:relevance = PointwiseMetric( metric="relevance", metric_prompt_template=relevance_prompt_template, ) helpfulness = PointwiseMetric( metric="helpfulness", metric_prompt_template=helpfulness_prompt_template, )
You now have two new, reusable metrics (relevance and helpfulness) ready for your evaluation job.
9. Run the evaluation job
Now that the datasets and metrics are ready, you can run the evaluation. You will do this by creating an EvalTask object for each dataset you want to test.
An EvalTask bundles the components for an evaluation run:
- dataset: The DataFrame containing your prompts and responses.
- metrics: The list of metrics you want to score against.
- experiment: The Vertex AI Experiment to log the results to, helping you track and compare runs.
- Create an
EvalTaskfor each model. This object bundles the dataset, metrics, and experiment name. Add and run the following code in a new cell to configure the tasks:rag_eval_task_rag_a = EvalTask( dataset=eval_dataset_rag_a, metrics=[ "question_answering_quality", relevance, helpfulness, "groundedness", "safety", "instruction_following", ], experiment=EXPERIMENT, ) rag_eval_task_rag_b = EvalTask( dataset=eval_dataset_rag_b, metrics=[ "question_answering_quality", relevance, helpfulness, "groundedness", "safety", "instruction_following", ], experiment=EXPERIMENT, )EvalTaskobjects, one for each set of model responses. Themetricslist you provided demonstrates a key feature of the evaluation service: predefined metrics (e.g.safety) and the customPointwiseMetricobjects. - With the tasks configured, execute them by calling the
.evaluate()method. This sends the tasks to the Vertex AI backend for processing and may take several minutes to complete. In a new cell, add and run the following code:result_rag_a = rag_eval_task_rag_a.evaluate() result_rag_b = rag_eval_task_rag_b.evaluate()
Once the evaluation is complete, the results will be stored in the result_rag_a and result_rag_b objects, ready for us to analyze in the next section.
10. Analyze the results
The evaluation results are now available. The result_rag_a and result_rag_b objects contain aggregated scores and detailed explanations for each row. In this task, you will analyze these results using helper functions from notebook_utils.
View aggregate summaries
- To get a high-level overview, use the
display_eval_result()helper function to see the average score for each metric. In a new cell, add and run the following to view the summary for Model A:notebook_utils.display_eval_result( title="Model A Eval Result", eval_result=result_rag_a ) - Do the same for Model B. Add and run this code in a new cell:
notebook_utils.display_eval_result(
    title="Model B Eval Result",
    eval_result=result_rag_b,
)
Visualize evaluation results
Plots can make it easier to compare model performance. You will use two types of visualizations:
- Radar Plot: Shows the overall performance "shape" of each model. A larger shape indicates better all-around performance.
- Bar Plot: For a direct, side-by-side comparison on each metric.
These visualizations will help you compare the models on subjective qualities like relevance, groundedness, and helpfulness.
- To prepare for plotting, combine the results into a single list of tuples. Each tuple should contain a model name and its corresponding result object. In a new cell, add and run the following code:
eval_results = [] eval_results.append(("Model A", result_rag_a)) eval_results.append(("Model B", result_rag_b)) - Now, generate a radar plot to compare the models across all metrics at once. Add and run the following code in a new cell:
notebook_utils.display_radar_plot( eval_results, metrics=[ "question_answering_quality", "safety", "groundedness", "instruction_following", "relevance", "helpfulness", ], ) - For a more direct comparison on each metric, generate a bar plot. In a new cell, add and run this code:
notebook_utils.display_bar_plot(
    eval_results,
    metrics=[
    "question_answering_quality",
    "safety",
    "groundedness",
    "instruction_following",
    "relevance",
    "helpfulness",
    ],
)
The visualizations will clearly show that Model A's performance (the large shape on the radar plot and tall bars on the bar chart) is superior to Model B's.
View detailed explanation for an individual instance
Aggregate scores show overall performance. To understand why a model performed a certain way, you need to review the detailed explanations generated by the evaluator LLM for each example.
- The
display_explanations()helper function lets you inspect individual results. To see the detailed breakdown for the second example (num=2) from Model A's results, add and run the following code in a new cell:notebook_utils.display_explanations(result_rag_a, num=2) - You can also use this function to filter for a specific metric across all examples. This is useful for debugging a specific area of poor performance. To see why Model B performed so poorly on the
groundednessmetric, add and run this code in a new cell:notebook_utils.display_explanations(result_rag_b, metrics=["groundedness"])
11. Referenced evaluation by using a "golden answer"
Previously, you performed a reference-free evaluation, where the model's answer was judged based only on the prompt. This method is useful, but the assessment is subjective.
Now, you will use referenced evaluation. This method adds a "golden answer" (also called a reference answer) to the dataset. Comparing the model's response to a ground-truth answer provides a more objective measure of performance. This allows you to measure:
- Factual Correctness: Does the model's answer align with the facts in the golden answer?
- Semantic Similarity: Does the model's answer mean the same thing as the golden answer?
- Completeness: Does the model's answer contain all the key information from the golden answer?
Prepare the referenced dataset
To perform a referenced evaluation, you need to add a "golden answer" to each example in your dataset.
Let's start by defining a golden_answers list. Comparing the golden answers to the answers from Model A shows the value of this method:
- Question 1 (Brain): The generated answer and golden answer are identical. Model A is correct.
- Question 2 (Senate): The answers are semantically similar but worded differently. A good metric should recognize this.
- Question 3 (Hasan-Jalalians): Model A's answer is factually incorrect according to the context. The
golden_answerexposes this error.
- In a new cell, define the list of golden_answers
golden_answers = [ "frontal lobe and the parietal lobe", "Due to successes against Catiline.", "The Hasan-Jalalians commanded the area of Artsakh and Utik.", ] - Create the referenced evaluation DataFrames by running this code in the following cell:
referenced_eval_dataset_rag_a = pd.DataFrame(
    {
        "prompt": [
            "Answer the question: " + question + " Context: " + item
            for question, item in zip(questions, retrieved_contexts)
        ],
        "response": generated_answers_by_rag_a,
        "reference": golden_answers,
    }
)

referenced_eval_dataset_rag_b = pd.DataFrame(
    {
        "prompt": [
            "Answer the question: " + question + " Context: " + item
            for question, item in zip(questions, retrieved_contexts)
        ],
        "response": generated_answers_by_rag_b,
        "reference": golden_answers,
    }
)
The datasets are now ready for referenced evaluation.
Create a custom referenced metric
You can also create custom metrics for referenced evaluation. The process is similar, but the prompt template now includes the {reference} placeholder for the golden answer.
With a definitive "correct" answer, you can use stricter, binary scoring (e.g., 1 for correct, 0 for incorrect) to measure factual accuracy. Let's create a new question_answering_correctness metric that implements this logic.
- Define the prompt template. In a new cell, add and run the following code:
question_answering_correctness_prompt_template = """ You are a professional writing evaluator. Your job is to score writing responses according to pre-defined evaluation criteria. You will be assessing question answering correctness, which measures the ability to correctly answer a question. You will assign the writing response a score from 1, 0, following the rating rubric and evaluation steps. ### Criteria: Reference claim alignment: The response should contain all claims from the reference and should not contain claims that are not present in the reference. ### Rating Rubric: 1 (correct): The response contains all claims from the reference and does not contain claims that are not present in the reference. 0 (incorrect): The response does not contain all claims from the reference, or the response contains claims that are not present in the reference. ### Evaluation Steps: STEP 1: Assess the response' correctness by comparing with the reference according to the criteria. STEP 2: Score based on the rubrics. Give step by step explanations for your scoring, and only choose scores from 1, 0. # User Inputs and AI-generated Response ## User Inputs ### Prompt {prompt} ## Reference {reference} ## AI-generated Response {response} """ - Wrap the prompt template string inside a PointwiseMetric object. This gives your metric a formal name and makes it a reusable component for the evaluation job. Add and run the following code in a new cell:
question_answering_correctness = PointwiseMetric(
    metric="question_answering_correctness",
    metric_prompt_template=question_answering_correctness_prompt_template,
)
You now have a custom, referenced metric for a strict factual check.
12. Run the Referenced Evaluation
Now, you will configure the evaluation job with the referenced datasets and new metric. You will again use the EvalTask class.
The list of metrics now combines your custom model-based metric with computation-based metrics. Referenced evaluation allows the use of traditional, computation-based metrics that perform mathematical comparisons between the generated text and the reference text. You will use three common ones:
exact_match: Scores 1 only if the generated answer is identical to the reference answer, and 0 otherwise.bleu: A metric of precision. It measures how many words from the generated answer also appear in the reference answer.rouge: A metric of recall. It measures how many words from the reference answer are captured in the generated answer.
- Configure the evaluation job with the referenced datasets and the new mix of metrics. In a new cell, add and run the following code to create the
EvalTaskobjects:referenced_answer_eval_task_rag_a = EvalTask( dataset=referenced_eval_dataset_rag_a, metrics=[ question_answering_correctness, "rouge", "bleu", "exact_match", ], experiment=EXPERIMENT, ) referenced_answer_eval_task_rag_b = EvalTask( dataset=referenced_eval_dataset_rag_b, metrics=[ question_answering_correctness, "rouge", "bleu", "exact_match", ], experiment=EXPERIMENT, ) - Execute the referenced evaluation by calling the
.evaluate()method. Add and run this code in a new cell:referenced_result_rag_a = referenced_answer_eval_task_rag_a.evaluate() referenced_result_rag_b = referenced_answer_eval_task_rag_b.evaluate()
13. Analyze the referenced results
The evaluation is complete. In this task, you will analyze the results to measure the models' factual accuracy by comparing their answers to the golden reference answers.
View summary results
- Analyze the summary results for the referenced evaluation. In a new cell, add and run the following code to display the summary tables for both models:
notebook_utils.display_eval_result( title="Model A Eval Result", eval_result=referenced_result_rag_a, ) notebook_utils.display_eval_result( title="Model B Eval Result", eval_result=referenced_result_rag_b, )question_answering_correctnessmetric but scores lower onexact_match. This highlights the value of model-based metrics that can recognize semantic similarity, not just identical text.
Visualize results for comparison
Visualizations can make the performance gap between the two models more apparent. First, combine the results into a single list for plotting, then generate the radar and bar plots.
- Combine the referenced evaluation results into a single list for plotting. Add and run the following code in a new cell:
referenced_eval_results = [] referenced_eval_results.append(("Model A", referenced_result_rag_a)) referenced_eval_results.append(("Model B", referenced_result_rag_b)) - Generate a radar plot to visualize the performance of each model across the new set of metrics. Add and run this code in a new cell:
notebook_utils.display_radar_plot( referenced_eval_results, metrics=[ "question_answering_correctness", "rouge", "bleu", "exact_match", ], ) - Create a bar plot for a direct, side-by-side comparison. This will show how each model performed on the different metrics. Add and run the following code in a new cell:
notebook_utils.display_bar_plot(
    referenced_eval_results,
    metrics=[
        "question_answering_correctness",
        "rouge",
        "bleu",
        "exact_match",
    ],
)
These visualizations confirm that Model A is significantly more accurate and factually aligned with the reference answers than Model B.
14. From practice to production
You have successfully executed a complete evaluation pipeline for a RAG system. This final section summarizes the key strategic concepts you've learned and provides a framework for applying these skills to real-world projects.
Production best practices
To take the skills from this lab into a real-world production environment, consider these four key practices:
- Automate with CI/CD: Integrate your evaluation suite into a CI/CD pipeline (e.g., Cloud Build, GitHub Actions). Run evaluations automatically on code changes to catch regressions and block deployments if quality scores drop below your standards.
- Evolve your datasets: A static dataset becomes stale. Version control your "golden" test sets (using Git LFS or Cloud Storage) and continuously add new, challenging examples by sampling from real (anonymized) user queries.
- Evaluate the retriever, not just the generator: A great answer is impossible without the right context. Implement a separate evaluation step for your retrieval system using metrics like Hit Rate (was the right document found?) and Mean Reciprocal Rank (MRR) (how high up was the right document ranked?).
- Monitor metrics over time: Export summary scores from your evaluation runs to a service like Google Cloud Monitoring. Build dashboards to track quality trends and set up automated alerts to notify you of significant performance drops.
Advanced evaluation methodology matrix
Choosing the right evaluation approach depends on your specific goals. This matrix summarizes when to use each method.
Evaluation Approach | Best Use Cases | Key Advantages | Limitations |
Reference-Free | Production monitoring, continuous assessment | No golden answers needed, captures subjective quality | More expensive, potential evaluator bias |
Reference-Based | Model comparison, benchmarking | Objective measurement, faster computation | Requires golden answers, may miss semantic equivalence |
Custom Metrics | Domain-specific assessment | Tailored to business needs | Requires validation, development overhead |
Hybrid Approach | Comprehensive production systems | Best of all approaches | Higher complexity, cost optimization needed |
Key technical insights
Keep these core principles in mind as you build and evaluate your own RAG systems:
- Groundedness is Critical for RAG: This metric consistently differentiates between high and low-quality RAG systems, making it essential for production monitoring.
- Multiple Metrics Provide Robustness: No single metric captures all aspects of RAG quality. Comprehensive evaluation requires multiple assessment dimensions.
- Custom Metrics Add Significant Value: Domain-specific evaluation criteria often capture nuances that generic metrics miss, improving assessment accuracy.
- Statistical Rigor Enables Confidence: Proper sample sizes and significance testing transform evaluation from guesswork into reliable decision-making tools.
Production deployment decision framework
Use this phased framework as a guide for future RAG system deployments:
- Phase 1 - Development: Use reference-based evaluation with known test sets for model comparison and selection.
- Phase 2 - Pre-Production: Run comprehensive evaluation combining both approaches to validate production readiness.
- Phase 3 - Production: Implement reference-free monitoring for continuous quality assessment without golden answers.
- Phase 4 - Optimization: Use evaluation insights to guide model improvements and retrieval system enhancements.
15. Conclusion
Congratulations! You have completed the lab.
This lab is part of the Production-Ready AI with Google Cloud Learning Path.
- Explore the full curriculum to bridge the gap from prototype to production.
- Share your progress with the hashtag
ProductionReadyAI.
Recap
You have learned how to:
- Perform reference-free evaluation to assess an answer's quality based on retrieved context.
- Perform referenced evaluation by adding a "golden answer" to measure factual correctness.
- Use a mix of predefined and custom metrics for both approaches.
- Use both model-based metrics (like
question_answering_quality) and computation-based metrics (rouge,bleu,exact_match). - Analyze and visualize results to understand a model's strengths and weaknesses.
This approach to evaluation helps you build more reliable and accurate generative AI applications.