
1. Overview
In this lab, you learn to evaluate large language models using the Vertex AI Gen AI Evaluation Service. You will use the SDK to run evaluation jobs, compare results, and make data-driven decisions about model performance and prompt design.
The lab walks you through a common evaluation workflow, starting with simple, computation-based metrics and progressing to more nuanced, model-based evaluations. You will also learn to create custom metrics tailored to your specific goals and track your work using Vertex AI Experiments.
What you'll learn
In this lab, you learn how to perform the following tasks:
- Evaluate a model with computation-based and model-based metrics.
- Create a custom metric to align evaluation with product goals.
- Compare different prompt templates side-by-side.
- Test multiple persona-based prompts to find the most effective version.
- Track and visualize evaluation runs using Vertex AI Experiments.
References
- Code samples: This lab builds on examples from the Google Cloud Generative AI repository
- Based on: Vertex AI Gen AI Evaluation documentation
- Dataset: OpenOrca dataset for instruction-following evaluation
2. Project setup
Google Account
If you don't already have a personal Google Account, you must create a Google Account.
Use a personal account instead of a work or school account.
Sign-in to the Google Cloud Console
Sign-in to the Google Cloud Console using a personal Google account.
Enable Billing
To enable billing, you have two options. You can either use your personal billing account or you can redeem credits with the following steps.
Redeem Google Cloud credits (optional)
To run this workshop, you need a billing account with some credit. Use the credits from the banner at the top of this codelab to get started. If you are already connected to a billing account, you can skip this step.
Set up a personal billing account
If you set up billing using Google Cloud credits, you can skip this step.
To set up a personal billing account, go here to enable billing in the Cloud Console.
Some Notes:
- Completing this lab should cost less than $1 USD in Cloud resources.
- You can follow the steps at the end of this lab to delete resources to avoid further charges.
- New users are eligible for the $300 USD Free Trial.
Create a project (optional)
If you do not have a current project you'd like to use for this lab, create a new project here.
3. Set up your Vertex AI Workbench environment
Let's start by accessing your pre-configured notebook environment and installing the necessary dependencies.
Access Vertex AI Workbench
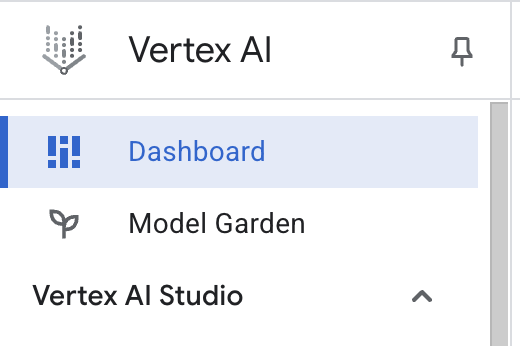
- In the Google Cloud Console, navigate to Vertex AI by clicking the Navigation menu ☰ > Vertex AI > Dashboard.
- Click Enable All Recommended APIs. Note: Please wait for this step to be completed
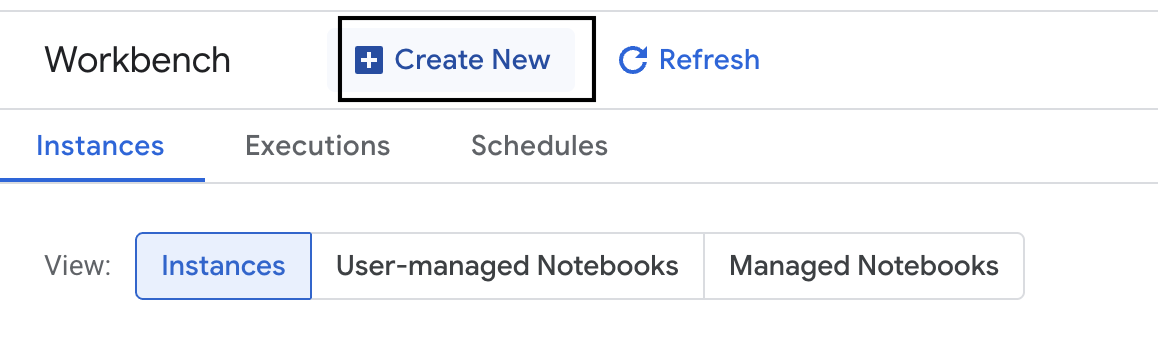
- On the left-hand side, click Workbench to create a new workbench instance.
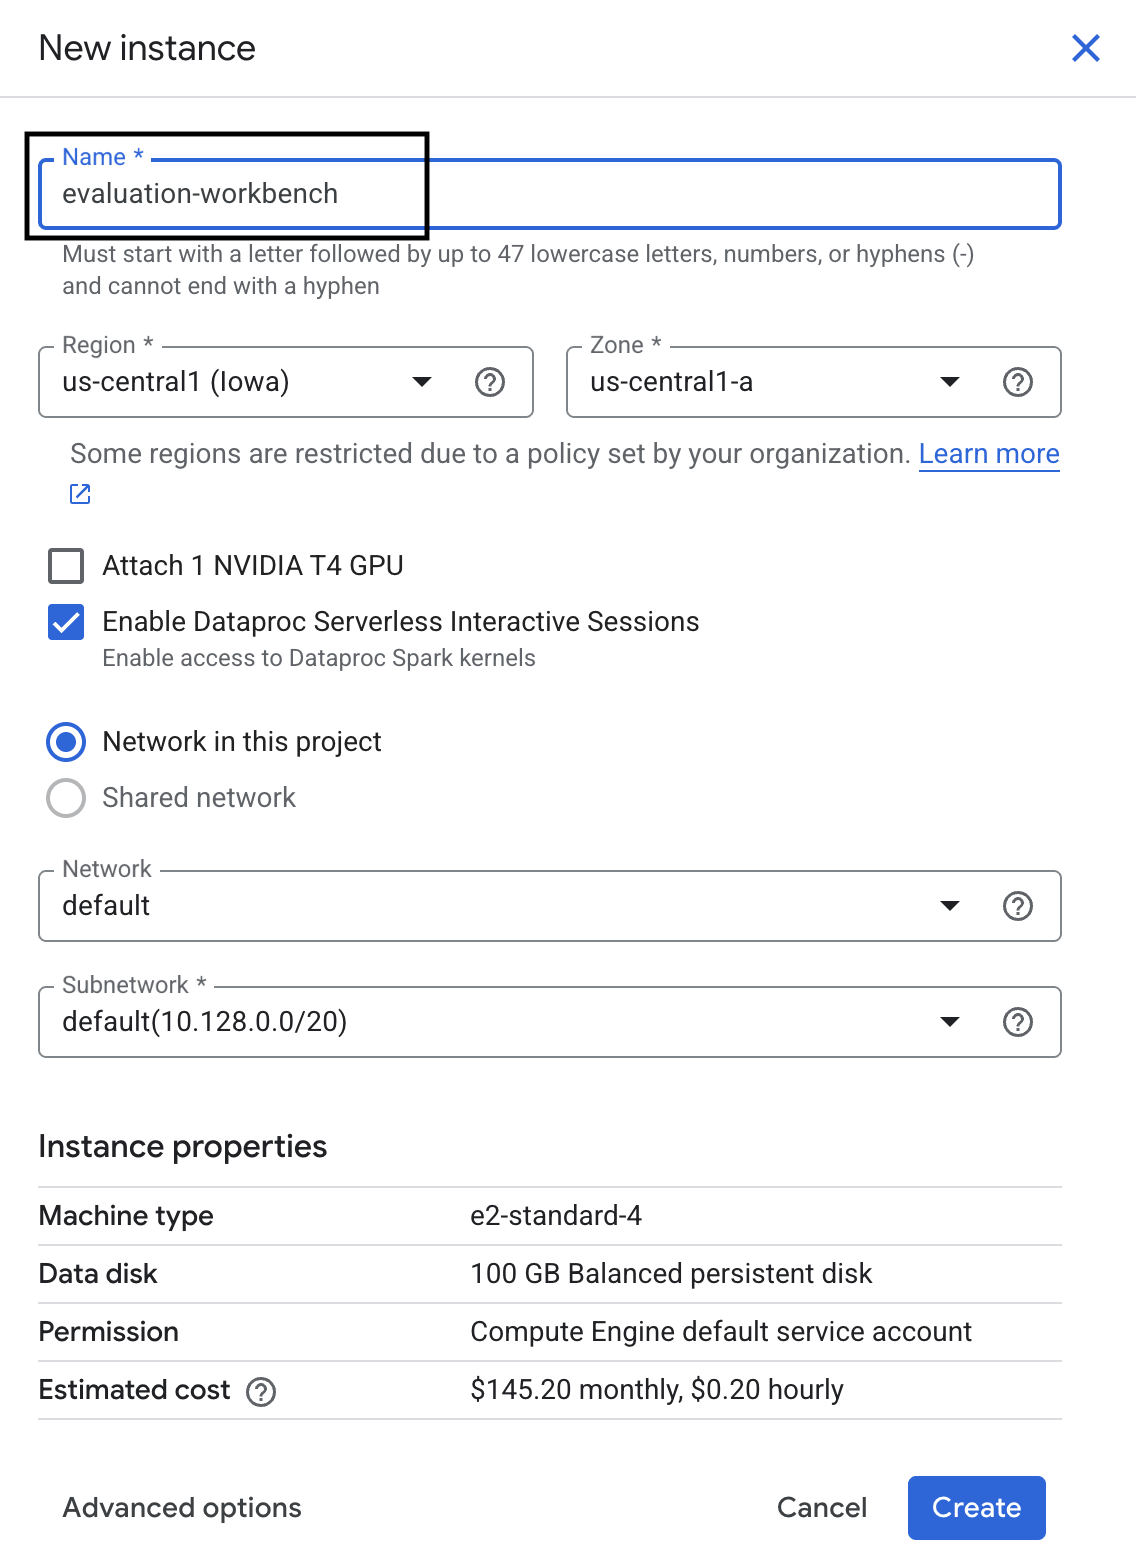
- Name the workbench instance evaluation-workbench and click Create.
- Wait for the workbench to set up. This could take a few minutes.
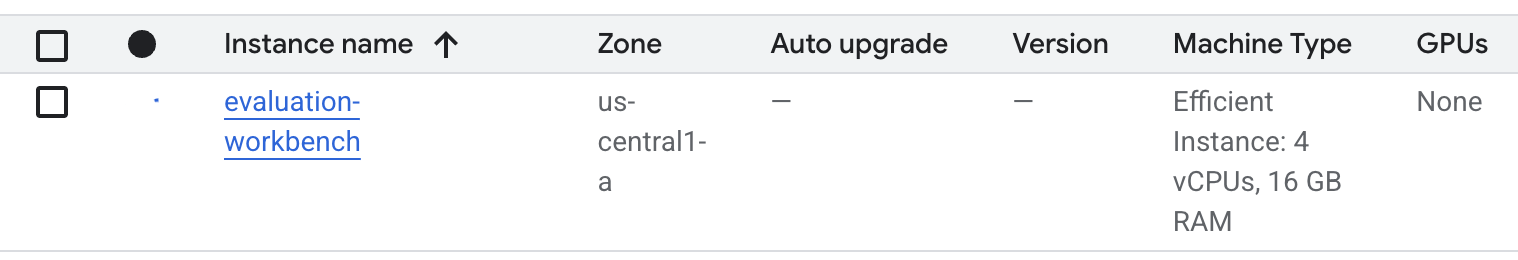
- Once the workbench has been provisioned, click Open JupyterLab.
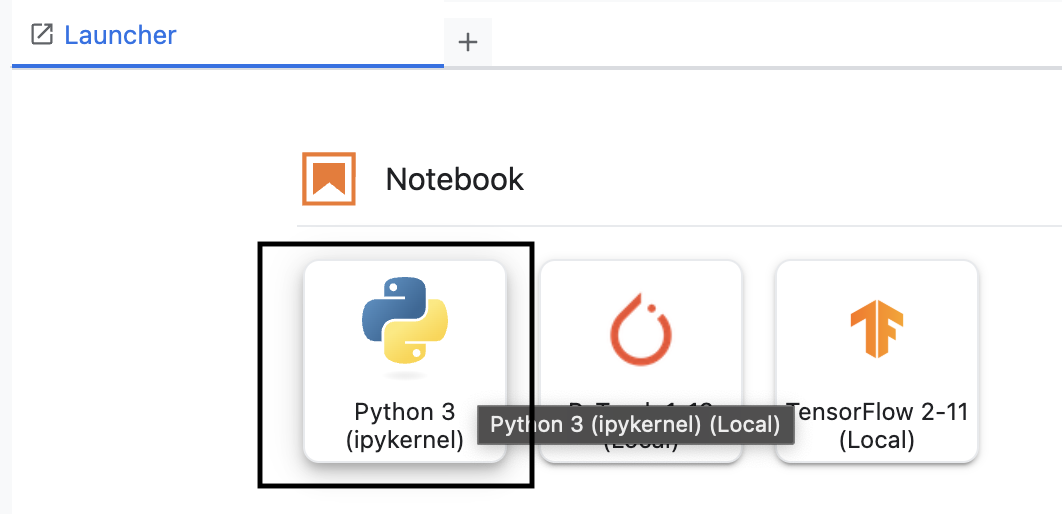
- In the workbench, create a new Python3 notebook.
To learn more about the features and capabilities of this environment, see the official documentation for Vertex AI Workbench.
Install packages and configure your environment
- In the first cell of your notebook, add and run the below import statements (SHIFT+ENTER) to install the Vertex AI SDK (with the evaluation components) and other required packages.
%pip install -U -q google-cloud-aiplatform[evaluation] %pip install -U -q datasets anthropic[vertex] openai - To use the newly installed packages it is recommended to restart the kernel by running the below code snippet.
# Automatically restart kernel after installation so that your environment can access the new packages. import IPython app = IPython.Application.instance() app.kernel.do_shutdown(True) - Replace the following with your project ID and location and run the following cell. The default location is set as
europe-west1but you should use the same location that your Vertex AI workbench instance is in.# Configure your project settings PROJECT_ID = "YOUR PROJECT ID" LOCATION = "europe-west1" - Import all the required python libraries for this lab by running the following code in a new cell.
from anthropic import AnthropicVertex
from google.auth import default, transport
import openai
import pandas as pd
from vertexai.evaluation import (
   EvalTask,
   MetricPromptTemplateExamples,
   PairwiseMetric,
   PointwiseMetric,
   PointwiseMetricPromptTemplate,
)
from vertexai.generative_models import GenerativeModel
from vertexai.preview.evaluation import notebook_utils
4. Set up your evaluation dataset
For this tutorial, we'll use 10 samples from the OpenOrca dataset dataset. This gives us enough data to see meaningful differences between models while keeping evaluation time manageable.
💡 Pro Tip: In production, you'd want 100-500 examples for statistically significant results, but 10 samples are perfect for learning and rapid prototyping!
Prepare the dataset
- In a new cell, run the following cell to load the data, convert it to a pandas DataFrame, and rename the
responsecolumn toreferencefor clarity in our evaluation tasks, and create the random sample of ten examples.from datasets import load_dataset ds = ( load_dataset( "Open-Orca/OpenOrca", data_files="1M-GPT4-Augmented.parquet", split="train[:100]", ) .to_pandas() .drop(columns=["id"]) .rename(columns={"response": "reference"}) ) dataset = ds.sample(n=10) - After the previous cell has finished running, in the next cell, add and run the following code to display the first few rows of your evaluation dataset.
dataset.head()
5. Establish a baseline with computation-based metrics
In this task, you establish a baseline score using a computation-based metric. This approach is fast and provides an objective benchmark to measure future improvements against.
We will use ROUGE (Recall-Oriented Understudy for Gisting Evaluation), a standard metric for summarization tasks. It works by comparing the sequence of words (n-grams) in the model-generated response against the words in the ground-truth reference text.
Read more about computation-based metrics.
Running the baseline evaluation
- In a new cell, add and run the following cell to define the model you want to test,
gemini-2.0-flash. Thegeneration_configincludes parameters liketemperatureandmax_output_tokensthat influence the model's output.# Model to be evaluated model = GenerativeModel( "gemini-2.0-flash", generation_config={"temperature": 0.6, "max_output_tokens": 256, "top_k": 1}, )GenerativeModelclass is the primary interface for interacting with large language models in the Vertex AI SDK. - In the next cell, add and run the following code to create and execute the
EvalTask. This object from the Vertex AI Evaluation SDK orchestrates the evaluation. You configure it with the dataset and the metrics to calculate, which in this case isrouge_l_sum.# Define an EvalTask with ROUGE-L-SUM metric rouge_eval_task = EvalTask( dataset=dataset, metrics=["rouge_l_sum"], ) rouge_result = rouge_eval_task.evaluate( model=model, prompt_template="# System_prompt\n{system_prompt} # Question\n{question}", ) - Display the results by running this code in the next cell.
notebook_utils.display_eval_result(rouge_result)display_eval_result()utility shows the average (mean) score and the row-by-row results.
6. Optional: Evaluate with model-based pointwise metrics
Note: This section might not run within the limit of the free credits provided.
While ROUGE is useful, it only measures lexical overlap (that means it only counts matching words, it doesn't understand context, synonyms, or paraphrasing). So it is not the best at determining if a response is fluent or logical. To get a deeper understanding of the model's performance, you use model-based pointwise metrics.
With this method, another LLM (the "Judge Model") evaluates each response individually against a predefined set of criteria, like fluency or coherence.
Read more about model-based metrics.
Run the pointwise evaluation
- Run the following in a new cell to create an interactive dropdown menu. For this run, select coherence from the list.
#Select a pointwise metric to use import ipywidgets as widgets pointwise_single_turn_metrics = [ metric for metric in MetricPromptTemplateExamples.list_example_metric_names() if not metric.startswith("pairwise") and not metric.startswith("multi_turn") ] dropdown = widgets.Dropdown( options=pointwise_single_turn_metrics, description="Select a metric:", font_weight="bold", style={"description_width": "initial"}, ) def dropdown_eventhandler(change): global POINTWISE_METRIC if change["type"] == "change" and change["name"] == "value": POINTWISE_METRIC = change.new print("Selected:", change.new) POINTWISE_METRIC = dropdown.value dropdown.observe(dropdown_eventhandler, names="value") display(dropdown) - In a new cell, run the
EvalTaskagain, this time using the selected model-based metric. The Vertex AI Evaluation Service constructs a prompt for the Judge Model, which includes the original prompt, the reference answer, the candidate model's response, and instructions for the selected metric. The Judge Model returns a numeric score and an explanation for its rating. Note: This step will take a few minutes to run.pointwise_result = EvalTask( dataset=dataset, metrics=[POINTWISE_METRIC], ).evaluate( model=model, prompt_template="# System_prompt\n{system_prompt} # Question\n{question}", )
Display the results
With the evaluation complete, the next step is to analyze the output.
- Run the following code in a new cell to view the summary metrics, which show the average score for your chosen metric.
notebook_utils.display_eval_result(pointwise_result) - Run the following in the next cell to see the row-by-row breakdown, which includes the Judge Model's written rationale for its score. This qualitative feedback helps you understand why a response was scored a certain way.
notebook_utils.display_explanations(pointwise_result, num=1, metrics=[POINTWISE_METRIC])
7. Build a custom metric for deeper insights
Pre-built metrics like fluency are useful, but for a specific product, you often need to measure performance against your own goals. With custom pointwise metrics, you can define your own evaluation criteria and rubric.
In this task, you create a new metric from scratch called summarization_helpfulness.
Define and run the custom metric
- Run the following in a new cell to define the custom metric.The
PointwiseMetricPromptTemplatecontains the building blocks for the metric:- criteria: Tells the Judge Model the specific dimensions to evaluate: "Key Information," "Conciseness," and "No Distortion."
- rating_rubric: Provides a 5-point scoring scale that defines what each score means.
- input_variables: Passes additional columns from the dataset to the Judge Model so it has the context needed to perform the evaluation.
# This new custom metric evaluates the actual quality and usefulness of the summary. summarization_helpfulness_metric = PointwiseMetric( metric="summarization_helpfulness", metric_prompt_template=PointwiseMetricPromptTemplate( criteria={ "Key Information": "Does the summary capture the most critical pieces of information from the original text? It should not miss the main topic or key takeaways.", "Conciseness": "Is the summary brief and to the point? It should avoid unnecessary words or repetitive information.", "No Distortion": "Does the summary introduce information or opinions that were NOT present in the original text? It must accurately reflect the source material without adding hallucinations." }, rating_rubric={ "5": "Excellent: Captures all key information, is highly concise, and has zero distortion.", "4": "Good: Captures most key information with minor omissions, is concise, and has no distortion.", "3": "Satisfactory: Captures the main idea but misses some key details OR is not very concise.", "2": "Unsatisfactory: Misses the main idea of the original text OR contains minor distortions/hallucinations.", "1": "Poor: Is completely irrelevant, fails to summarize the text, OR contains significant distortions.", }, input_variables=["prompt", "reference"], ), ) - Run the following code in the next cell to execute the
EvalTaskwith your new custom metric.# You would then update the EvalTask to use this new metric pointwise_result = EvalTask( dataset=dataset, metrics=[summarization_helpfulness_metric], ).evaluate( model=model, prompt_template="# System_prompt\n{system_prompt} # Question\n{question}", ) - Run the following in a new cell to display the results.
notebook_utils.display_eval_result(pointwise_result)
8. Comparing models with pairwise evaluation
When you need to decide which of two models performs better on a specific task, you can use pairwise model-based evaluation. This method is a form of A/B testing where a Judge Model determines a winner, providing a direct comparison for data-driven model selection.
The models:
- Candidate model: The model variable (which was previously defined as
gemini-2.0-flash) is passed into the.evaluate()method. This is the main model you are testing. - Baseline model: A second model,
gemini-2.0-flash-lite, is specified inside the PairwiseMetric class. This is the model you are comparing against.
Run the pairwise evaluation
- In a new cell, add and run the following code to create an interactive dropdown menu. This will allow you to select which pairwise metric you want to use for the comparison. For this run, select pairwise_summarization_quality.
from IPython.display import display import ipywidgets as widgets pairwise_single_turn_metrics = [ metric for metric in MetricPromptTemplateExamples.list_example_metric_names() if metric.startswith("pairwise") and "multi_turn" not in metric ] dropdown = widgets.Dropdown( options=pairwise_single_turn_metrics, description="Select a metric:", font_weight="bold", style={"description_width": "initial"}, ) def dropdown_eventhandler(change): global POINTWISE_METRIC if change["type"] == "change" and change["name"] == "value": POINTWISE_METRIC = change.new print("Selected:", change.new) def dropdown_eventhandler(change): global PAIRWISE_METRIC_NAME if change["type"] == "change" and change["name"] == "value": PAIRWISE_METRIC_NAME = change.new print("Selected:", change.new) PAIRWISE_METRIC_NAME = dropdown.value dropdown.observe(dropdown_eventhandler, names="value") display(dropdown) - In the next cell, add and run the following code to configure and execute the
EvalTask. Notice how thePairwiseMetricclass is used to define the baseline model (gemini-2.0-flash-lite), while the candidate model (gemini-2.0-flash) is passed into the.evaluate()method.pairwise_result = EvalTask( dataset=dataset, metrics=[ PairwiseMetric( metric=PAIRWISE_METRIC_NAME, metric_prompt_template=MetricPromptTemplateExamples.get_prompt_template( PAIRWISE_METRIC_NAME ), # Define a baseline model to compare against baseline_model=GenerativeModel("gemini-2.0-flash-lite"), ) ], ).evaluate( # Specify a candidate model for pairwise comparison model=model, prompt_template="# System_prompt\n{system_prompt} # Question\n{question}", ) - In a new cell, add and run the following code to display the results. The summary table will show the "win rate" for each model, indicating which one the Judge Model preferred more often.
notebook_utils.display_eval_result(pairwise_result)
9. Optional: Evaluate persona-driven prompts
Note: This section might not run within the limit of the free credits provided.
In this task, you'll test multiple prompt templates that instruct the model to adopt different personas. This process, often called prompt engineering or prompt design, allows you to systematically find the most effective prompt for a specific use case.
Prepare the summarization dataset
To perform this evaluation, the dataset needs to contain the following fields:
instruction: The core task we are giving the model. In this case, it's a simple "Summarize the following article:".context: The source text the model needs to work with. Here, we've provided four different news snippets.reference: The ground-truth or "gold standard" summary. The model's generated output will be compared against this text to calculate scores for metrics like ROUGE and summarization quality.
- In a new cell, add and run the following code to create a
pandas.DataFramefor the summarization task.instruction = "Summarize the following article: \n" context = [ "Typhoon Phanfone has killed at least one person, a US airman on Okinawa who was washed away by high waves. Thousands of households have lost power and Japan's two largest airlines have suspended many flights. The storm also forced the suspension of the search for people missing after last week's volcanic eruption. The storm-tracking website Tropical Storm Risk forecasts that Phanfone will rapidly lose power over the next few hours as it goes further into the Pacific Ocean. Typhoon Phanfone was downgraded from an earlier status of a super typhoon, but the Japan Meteorological Agency had warned it was still a dangerous storm. Japan averages 11 typhoons a year, according to its weather agency. The typhoon made landfall on Monday morning near the central city of Hamamatsu, with winds of up to 180 km/h (112 mph). The airman was one of three US military personnel swept away by high waves whipped up by the typhoon off southern Okinawa island, where the US has a large military base. The remaining two are still missing. A police spokesman said they had been taking photographs of the sea. A university student who was surfing off the seas of Kanagawa Prefecture, south of Tokyo, was also missing, national broadcast NHK reports. It said at least 10 people had been injured and 9,500 houses were without power. The storm was expected to deposit about 100mm of rain on Tokyo over 24 hours, according to the Transport Ministry website. Many schools were closed on Monday and two car companies in Japan halted production at some plants ahead of the storm. More than 174 domestic flights were affected nationwide, NHK state broadcaster said on Sunday. On Sunday, heavy rain delayed the Japanese Formula One Grand Prix in Suzaka. French driver Jules Bianchi lost control in the wet conditions and crashed, sustaining a severe head injury.", "The blaze started at the detached building in Drivers End in Codicote, near Welwyn, during the morning. There was another fire at the building 20 years ago, after which fire-proof foil was placed under the thatch, which is protecting the main building. More than 15 fire engines and support vehicles were called to tackle the blaze. Roads in the area were closed and traffic diverted.", 'The 18-year-old fell at the New Charter Academy on Broadoak Road in Ashton-under-Lyne at about 09:10 BST, Greater Manchester Police (GMP) said. GMP said he had gone to Manchester Royal Infirmary and his condition was "serious". Principal Jenny Langley said the school would remain "fully open" while police investigated. "Our thoughts are with the family and we\'re doing everything we can to support them along with staff and pupils," she said.', 'But Belgian-born Dutchman Max Verstappen was unable to drive a car legally on his own in either country. That all changed on Wednesday when the youngster turned 18 and passed his driving test at the first attempt. Despite having competed in 14 grands prix since his debut in Australia in March, Verstappen admitted to feeling the pressure during his test. "It\'s a relief," said the Toro Rosso driver, who finished ninth in Japan on Sunday and had only started driving lessons a week ago. "I was a bit nervous to make mistakes, but the exam went well." A bonus of turning 18 is that Verstappen will now be able to drink the champagne if he ever makes it onto the podium.', ] reference = [ "A powerful typhoon has brought many parts of Japan to a standstill and briefly battered Tokyo before heading out to sea.", "A major fire has been burning in the thatched roof of a large property in Hertfordshire.", "A student has been taken to hospital after falling from a balcony at a Greater Manchester school.", "He is Formula 1's youngest ever driver and in charge of a car that can reach over 200mph.", ] response = [ "Typhoon Phanfone, while downgraded from super typhoon status, caused significant disruption and tragedy in Japan. One US airman died after being swept away by high waves, with two more missing. The storm caused power outages for thousands, flight cancellations, and the suspension of rescue efforts for missing volcano victims. Heavy rain and strong winds led to school and factory closures, transportation disruptions, and at least 10 injuries. The typhoon is expected to weaken as it moves over the Pacific Ocean.", "A large fire broke out in a detached thatched building in Codicote, near Welwyn. This is the second fire at the building in 20 years. Thankfully, fire-proof foil installed after the previous fire is protecting the main building. Over 15 fire engines and support vehicles responded, closing roads and diverting traffic in the area.", "An 18-year-old student at New Charter Academy in Ashton-under-Lyne suffered a serious fall and was hospitalized. The incident is under investigation by Greater Manchester Police, but the school remains open. The principal expressed support for the student's family and the school community.", "Max Verstappen, a Formula One driver, was finally able to get his driver's license at age 18. Despite already competing in 14 Grand Prix races, he was not of legal driving age in his native countries. He admitted to being nervous but passed the test on his first attempt. As an added bonus of turning 18, Verstappen can now enjoy champagne on the podium if he places.", ] eval_dataset = pd.DataFrame( { "instruction": instruction, "context": context, "reference": reference, } )
Run the prompt evaluation task
With the summarization dataset prepared, you are ready to run the core experiment of this task: comparing multiple prompt templates to see which one produces the highest-quality output from the model.
- In the next cell, create a single
EvalTaskthat will be reused for each prompt experiment. By setting theexperimentparameter, all evaluation runs from this task are automatically logged and grouped in Vertex AI Experiments.EXPERIMENT_NAME = "eval-sdk-prompt-engineering" # @param {type:"string"} summarization_eval_task = EvalTask( dataset=eval_dataset, metrics=[ "rouge_l_sum", "bleu", "fluency", "coherence", "safety", "groundedness", "summarization_quality", "verbosity", "instruction_following", "text_quality", ], experiment=EXPERIMENT_NAME, )rouge_l_sumandbleuto a wide array of model-based metrics (fluency,coherence,summarization_quality,instruction_following, etc.). This gives us a holistic, 360-degree view of how each prompt impacts the model's output quality. - In a new cell, add and run the following code to define and evaluate four persona-driven prompt strategies. The
forloop iterates through each template and runs an evaluation.Each template is designed to elicit a different style of summary by giving the model a specific persona or goal:- Persona #1 (Standard): A neutral, straightforward summarization request.
- Persona #2 (Executive): Asks for a summary in bullet points, focusing on outcomes and impact, as a busy executive would prefer.
- Persona #3 (5th Grader): Instructs the model to use simple language, testing its ability to adjust the complexity of its output.
- Persona #4 (Technical Analyst): Demands a highly factual summary where key statistics and entities are preserved, testing the model's precision. Notice that the placeholders in these new templates, like
{context}and{instruction}, match the new column names in theeval_datasetyou created for this task.
        # Define prompt templates that target different user personas
    prompt_templates = [
        # Persona 1: Standard, neutral summary
        "Article: {context}. Task: {instruction}. Summary:",

        # Persona 2: For a busy executive (bullet points)
        "Instruction: {instruction} into three key bullet points for a busy executive. Focus on the main outcome and impact. Article: {context}. Summary:",

        # Persona 3: For a 5th grader (simple language)
        "Instruction: {instruction} such that you're explaining it to a 10-year-old. Use simple words. Article: {context}. Summary:",

        # Persona 4: For a technical analyst (fact-focused)
        "Instruction: Provide a detailed, factual summary of the following text, ensuring all key statistics, names, and locations are preserved. Article: {context}. Summary:",
    ]

    eval_results = []
    for i, prompt_template in enumerate(prompt_templates):
        eval_result = summarization_eval_task.evaluate(
            prompt_template=prompt_template,
            model=GenerativeModel(
                "gemini-2.0-flash",
                generation_config={
                    "temperature": 0.3,
                    "max_output_tokens": 256,
                    "top_k": 1,
                },
            ),
            evaluation_service_qps=5,
        )


        eval_results.append((f"Prompt Persona #{i+1}", eval_result))
Analyze and visualize results
Running experiments is the first step. The real value comes from analyzing the results to make a data-driven decision. In this task, you will use the SDK's visualization tools to interpret the outputs from the prompt persona experiment.
- Display the summary results for each of the four prompt personas you tested by running the following code in a new cell. This gives you a high-level quantitative view of the performance.
for title, eval_result in eval_results: notebook_utils.display_eval_result(title=title, eval_result=eval_result) - In a new cell, add and run the following code to see the rationale for the
summarization_qualitymetric for each persona.for title, eval_result in eval_results: notebook_utils.display_explanations( eval_result, metrics=["summarization_quality"], num=2 ) - Generate a radar plot to visualize the trade-offs between different quality metrics for each prompt. In a new cell, add and run the following code.
notebook_utils.display_radar_plot( eval_results, metrics=["instruction_following", "fluency", "coherence", "text_quality"], ) - For a more direct, side-by-side comparison, create a bar plot. In a new cell, add and run the following code.
notebook_utils.display_bar_plot(
    eval_results,
    metrics=["instruction_following", "fluency", "coherence", "text_quality"],
)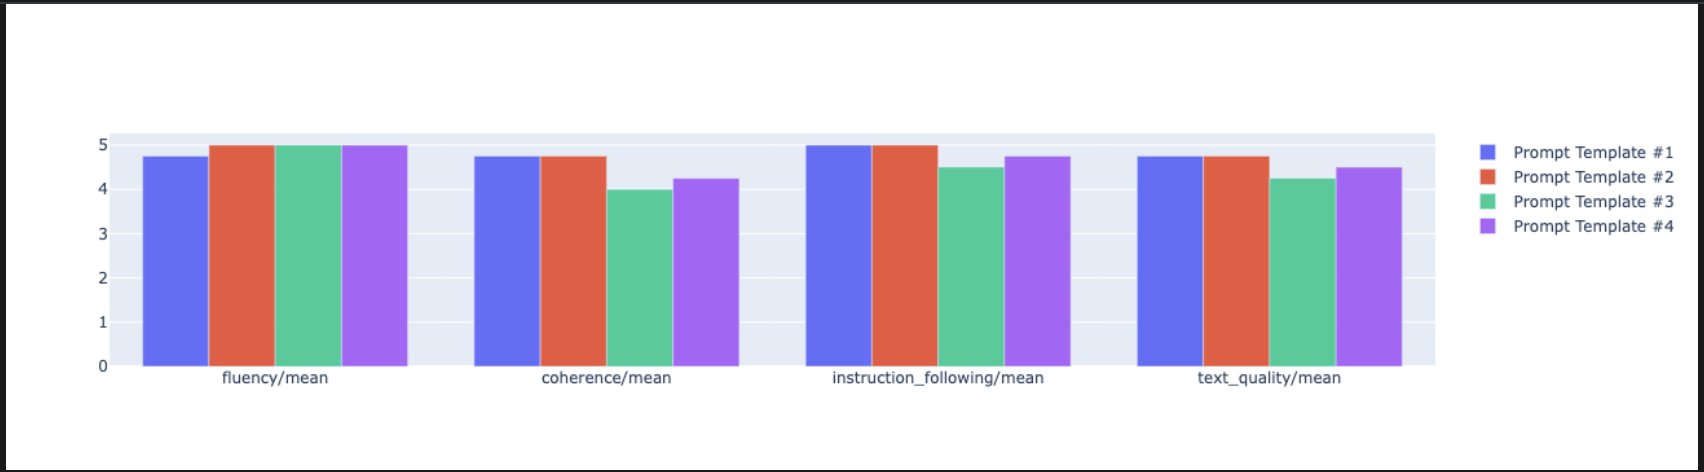
- You can now view a summary of all the runs that have been logged to your Vertex AI Experiment for this task. This is useful for tracking your work over time. In a new cell, add and run the following code:
summarization_eval_task.display_runs()
10. Clean up the experiment
To keep your project organized and avoid incurring unnecessary charges, it is a best practice to clean up the resources you created. Throughout this lab, every evaluation run was logged to a Vertex AI Experiment. The following code deletes this parent experiment, which also removes all the associated runs and their underlying data.
- Run this code in a new cell to delete the Vertex AI Experiment and its associated runs.
delete_experiment = True

# Please set your LOCATION to the same one used during Vertex AI SDK initialization.
LOCATION = "YOUR LOCATION" # @param {type:"string"}

if delete_experiment:

    from google.cloud import aiplatform

    aiplatform.init(project=PROJECT_ID, location=LOCATION)
    experiment = aiplatform.Experiment(EXPERIMENT_NAME)
    experiment.delete()
11. From practice to production
The skills you've learned in this lab are the building blocks for creating reliable AI applications. However, moving from a manually run notebook to a production-grade evaluation system requires additional infrastructure and a more systematic approach. This section outlines key practices and strategic frameworks to consider as you scale up.
Building production evaluation strategies
To apply the skills from this lab in a production environment, it's helpful to formalize them into repeatable strategies. The following frameworks outline key considerations for common scenarios like model selection, prompt optimization, and continuous monitoring.
For model selection:
   # Evaluation strategy for choosing models
   evaluation_strategy = {
      "dataset_size": "100+ examples for statistical significance",
      "metrics": ["task-specific", "general quality", "efficiency"],
      "comparison_type": "pairwise with statistical testing",
      "baseline": "established_model_or_human_benchmark"
   }
For prompt optimization
   # Systematic prompt improvement workflow
   prompt_optimization = {
      "hypothesis": "Clear statement of what you're testing",
      "variants": "3-5 different prompt strategies",
      "evaluation": "Same metrics across all variants",
      "analysis": "Statistical significance + qualitative review"
   }
For continuous monitoring
   # Production evaluation pipeline
   production_eval = {
      "frequency": "Every model update + weekly monitoring",
      "automation": "CI/CD integration with quality gates",
      "metrics": "Speed + quality + cost tracking",
      "alerting": "Performance degradation detection"
   }
Cost-effectiveness considerations
Model-based evaluation can be expensive at scale. A cost-effective production strategy uses different methods for different purposes. This table summarizes the trade-offs between speed, cost, and use case for different evaluation types:
Evaluation Type | Time | Cost per Sample | Best For |
ROUGE/BLEU | Seconds | ~$0.001 | High-volume screening |
Model-based Pointwise | ~1-2 seconds | ~$0.01 | Quality assessment |
Pairwise Comparison | ~2-3 seconds | ~$0.02 | Model selection |
Human Evaluation | Minutes | $1-10 | Gold standard validation |
Automate with CI/CD and monitoring
Manual notebook runs are not scalable. Automate your evaluation in a Continuous Integration/Continuous Deployment (CI/CD) pipeline.
- Create quality gates: Integrate your evaluation task into a CI/CD pipeline (e.g., Cloud Build). Automatically run evaluations on new prompts or models and block deployments if key quality scores drop below your defined thresholds.
- Monitor trends: Export summary metrics from your evaluation runs to a service like Google Cloud Monitoring. Build dashboards to track quality over time and set up automated alerts to notify your team of any significant performance degradation.
12. Conclusion
You have completed the lab. You have learned the essential skills for evaluating generative AI models.
This lab is part of the Production-Ready AI with Google Cloud Learning Path.
- Explore the full curriculum to bridge the gap from prototype to production.
- Share your progress with the hashtag
ProductionReadyAI.
Recap
In this lab, you learned how to:
- Apply evaluation best practices using the
EvalTaskframework. - Use different metric types, from computation-based to model-based judges.
- Optimize prompts by testing different versions.
- Build a reproducible workflow with experiment tracking.
Resources for continued learning
- Vertex AI Gen AI Evaluation Documentation
- Advanced Evaluation Techniques Notebooks
- Gen AI Evaluation SDK Reference
- Model-Based Metrics Research
- Prompt Engineering Best Practices
The systematic evaluation approaches you've learned in this lab will serve as a foundation for building reliable, high-quality AI applications. Remember: good evaluation is the bridge between experimental AI and production success.