
1. 簡介
在本程式碼研究室中,您將瞭解如何運用 BigQuery 圖表解決複雜的供應鏈和物流問題。
您將模擬餐廳供應鏈網路,著重於食品安全和品質控管。如果發生食品安全問題 (例如供應商提供受汙染的食材),時間就是關鍵。快速找出「影響範圍」並執行精準召回,可節省成本並保護消費者。

傳統關聯式模型需要複雜的多步驟 JOIN 作業,才能追蹤多個階段的項目 (供應商 -> DC -> 供應商 -> 商店 -> 成品)。透過 BigQuery Graph,我們可以直接模擬這些連結,使用 ISO GQL (Graph Query Language) 標準進行直覺式快速查詢。
課程內容
- 如何根據現有 BigQuery 資料表定義圖形模型。
- 如何在 BigQuery 中建立屬性圖。
- 如何執行遍歷查詢,追蹤上游和下游影響。
軟硬體需求
- 已啟用計費功能的 Google Cloud 專案。
- Google Cloud Shell。
預估費用
本實驗室的 BigQuery 分析費用預計不到 $5 美元,遠低於新使用者的免費方案配額。
2. 設定和需求
開啟 Cloud Shell
您將在 Cloud Shell 中進行大部分的工作。這個環境已載入所有必要工具,可供您使用 Google Cloud。
- 前往 Google Cloud 控制台。
- 按一下右上工具列中的「啟用 Cloud Shell」圖示。
- 如果系統出現提示,請按一下「繼續」。
設定環境變數
在 Cloud Shell 中設定專案 ID,簡化後續指令。
export PROJECT_ID=$(gcloud config get-value project)
啟用 BigQuery API
確認已啟用 BigQuery API。這項功能通常預設為啟用,但最好還是確認一下。
gcloud services enable bigquery.googleapis.com
3. 建立結構定義和資料表
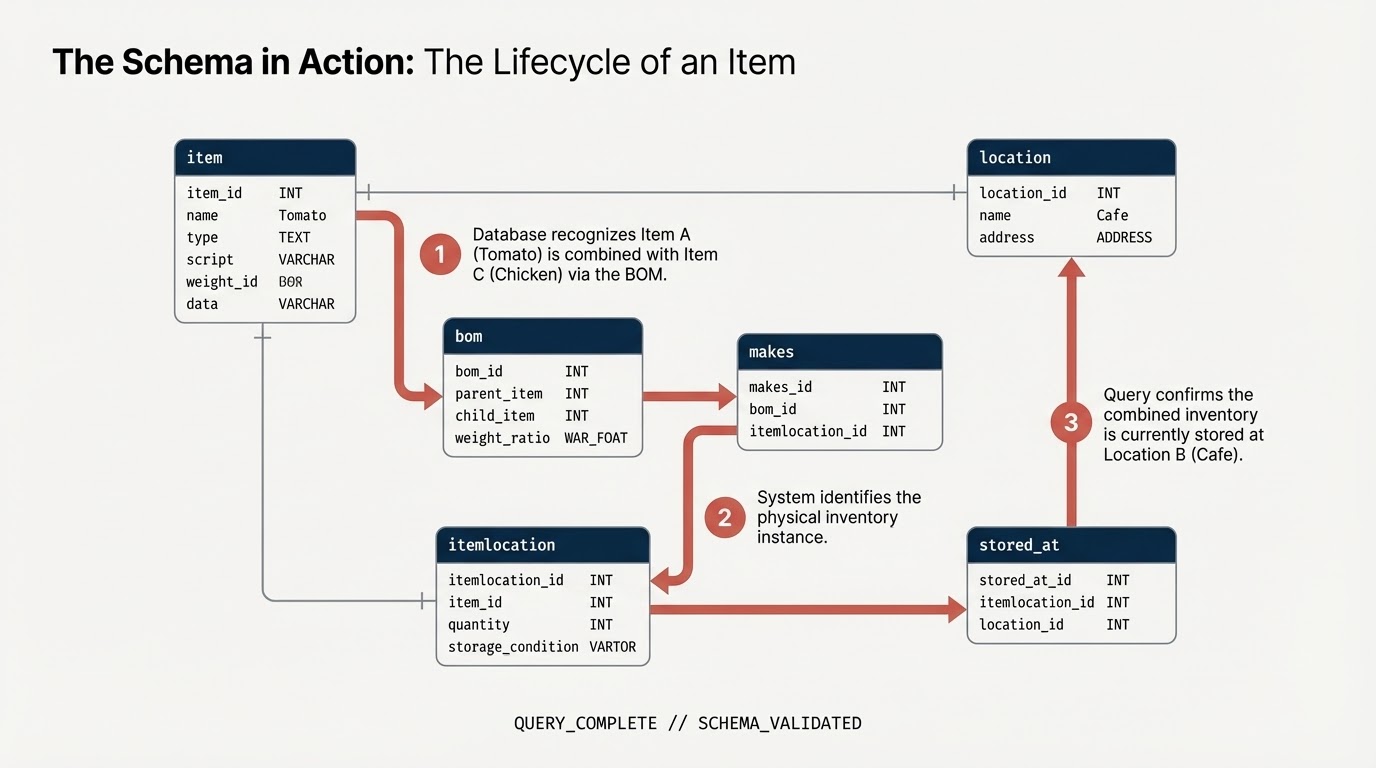
您將建立資料集和資料表,代表供應鏈元件:
item:一般項目定義 (例如番茄、雞肉)。location:設施 (供應商、配送中心、咖啡廳)。itemlocation:代表商品目錄位置的交集資料表。bom:物料清單 (定義重量關係,例如項目 A 屬於項目 B)。makes:將itemlocation對應至item。stored_at:地圖itemlocation至location。
建立資料集
您可以使用 Cloud Shell 或 BigQuery 控制台,在本實驗室中執行 SQL 指令。
如要使用 BigQuery 控制台,請按照下列步驟操作:
- 在新分頁中開啟 BigQuery 控制台。
- 將本實驗室的每個 SQL 程式碼片段貼到編輯器,然後點選「執行」按鈕來執行。
在 Cloud Shell 中執行下列指令,或使用 BigQuery 控制台建立結構定義。您會在 SQL 中使用節點變數。
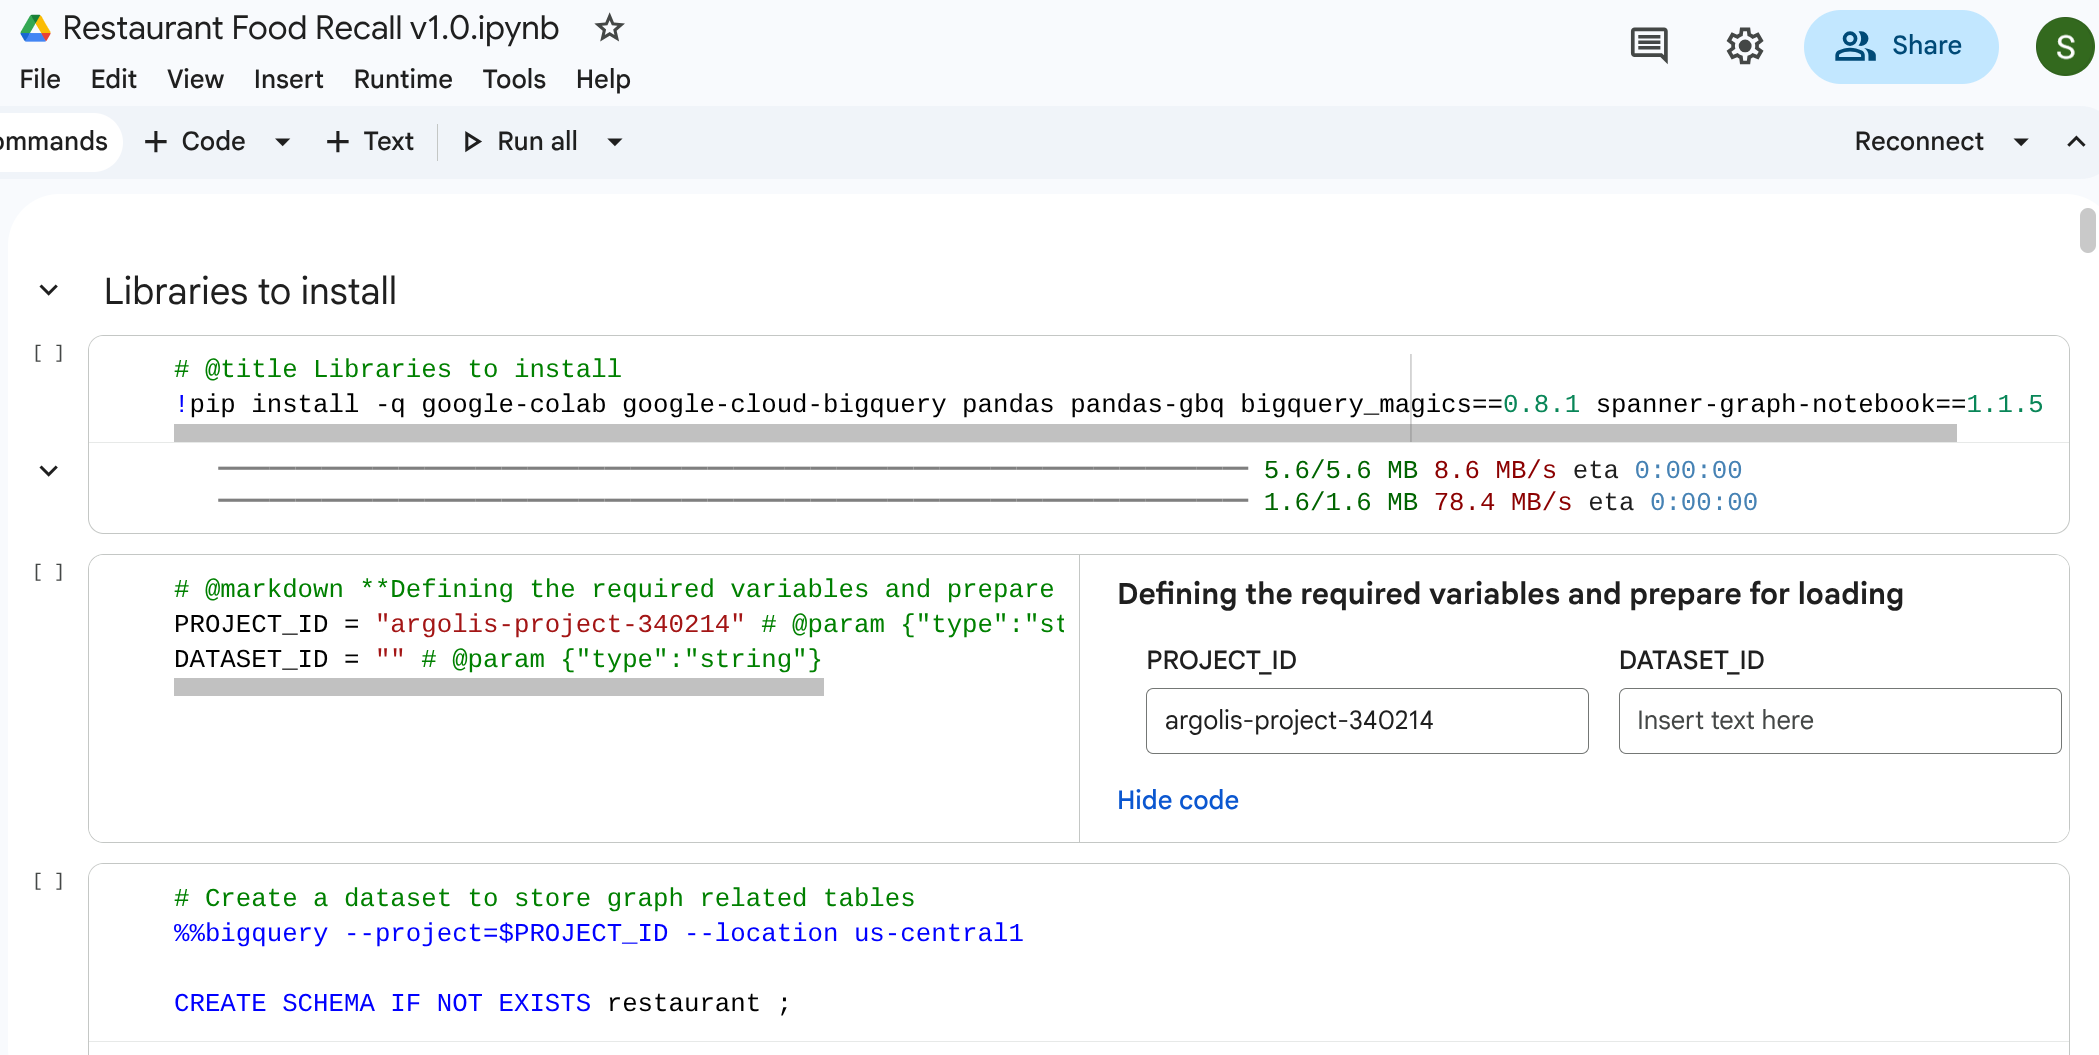
注意:(1) 如要在 Google Colab 中執行這項操作,您也可以使用 BigQuery Magic 指令:%%bigquery。下列程式碼片段會在專案中建立餐廳結構定義,用於存放圖形資料。(2) 如果您是從 Google Colab 執行,則需要使用 %%bigquery –project <PROJECT_ID>。請確認 PROJECT_ID 欄位已對應至您要使用的適當專案:PROJECT_ID = "argolis-project-340214" # @param {"type":"string"} (3) 如果您使用 Colab,則需視需求安裝部分程式庫。如要使用圖形視覺化功能,請務必使用 pip 安裝程式庫:spanner-graph-notebook==1.1.5
%%bigquery --project=$PROJECT_ID
CREATE SCHEMA IF NOT EXISTS restaurant ;
建立資料表
執行下列 SQL 程式碼來建構資料表。
%%bigquery --project=$PROJECT_ID
-- 1. Item Table
DROP TABLE IF EXISTS `restaurant.item`;
CREATE TABLE `restaurant.item` (
  itemKey STRING,
  itemName STRING,
  itemCategory STRING,
  shelfLifeDays INT64,
  PRIMARY KEY (itemKey) NOT ENFORCED
);

-- 2. Location Table
DROP TABLE IF EXISTS `restaurant.location`;
CREATE TABLE `restaurant.location` (
  locationKey STRING,
  locationType STRING,
  locationCity STRING,
  locationState STRING,
  dunsNumber INT64,
  PRIMARY KEY (locationKey) NOT ENFORCED
);
-- 3. ItemLocation Table
DROP TABLE IF EXISTS `restaurant.itemlocation`;
CREATE TABLE `restaurant.itemlocation` (
  itemLocationKey STRING,
  itemKey STRING,
  locationKey STRING,
  variants INT64,
  PRIMARY KEY (itemLocationKey) NOT ENFORCED,
  -- Foreign Key Definitions
  FOREIGN KEY (itemKey) REFERENCES `restaurant.item`(itemKey) NOT ENFORCED,
  FOREIGN KEY (locationKey) REFERENCES `restaurant.location`(locationKey) NOT ENFORCED
);

-- 4. BOM Table
DROP TABLE IF EXISTS `restaurant.bom`;
CREATE TABLE `restaurant.bom` (
  bomKey INT64,
  parentItemLocation STRING,
  childItemLocation STRING,
  childQuantity FLOAT64,
  PRIMARY KEY (bomKey) NOT ENFORCED
);

-- 5. Makes Table
DROP TABLE IF EXISTS `restaurant.makes`;
CREATE TABLE `restaurant.makes` (
  itemLocationKey STRING,
  itemKey STRING,
  locationKey STRING,
  variants INT64,
  PRIMARY KEY (itemLocationKey) NOT ENFORCED
);

DROP TABLE IF EXISTS `restaurant.stored_at`;
CREATE TABLE `restaurant.stored_at` (
  itemLocationKey STRING,
  itemKey STRING,
  locationKey STRING,
  variants INT64,
  PRIMARY KEY (itemLocationKey) NOT ENFORCED
);
4. 正在載入範例資料
為確保這個實驗室完全自給自足,您將使用純 SQL LOAD DATA 陳述式填入範例資料。這代表從供應商開始的網路,途經配送中心 (DC) 和中央廚房,最後抵達零售咖啡廳。
執行下列 SQL 查詢來載入資料:

注意:如果您直接在 BigQuery Studio 中執行,可以省略 %%bigquery
%%bigquery --project=$PROJECT_ID
-- Load Item
LOAD DATA OVERWRITE `restaurant.item`
FROM FILES (format = 'CSV', uris = ['gs://supply_chain_demo/item2.csv'], skip_leading_rows = 1);

-- Load Location
LOAD DATA OVERWRITE `restaurant.location`
FROM FILES (format = 'CSV', uris = ['gs://supply_chain_demo/location.csv'], skip_leading_rows = 1);

-- Load ItemLocation
LOAD DATA OVERWRITE `restaurant.itemlocation`
FROM FILES (format = 'CSV', uris = ['gs://supply_chain_demo/itemlocation.csv'], skip_leading_rows = 1);

-- Load BOM
LOAD DATA OVERWRITE `restaurant.bom`
FROM FILES (format = 'CSV', uris = ['gs://supply_chain_demo/bom2.csv'], skip_leading_rows = 1);

-- Load Makes
LOAD DATA OVERWRITE `restaurant.makes`
FROM FILES (format = 'CSV', uris = ['gs://supply_chain_demo/makes.csv'], skip_leading_rows = 1);

-- Load StoredAt
LOAD DATA OVERWRITE `restaurant.stored_at`
FROM FILES (format = 'CSV', uris = ['gs://supply_chain_demo/itemlocation.csv'], skip_leading_rows = 1);
5. 新增限制並定義圖表
建構圖表前,請先使用標準 SQL 主鍵和外鍵限制條件,宣告語意關係。這些欄位可協助 BigQuery 瞭解節點 ID,並將邊緣資料表連結至節點資料表。
建立屬性圖
現在,您要將這些資料表合併為單一的連貫圖形結構,稱為 restaurant.bombod。
您可以定義:
- 節點:
item、location、itemlocation - 邊緣:
makes、stored_at和consists_of(BOM)
%%bigquery --project=$PROJECT_ID

CREATE OR REPLACE PROPERTY GRAPH `restaurant.bombod`
NODE TABLES (
  `restaurant.item` KEY (itemKey) LABEL item PROPERTIES ALL COLUMNS,
  `restaurant.location` KEY (locationKey) LABEL location PROPERTIES ALL COLUMNS,
  `restaurant.itemlocation` KEY (itemLocationKey) LABEL itemlocation PROPERTIES ALL COLUMNS
)
EDGE TABLES (
  `restaurant.makes`
    KEY (itemLocationKey)
    SOURCE KEY (itemLocationKey) REFERENCES `restaurant.itemlocation`(itemLocationKey)
    DESTINATION KEY (itemKey) REFERENCES `restaurant.item`(itemKey)
    LABEL makes PROPERTIES ALL COLUMNS,

  `restaurant.bom`
    KEY (bomKey)
    SOURCE KEY (childItemLocation) REFERENCES `restaurant.itemlocation`(itemLocationKey)
    DESTINATION KEY (parentItemLocation) REFERENCES `restaurant.itemlocation`(itemLocationKey)
    LABEL consists_of PROPERTIES ALL COLUMNS,

  `restaurant.stored_at`
    KEY (itemLocationKey)
    SOURCE KEY (itemLocationKey) REFERENCES `restaurant.itemlocation`(itemLocationKey)
    DESTINATION KEY (locationKey) REFERENCES `restaurant.location`(locationKey)
    LABEL stored_at PROPERTIES ALL COLUMNS
);
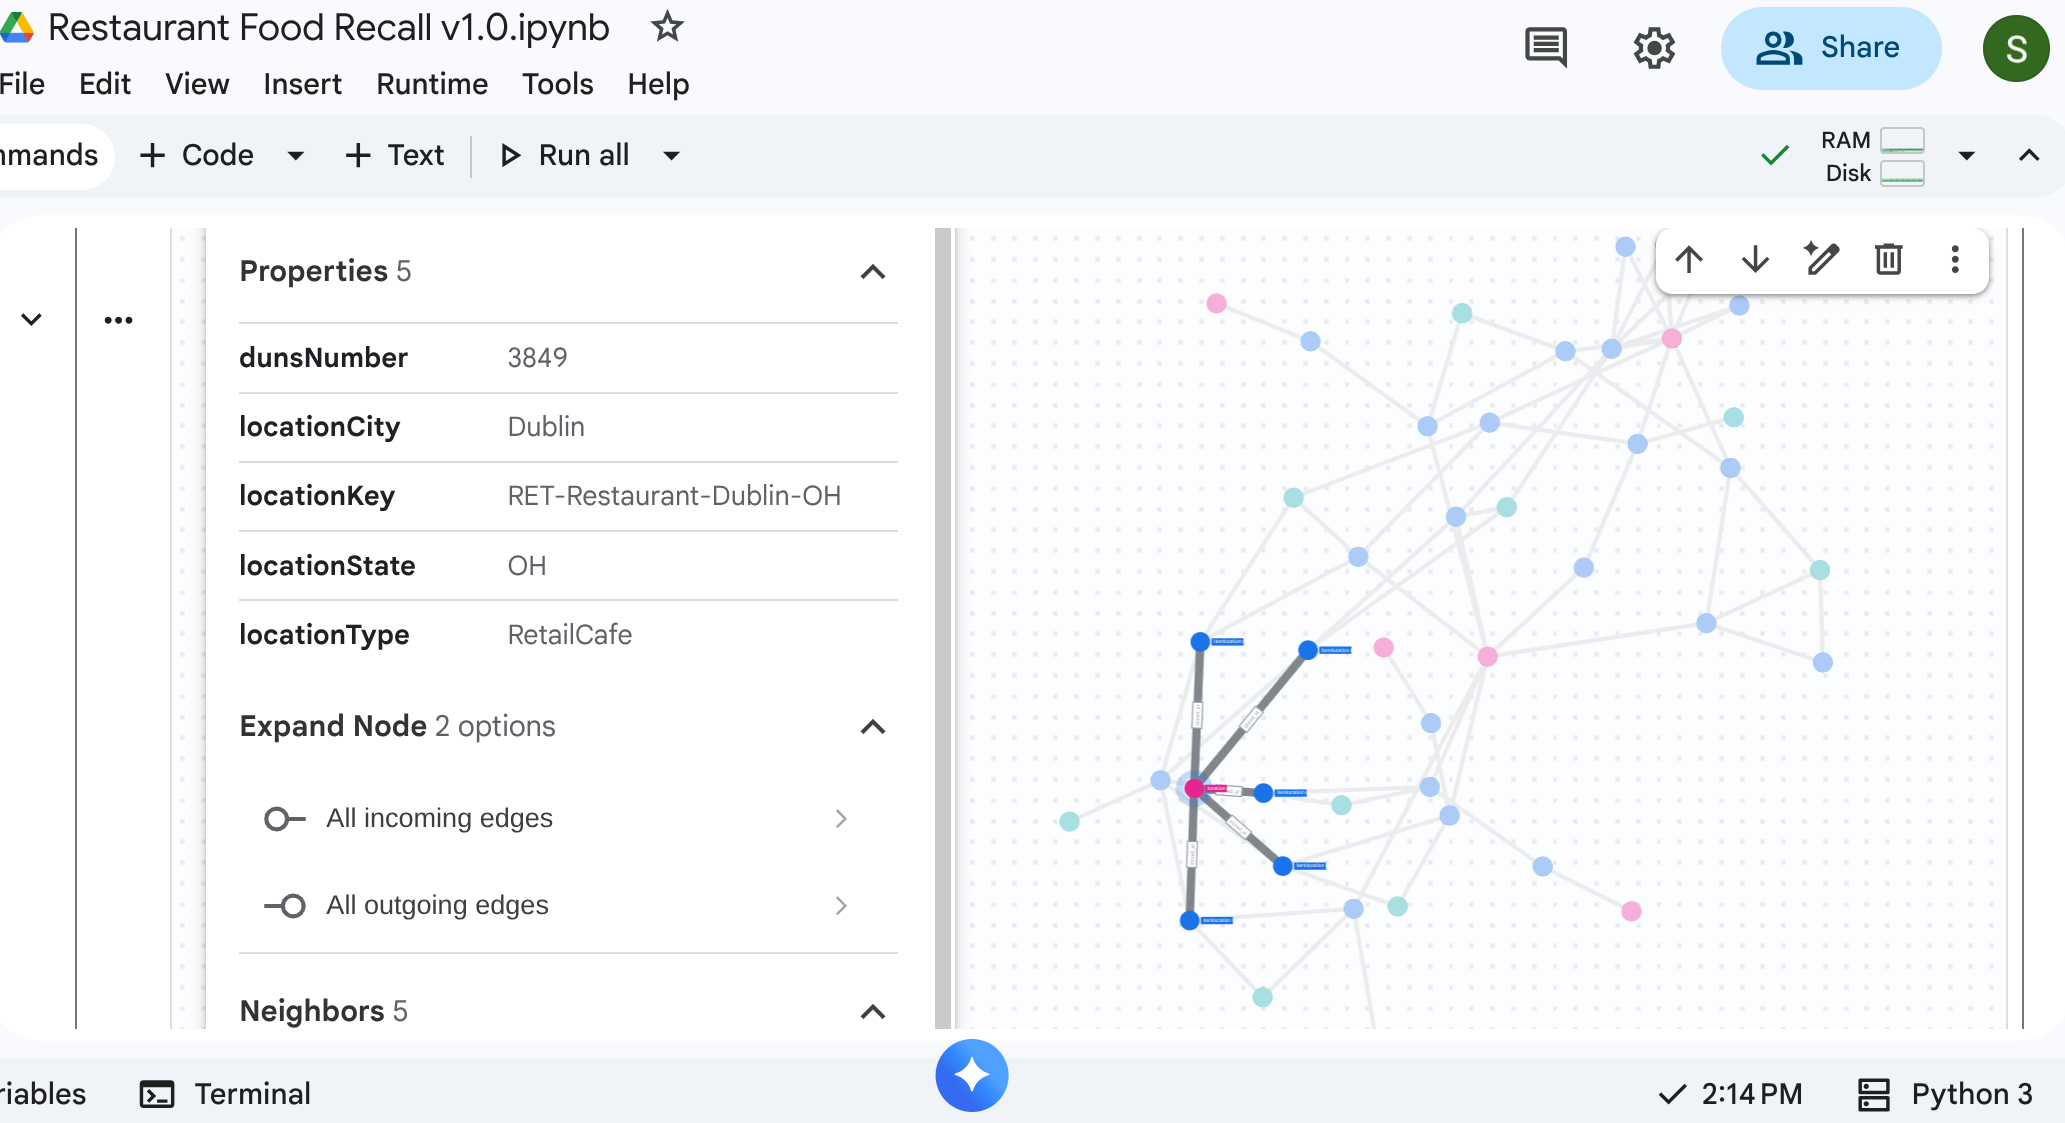
6. 供應鏈視覺化
您可以執行由上而下的遍歷查詢,查看整個供應鏈網路。在標準筆記本或支援的 UI (例如 %%bigquery --graph) 中,這會傳回視覺化地圖。
使用絕對圖形查詢設定節點和邊緣。
注意:如先前所述,如要在 Google Colab 或 Colab Enterprise Notebooks 中執行這項操作,您也可以使用 BigQuery Magic 指令:%%bigquery。此外,如要在 Google Colab 或 Colab Enterprise Notebooks 中顯示圖表,請加入 –graph 旗標,例如:%%bigquery –graph
%%bigquery  --project=$PROJECT_ID --graph output

Graph restaurant.bombod

match p=(a:itemlocation)-[c:consists_of]->(b:itemlocation)
match q=(a)-[d:stored_at]->(e:location)
optional match z=(f)-[g:makes]-(b)

return to_json(p) as ppath, to_json(q) as qpath, to_json(z) as zpath
輸出內容:
7. 用途 1:追蹤上游申訴
情境:顧客在紐約分店購買三明治,但對雞肉品質有意見。您需要回溯追蹤完成的項目,才能查看其直接組裝階段。
遍歷查詢
使用 Graph Traversal 查詢格式執行查詢。這會查看與下游組件相關的 consists_of 邊緣,直到上游原料為止。
%%bigquery --project=$PROJECT_ID --graph

GRAPH restaurant.bombod
MATCH p=(a:itemlocation)-[c:consists_of]->(b:itemlocation)
OPTIONAL MATCH q=(b)-[d:stored_at]-(e)
return to_json(p) as ppath, to_json(q) as qpath
由於 consists_of Edge Table (Ingredient -> Finished) 中的箭頭方向,上游搜尋會產生連結,快速隔離依附元件和儲存位置。
輸出: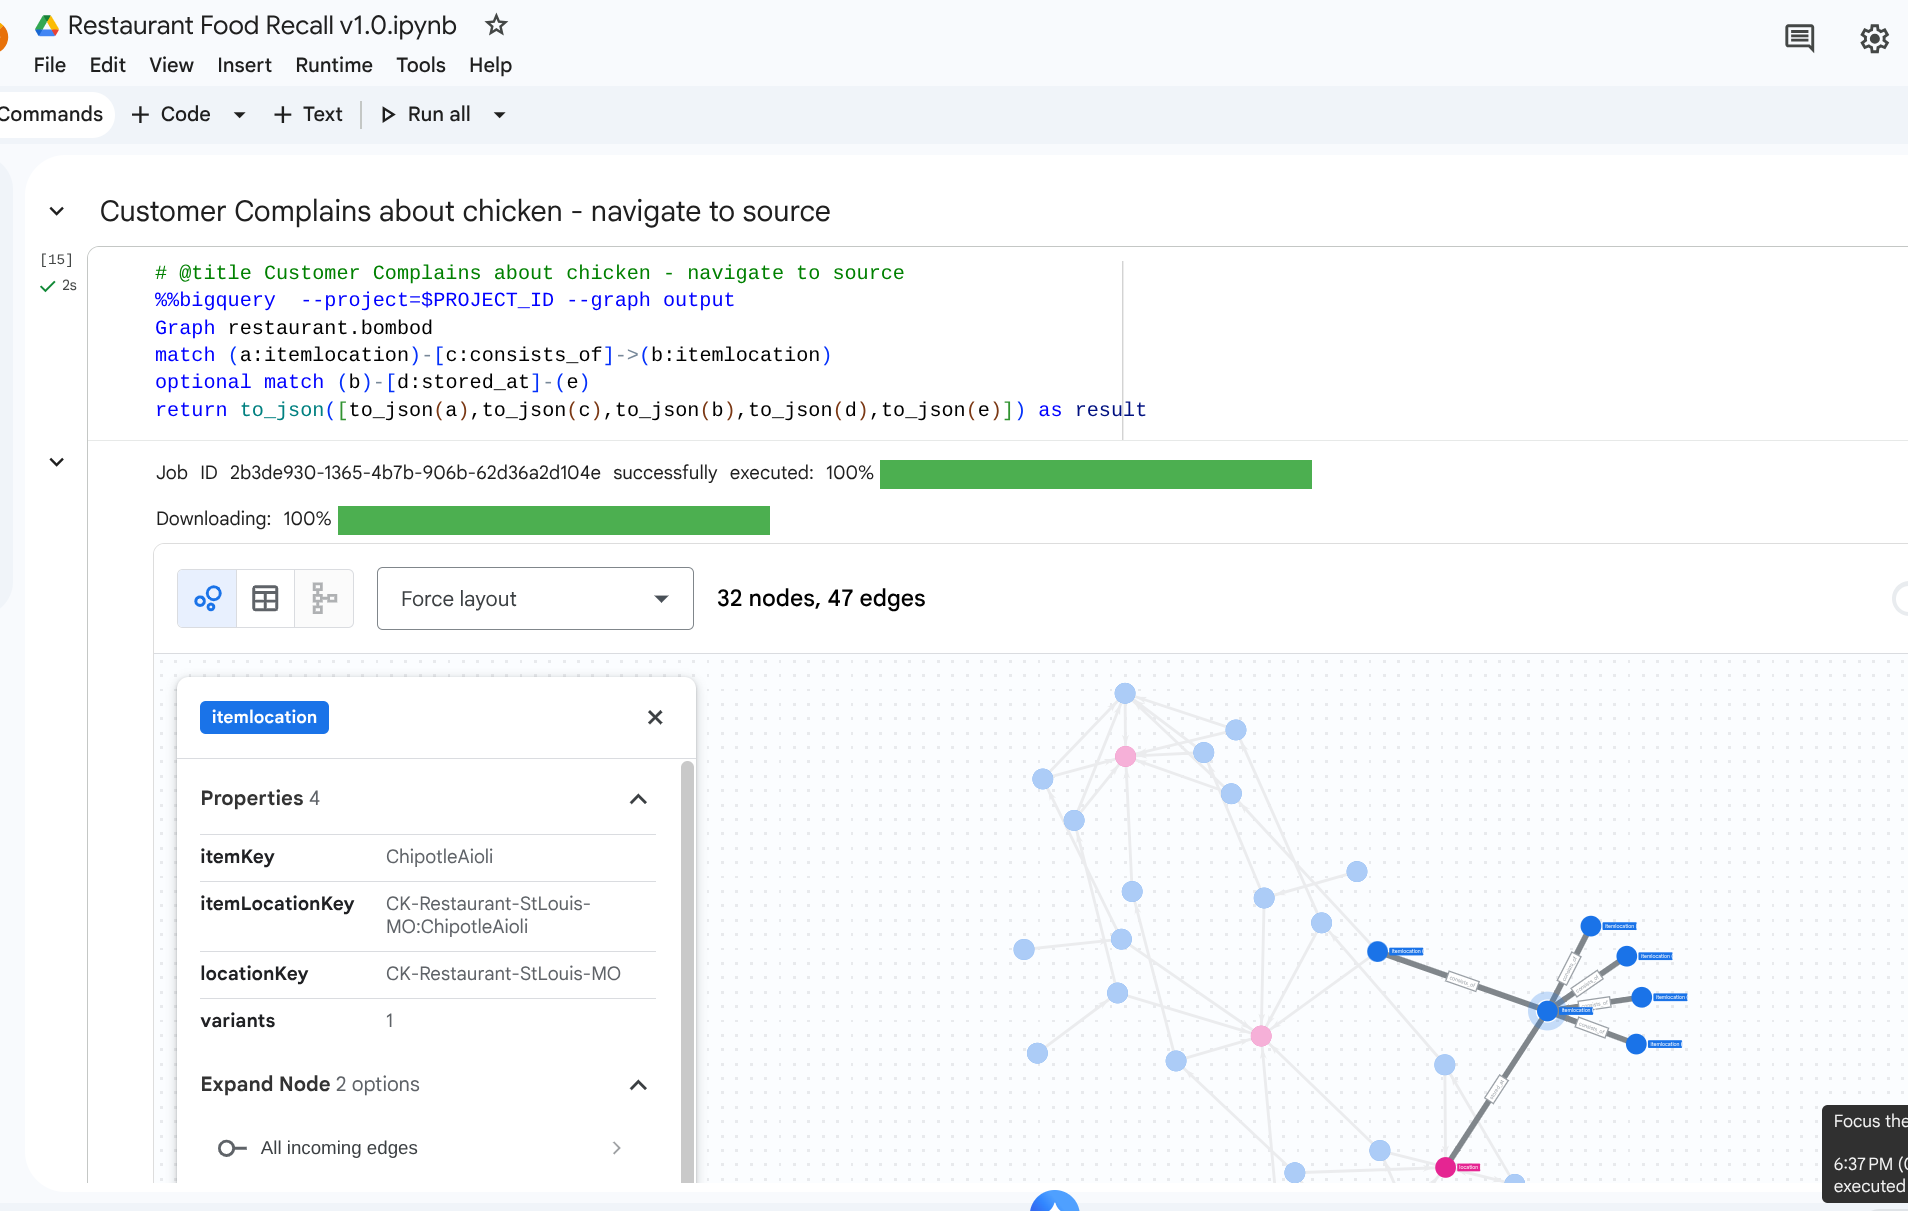
8. 用途 2:影響分析
情境:俄亥俄州哥倫布市的配送中心因暴風雪而關閉。您需要瞭解哪些下游準備或完成的項目會立即受到影響。
遍歷查詢
首先,您會從代表配送中心的特定 location 開始,找出儲存在該處的庫存,並查看需要這些庫存的成品。
# @title Impact of a storm on a DC

%%bigquery  --project=$PROJECT_ID --graph
Graph restaurant.bombod
match path1=(z:itemlocation)-[m:stored_at]->(dc:location) where dc.locationKey like '%DC-Sysco-Columbus-OH%'
match path2=(z:itemlocation)-[c:consists_of]->(b:itemlocation)
match path3=(b:itemlocation)-[n:makes]->(item:item)
optional match path4=(b)-[p:stored_at]->(q:location)
return to_json(path1) as path1, to_json(path2) as path2,to_json(path3) as path3, to_json(path4) as path4
輸出: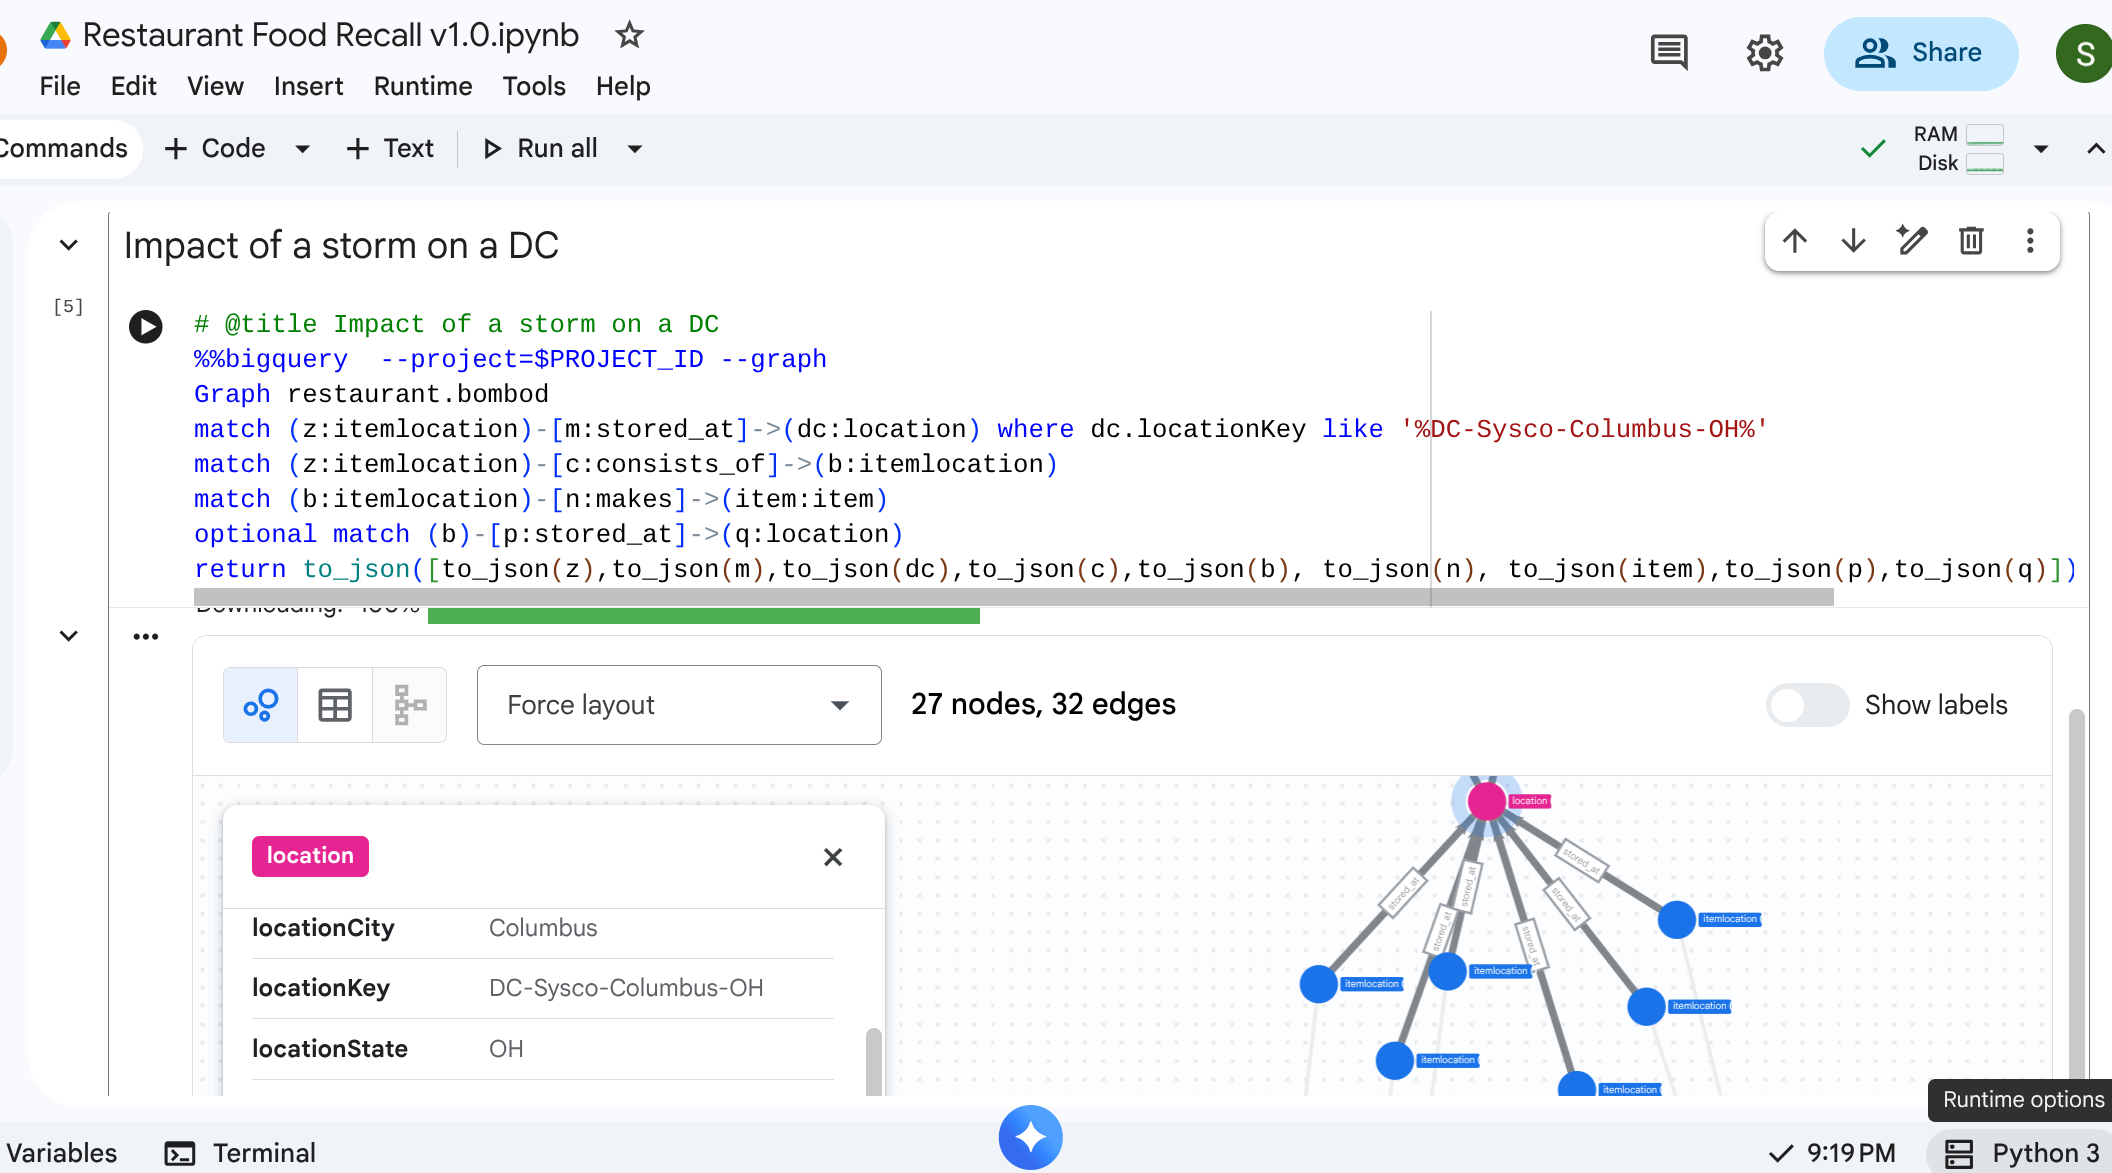
9. 應用範例 3:下游召回
情境:供應商通知你某批產品受到汙染,該產品為供應商提供的熟成番茄。你必須找出咖啡廳中所有受影響的最終菜單項目。
遍歷查詢
您會尋找受汙染的原料位置,然後執行路徑遍歷,向下游流動,找出最終受影響的項目。
%%bigquery  --project=$PROJECT_ID --graph
Graph restaurant.bombod
match path1=(a:itemlocation)-[c:consists_of]->(b:itemlocation)-[e:makes]->(f:item) where f.itemKey like '%Tomato%'
return to_json(path1) as result
這項查詢會找出所有與「Tomato」模式相符的項目,並與上游關係交織在一起,成為強大的對應,可傳播以找出必須召回的咖啡廳項目。
輸出: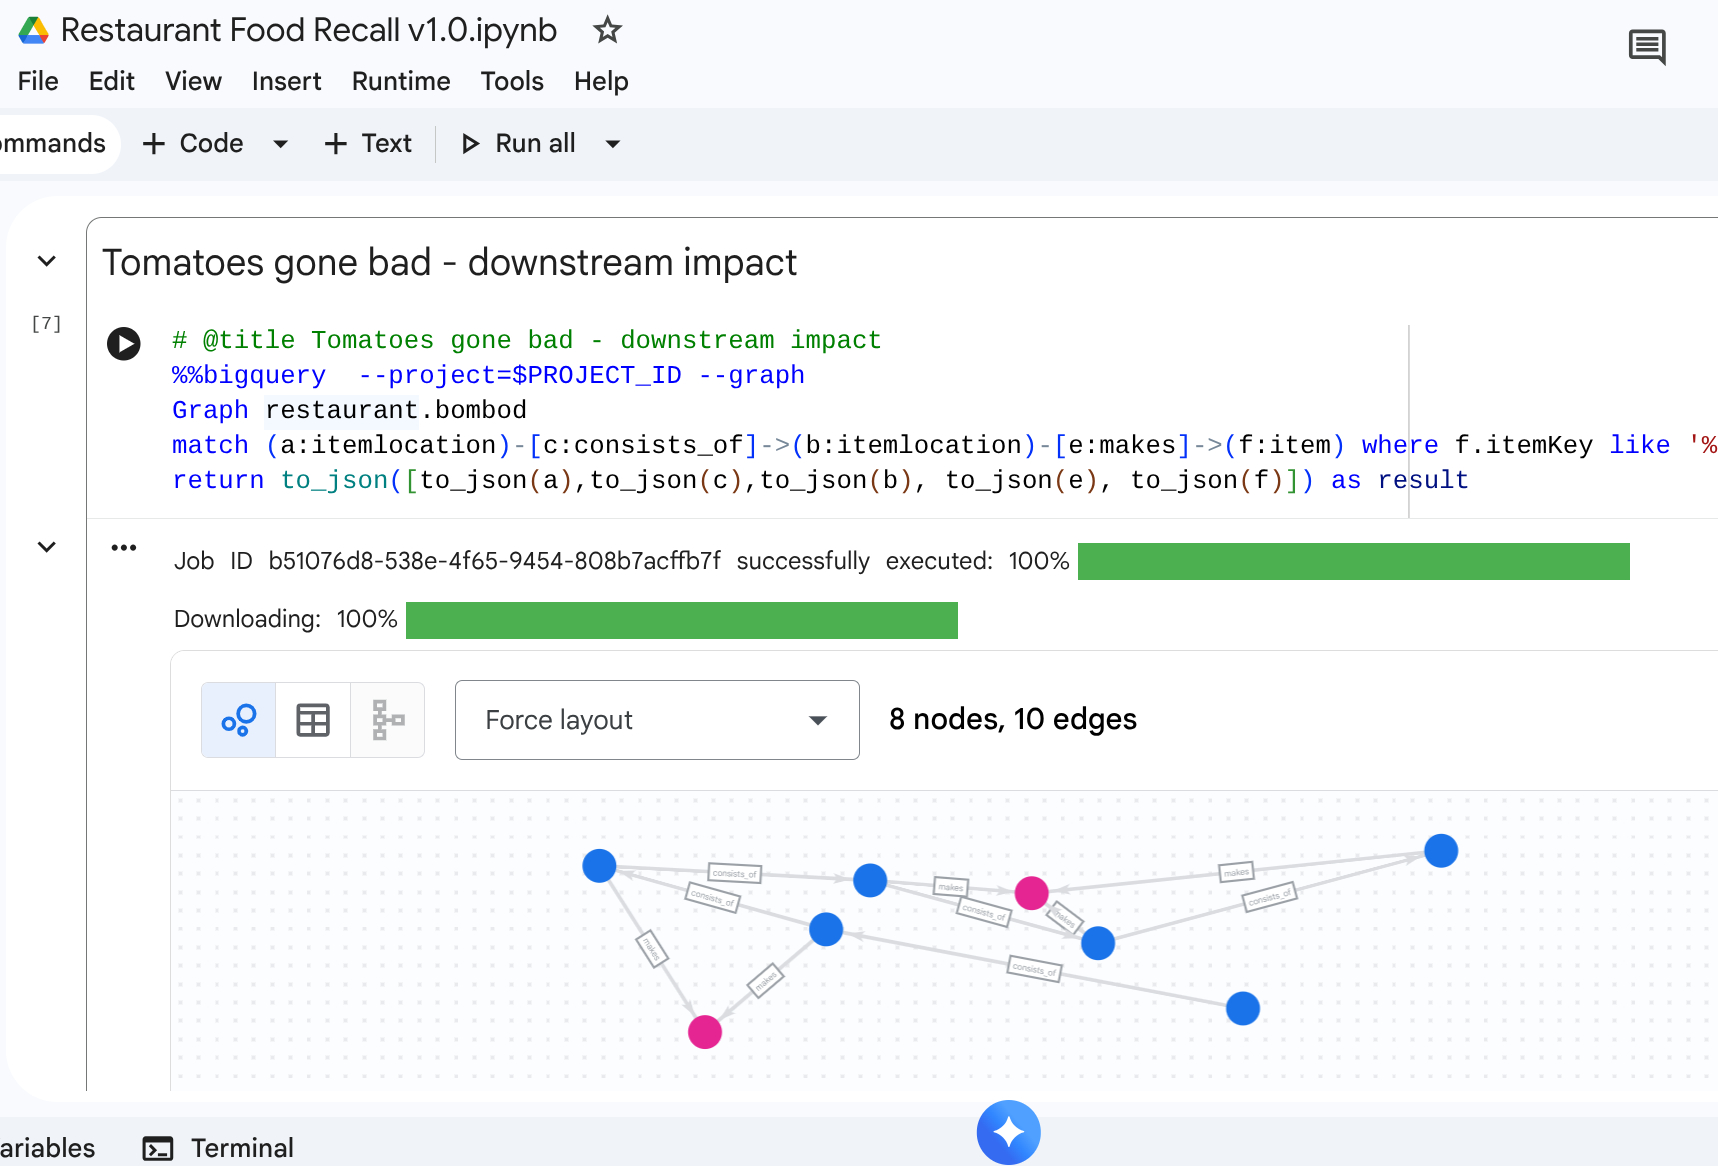
10. 清除
完成逐步操作說明後,請刪除資源,以免工作區產生任何剩餘費用。
DROP SCHEMA `restaurant` CASCADE;
11. 結語
恭喜!您已使用 BigQuery Graph 建立供應鏈模型,並執行影響分析。
總結
您學會了如何:
- 使用主鍵/外鍵宣告以圖形為中心的關聯關係。
- 建立統一的房地產圖表。
- 使用圖形查詢遍歷邏輯,有效瀏覽多節點關係。
如要深入瞭解圖形架構,請參閱 Google Cloud 說明文件。