
1. 소개
이 Codelab에서는 BigQuery 그래프를 활용하여 복잡한 공급망 및 물류 문제를 해결하는 방법을 알아봅니다.
식품 안전 및 품질 관리에 중점을 둔 레스토랑 공급망 네트워크를 모델링합니다. 공급업체에서 오염된 재료와 같은 식품 안전 문제가 발생하면 시간이 중요합니다. '영향 범위'를 식별하고 신속하게 정밀 회수를 실행하면 비용을 절감하고 고객을 보호할 수 있습니다.

기존 관계형 모델에서는 여러 단계 (공급업체 -> DC -> Commissary -> 매장 -> 완제품)를 통해 상품을 추적하려면 복잡한 다단계 JOIN 작업이 필요합니다. BigQuery Graph를 사용하면 이러한 연결을 직접 모델링하여 ISO GQL (Graph Query Language) 표준을 사용하여 직관적이고 빠른 쿼리를 실행할 수 있습니다.
학습할 내용
- 기존 BigQuery 테이블을 기반으로 그래프 모델을 정의하는 방법
- BigQuery 내에서 속성 그래프를 만드는 방법을 설명합니다.
- 순회 쿼리를 실행하여 업스트림 및 다운스트림 영향을 추적하는 방법
필요한 항목
- 결제가 사용 설정된 Google Cloud 프로젝트
- Google Cloud Shell
예상 비용
이 실습의 BigQuery 분석 수수료는 5달러 미만으로 예상되며, 이는 신규 사용자의 무료 등급 할당량 내에 있습니다.
2. 설정 및 요구사항
Cloud Shell 열기
대부분의 작업은 Google Cloud를 사용하는 데 필요한 모든 것이 포함된 로드된 환경인 Cloud Shell에서 수행합니다.
- Google Cloud Console로 이동합니다.
- 오른쪽 상단 툴바에서 Cloud Shell 활성화 아이콘을 클릭합니다.
- 메시지가 표시되면 계속을 클릭합니다.
환경 변수 설정
Cloud Shell에서 프로젝트 ID를 설정하여 향후 명령어를 간소화합니다.
export PROJECT_ID=$(gcloud config get-value project)
BigQuery API 사용 설정
BigQuery API가 사용 설정되어 있는지 확인합니다. 일반적으로 기본적으로 사용 설정되어 있지만 안전을 위해 확인하는 것이 좋습니다.
gcloud services enable bigquery.googleapis.com
3. 스키마 및 테이블 만들기
공급망 구성요소를 나타내는 데이터 세트와 테이블을 만듭니다.
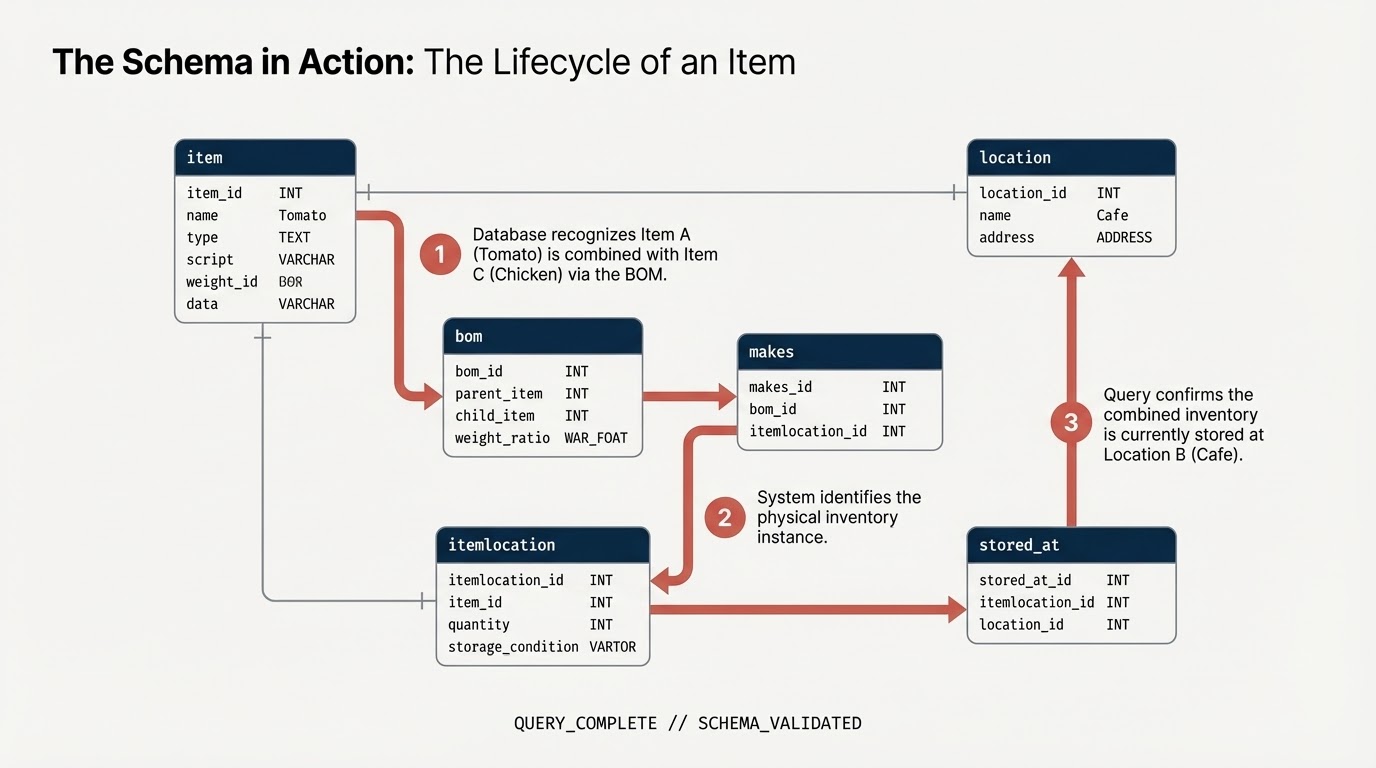
item: 일반 항목 정의 (예: 토마토, 닭고기)입니다.location: 시설 (공급업체, 유통 센터, 카페)itemlocation: 재고 위치를 나타내는 교차 테이블입니다.bom: 자재 명세서 (무게 관계를 정의함, 예: 상품 A가 상품 B에 들어감).makes:itemlocation을item에 매핑합니다.stored_at:itemlocation을location에 매핑합니다.
데이터 세트 만들기
Cloud Shell 또는 BigQuery 콘솔을 사용하여 이 실습의 SQL 명령어를 실행할 수 있습니다.
BigQuery 콘솔을 사용하려면 다음 단계를 따르세요.
- 새 탭에서 BigQuery 콘솔을 엽니다.
- 이 실습의 각 SQL 스니펫을 편집기에 붙여넣은 다음 실행 버튼을 클릭하여 실행합니다.
Cloud Shell에서 다음 명령어를 실행하거나 BigQuery 콘솔을 사용하여 스키마를 만듭니다. SQL에서 노드 변수를 사용합니다.
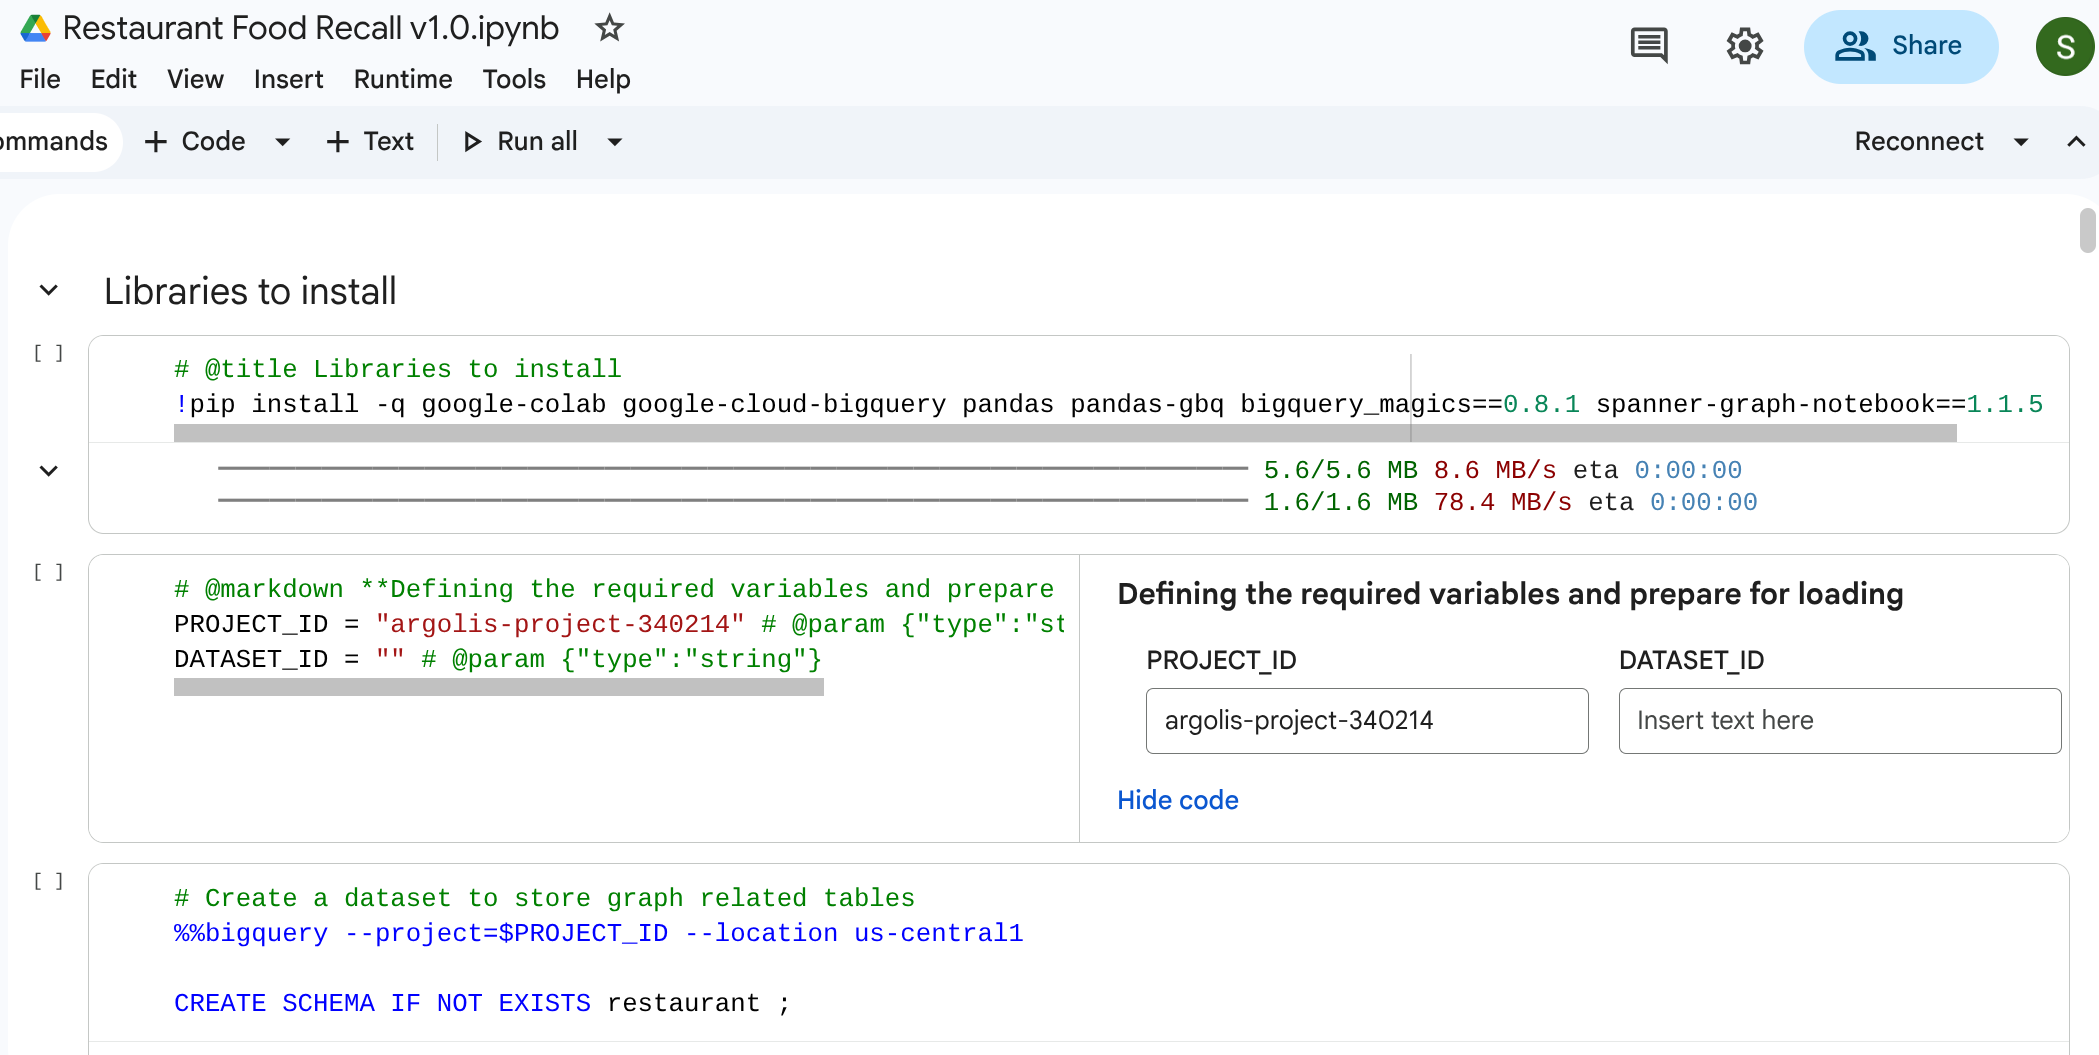
참고: (1) Google Colab에서 이를 실행하려면 BigQuery 매직 명령어(%%bigquery)를 사용할 수도 있습니다. 다음 스니펫은 그래프 데이터를 저장할 프로젝트 내에 레스토랑 스키마를 만듭니다. (2) Google Colab에서 실행하는 경우 %%bigquery –project <PROJECT_ID>를 사용해야 합니다. PROJECT_ID 필드가 사용하려는 적절한 프로젝트에 매핑되어 있는지 확인합니다. PROJECT_ID = "argolis-project-340214" # @param {"type":"string"} (3) Colab을 사용하는 경우 요구사항에 따라 일부 라이브러리를 설치해야 합니다. 그래프 시각화를 사용하는 경우 라이브러리(spanner-graph-notebook==1.1.5)를 pip로 설치해야 합니다.
%%bigquery --project=$PROJECT_ID
CREATE SCHEMA IF NOT EXISTS restaurant ;
테이블 만들기
다음 SQL 코드를 실행하여 테이블을 빌드합니다.
%%bigquery --project=$PROJECT_ID
-- 1. Item Table
DROP TABLE IF EXISTS `restaurant.item`;
CREATE TABLE `restaurant.item` (
  itemKey STRING,
  itemName STRING,
  itemCategory STRING,
  shelfLifeDays INT64,
  PRIMARY KEY (itemKey) NOT ENFORCED
);

-- 2. Location Table
DROP TABLE IF EXISTS `restaurant.location`;
CREATE TABLE `restaurant.location` (
  locationKey STRING,
  locationType STRING,
  locationCity STRING,
  locationState STRING,
  dunsNumber INT64,
  PRIMARY KEY (locationKey) NOT ENFORCED
);
-- 3. ItemLocation Table
DROP TABLE IF EXISTS `restaurant.itemlocation`;
CREATE TABLE `restaurant.itemlocation` (
  itemLocationKey STRING,
  itemKey STRING,
  locationKey STRING,
  variants INT64,
  PRIMARY KEY (itemLocationKey) NOT ENFORCED,
  -- Foreign Key Definitions
  FOREIGN KEY (itemKey) REFERENCES `restaurant.item`(itemKey) NOT ENFORCED,
  FOREIGN KEY (locationKey) REFERENCES `restaurant.location`(locationKey) NOT ENFORCED
);

-- 4. BOM Table
DROP TABLE IF EXISTS `restaurant.bom`;
CREATE TABLE `restaurant.bom` (
  bomKey INT64,
  parentItemLocation STRING,
  childItemLocation STRING,
  childQuantity FLOAT64,
  PRIMARY KEY (bomKey) NOT ENFORCED
);

-- 5. Makes Table
DROP TABLE IF EXISTS `restaurant.makes`;
CREATE TABLE `restaurant.makes` (
  itemLocationKey STRING,
  itemKey STRING,
  locationKey STRING,
  variants INT64,
  PRIMARY KEY (itemLocationKey) NOT ENFORCED
);

DROP TABLE IF EXISTS `restaurant.stored_at`;
CREATE TABLE `restaurant.stored_at` (
  itemLocationKey STRING,
  itemKey STRING,
  locationKey STRING,
  variants INT64,
  PRIMARY KEY (itemLocationKey) NOT ENFORCED
);
4. 샘플 데이터 로드
이 실습을 완전히 독립적으로 진행하기 위해 순수 SQL LOAD DATA 문을 사용하여 샘플 데이터로 테이블을 채웁니다. 이는 공급업체에서 시작하여 유통 센터 (DC)와 Commissary Kitchen을 거쳐 Retail Café에 도착하는 네트워크를 나타냅니다.
다음 SQL 쿼리를 실행하여 데이터를 로드합니다.

참고: BigQuery Studio에서 직접 실행하는 경우 %%bigquery를 생략할 수 있습니다.
%%bigquery --project=$PROJECT_ID
-- Load Item
LOAD DATA OVERWRITE `restaurant.item`
FROM FILES (format = 'CSV', uris = ['gs://supply_chain_demo/item2.csv'], skip_leading_rows = 1);

-- Load Location
LOAD DATA OVERWRITE `restaurant.location`
FROM FILES (format = 'CSV', uris = ['gs://supply_chain_demo/location.csv'], skip_leading_rows = 1);

-- Load ItemLocation
LOAD DATA OVERWRITE `restaurant.itemlocation`
FROM FILES (format = 'CSV', uris = ['gs://supply_chain_demo/itemlocation.csv'], skip_leading_rows = 1);

-- Load BOM
LOAD DATA OVERWRITE `restaurant.bom`
FROM FILES (format = 'CSV', uris = ['gs://supply_chain_demo/bom2.csv'], skip_leading_rows = 1);

-- Load Makes
LOAD DATA OVERWRITE `restaurant.makes`
FROM FILES (format = 'CSV', uris = ['gs://supply_chain_demo/makes.csv'], skip_leading_rows = 1);

-- Load StoredAt
LOAD DATA OVERWRITE `restaurant.stored_at`
FROM FILES (format = 'CSV', uris = ['gs://supply_chain_demo/itemlocation.csv'], skip_leading_rows = 1);
5. 제약 조건 추가 및 그래프 정의
그래프를 빌드하기 전에 표준 SQL 기본 키 및 외래 키 제약 조건을 사용하여 시맨틱 관계를 선언합니다. 이를 통해 BigQuery는 노드 식별자를 이해하고 에지 테이블을 노드 테이블에 연결할 수 있습니다.
속성 그래프 만들기
이제 이러한 테이블을 restaurant.bombod이라는 단일 응집 그래프 구조로 통합합니다.
다음 항목을 정의합니다.
- 노드:
item,location,itemlocation - Edges:
makes,stored_at,consists_of(BOM)
%%bigquery --project=$PROJECT_ID

CREATE OR REPLACE PROPERTY GRAPH `restaurant.bombod`
NODE TABLES (
  `restaurant.item` KEY (itemKey) LABEL item PROPERTIES ALL COLUMNS,
  `restaurant.location` KEY (locationKey) LABEL location PROPERTIES ALL COLUMNS,
  `restaurant.itemlocation` KEY (itemLocationKey) LABEL itemlocation PROPERTIES ALL COLUMNS
)
EDGE TABLES (
  `restaurant.makes`
    KEY (itemLocationKey)
    SOURCE KEY (itemLocationKey) REFERENCES `restaurant.itemlocation`(itemLocationKey)
    DESTINATION KEY (itemKey) REFERENCES `restaurant.item`(itemKey)
    LABEL makes PROPERTIES ALL COLUMNS,

  `restaurant.bom`
    KEY (bomKey)
    SOURCE KEY (childItemLocation) REFERENCES `restaurant.itemlocation`(itemLocationKey)
    DESTINATION KEY (parentItemLocation) REFERENCES `restaurant.itemlocation`(itemLocationKey)
    LABEL consists_of PROPERTIES ALL COLUMNS,

  `restaurant.stored_at`
    KEY (itemLocationKey)
    SOURCE KEY (itemLocationKey) REFERENCES `restaurant.itemlocation`(itemLocationKey)
    DESTINATION KEY (locationKey) REFERENCES `restaurant.location`(locationKey)
    LABEL stored_at PROPERTIES ALL COLUMNS
);
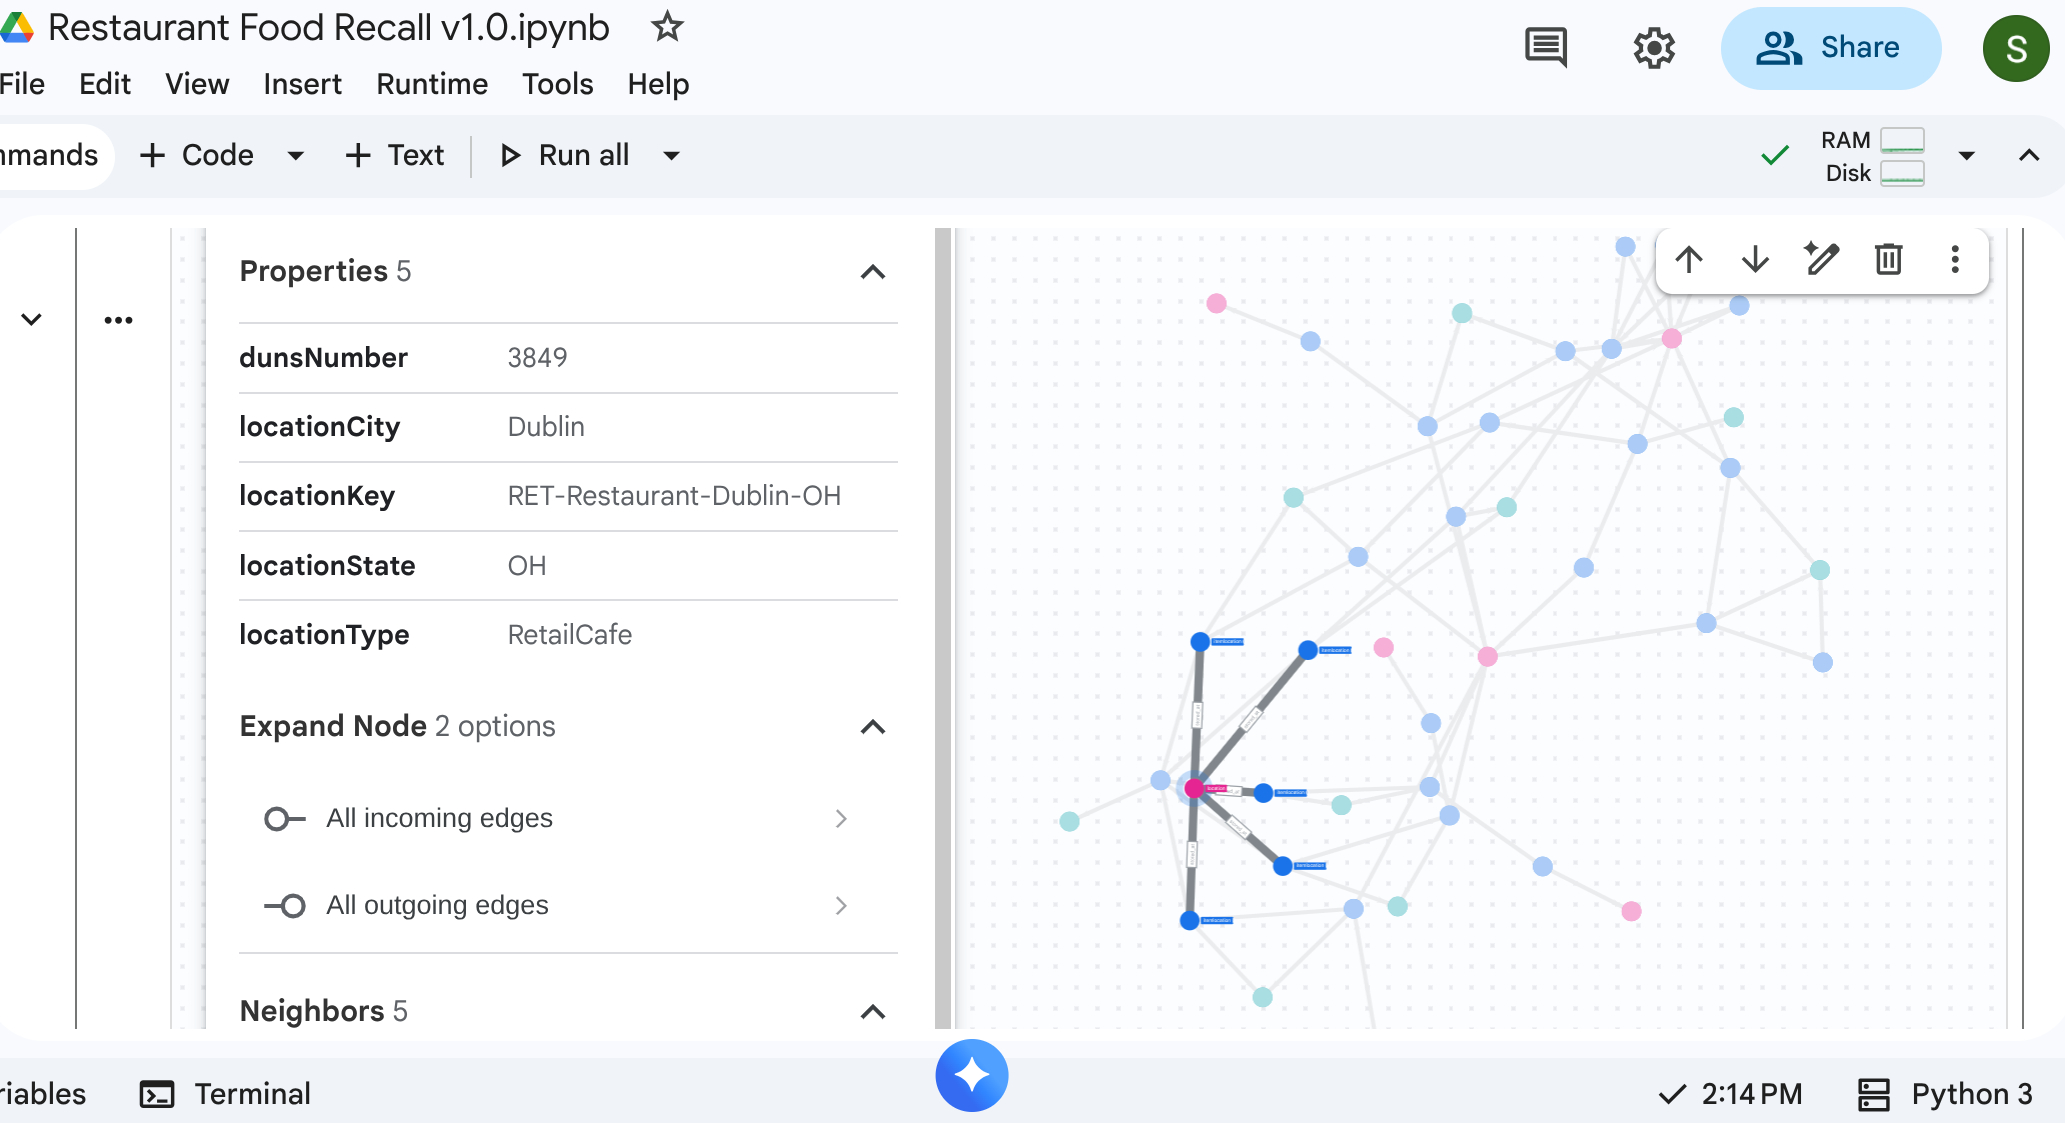
6. 공급망 시각화
하향식 순회 쿼리를 실행하여 전체 공급망 네트워크를 확인할 수 있습니다. 표준 노트북 또는 이를 지원하는 UI (예: %%bigquery --graph)에서 시각적 지도를 반환합니다.
절대 그래프 쿼리를 사용하여 노드와 에지를 설정합니다.
참고: 앞에서 언급한 것처럼 Google Colab 또는 Colab Enterprise 노트북에서 이를 실행하려면 BigQuery 매직 명령어 %%bigquery를 사용할 수도 있습니다. 또한 Google Colab 또는 Colab Enterprise 노트북에서 그래프를 시각화하려면 %%bigquery –graph와 같이 –graph 플래그를 포함하세요.
%%bigquery  --project=$PROJECT_ID --graph output

Graph restaurant.bombod

match p=(a:itemlocation)-[c:consists_of]->(b:itemlocation)
match q=(a)-[d:stored_at]->(e:location)
optional match z=(f)-[g:makes]-(b)

return to_json(p) as ppath, to_json(q) as qpath, to_json(z) as zpath
출력:
7. 사용 사례 1: 업스트림 불만 추적
시나리오: 고객이 뉴욕 매장에서 구매한 샌드위치의 닭고기 품질에 대해 불만을 제기합니다. 완성된 항목을 거꾸로 추적하여 즉각적인 조립 단계를 확인해야 합니다.
순회 쿼리
그래프 탐색 쿼리 형식을 사용하여 쿼리를 실행합니다. 이는 어셈블리를 다운스트림에서 업스트림 성분까지 연결하는 consists_of 가장자리를 살펴봅니다.
%%bigquery --project=$PROJECT_ID --graph

GRAPH restaurant.bombod
MATCH p=(a:itemlocation)-[c:consists_of]->(b:itemlocation)
OPTIONAL MATCH q=(b)-[d:stored_at]-(e)
return to_json(p) as ppath, to_json(q) as qpath
consists_of Edge Table (Ingredient -> Finished)의 화살표 방향으로 인해 업스트림으로 흐르는 검색은 종속 자료와 저장 위치를 빠르게 격리하는 링크를 생성합니다.
출력: 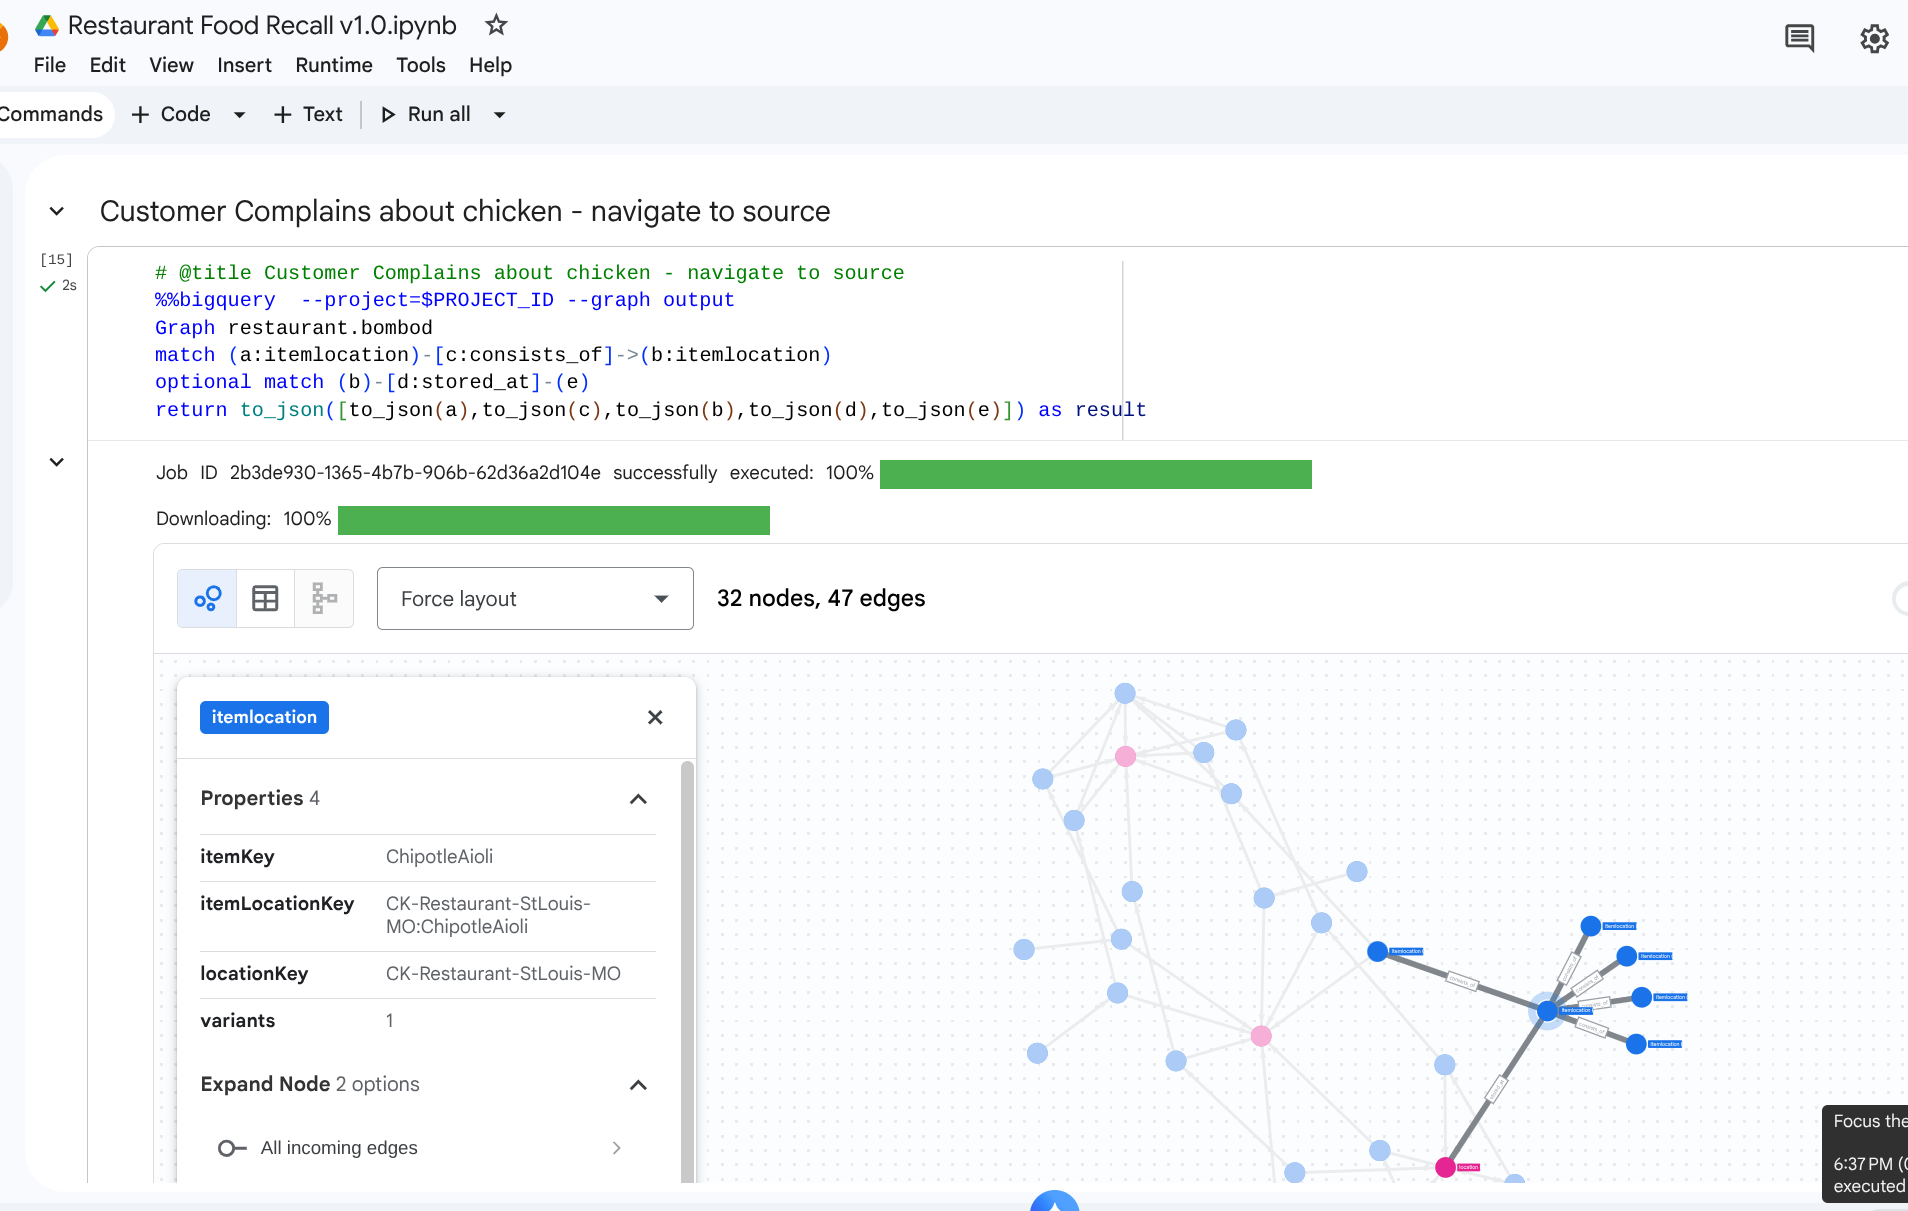
8. 사용 사례 2: 영향 분석
시나리오: 눈보라로 인해 오하이오주 콜럼버스의 유통 센터가 폐쇄되었습니다. 즉시 영향을 받는 다운스트림 준비 또는 완제품을 알아야 합니다.
순회 쿼리
유통 센터를 나타내는 특정 location에서 시작하여 거기에 저장된 인벤토리를 식별하고 어떤 완제품에 필요한지 확인합니다.
# @title Impact of a storm on a DC

%%bigquery  --project=$PROJECT_ID --graph
Graph restaurant.bombod
match path1=(z:itemlocation)-[m:stored_at]->(dc:location) where dc.locationKey like '%DC-Sysco-Columbus-OH%'
match path2=(z:itemlocation)-[c:consists_of]->(b:itemlocation)
match path3=(b:itemlocation)-[n:makes]->(item:item)
optional match path4=(b)-[p:stored_at]->(q:location)
return to_json(path1) as path1, to_json(path2) as path2,to_json(path3) as path3, to_json(path4) as path4
출력: 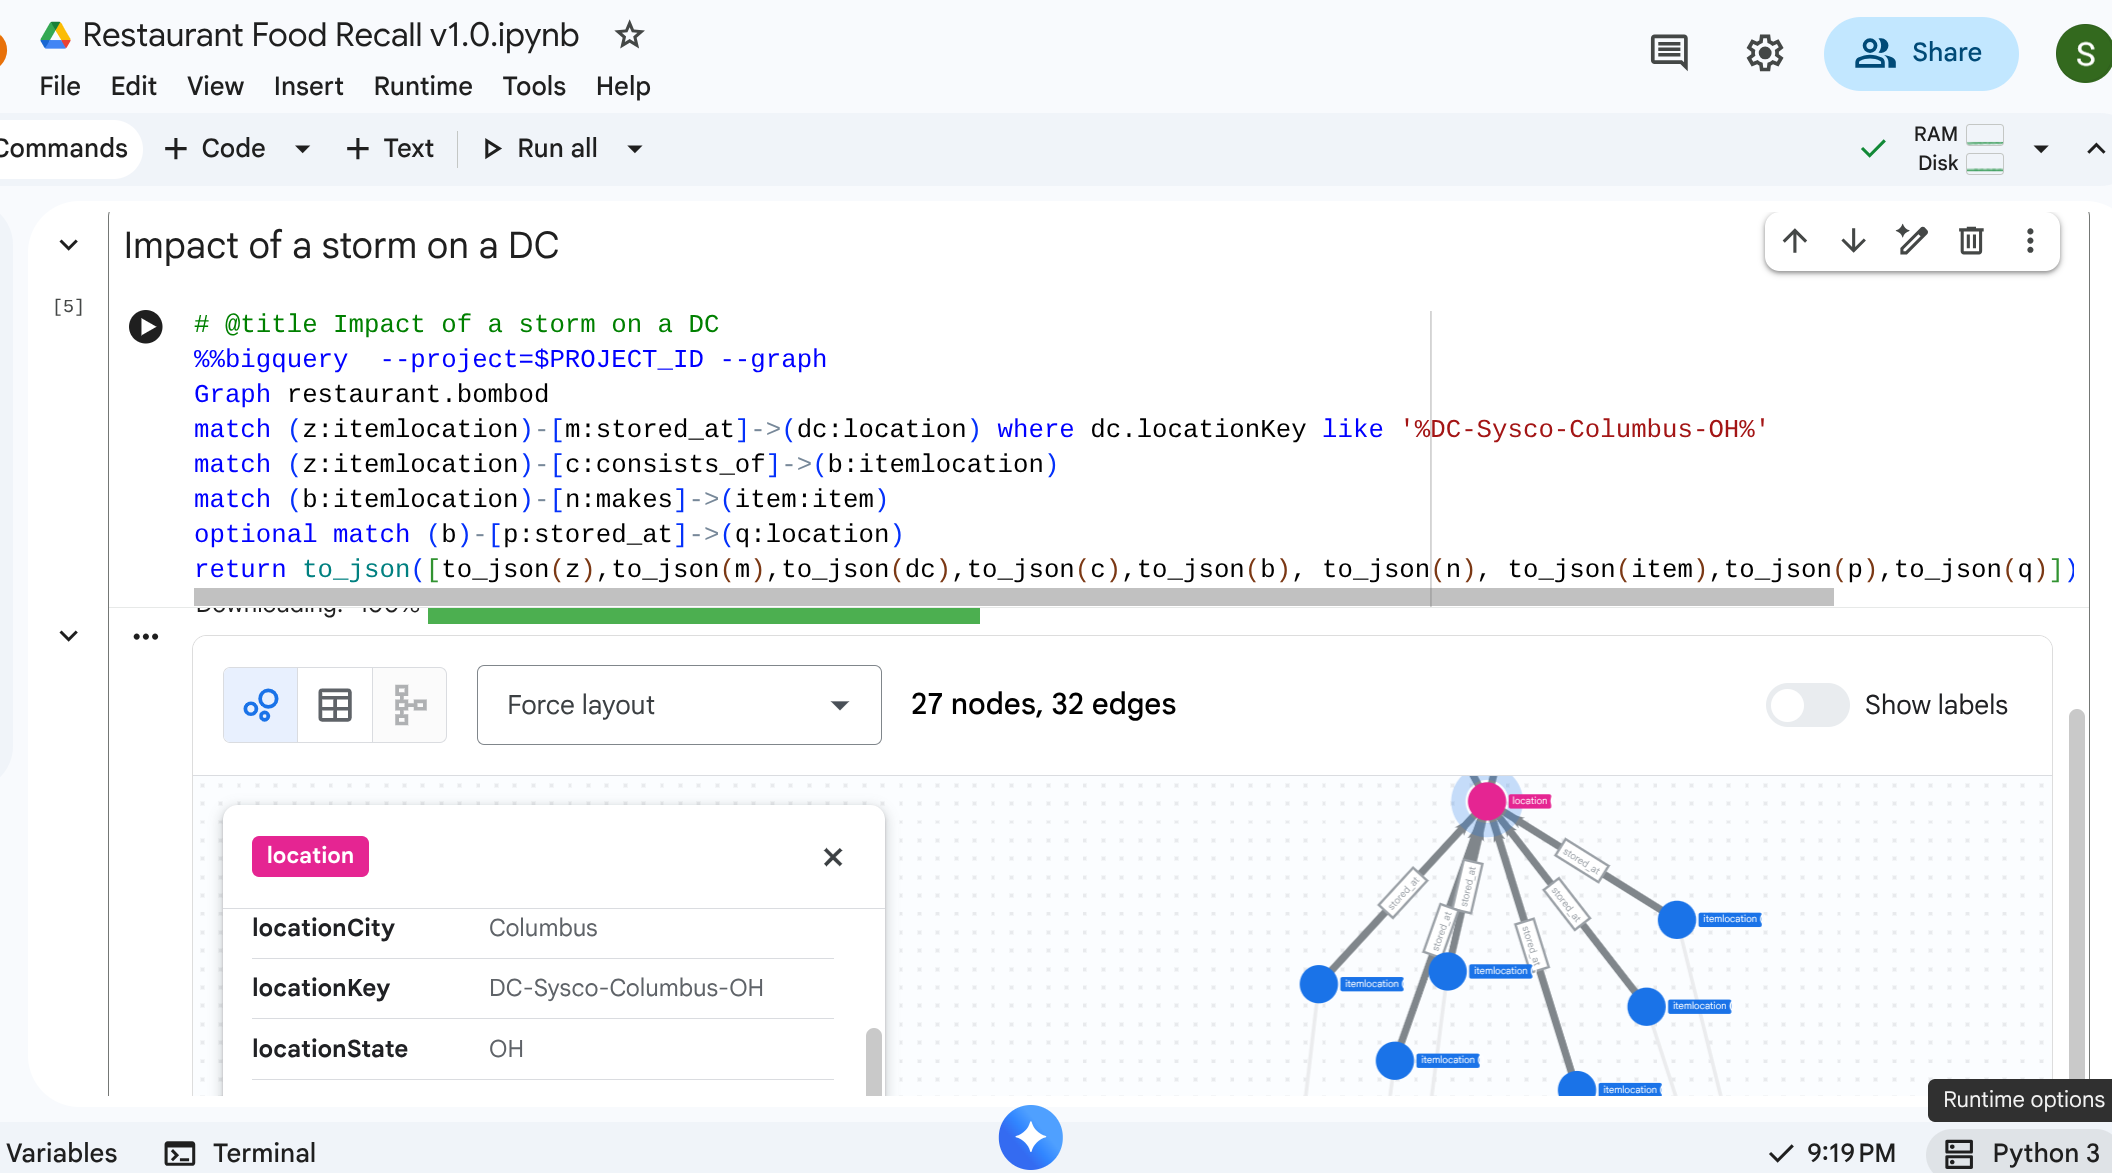
9. 사용 사례 3: 다운스트림 리콜
시나리오: 공급업체에서 오염된 특정 제품(공급업체의 완숙 토마토)을 알려줍니다. 카페에서 영향을 받는 모든 최종 메뉴 항목을 찾아야 합니다.
순회 쿼리
오염된 원자재 위치를 찾은 다음 다운스트림으로 흐르는 경로 순회를 실행하여 최종적으로 영향을 받는 항목을 찾습니다.
%%bigquery  --project=$PROJECT_ID --graph
Graph restaurant.bombod
match path1=(a:itemlocation)-[c:consists_of]->(b:itemlocation)-[e:makes]->(f:item) where f.itemKey like '%Tomato%'
return to_json(path1) as result
이 쿼리는 'Tomato'와 패턴이 일치하고 업스트림 관계와 얽혀 있어 회수해야 하는 카페 상품을 검색하는 데 강력한 매핑을 제공하는 모든 항목을 찾습니다.
출력: 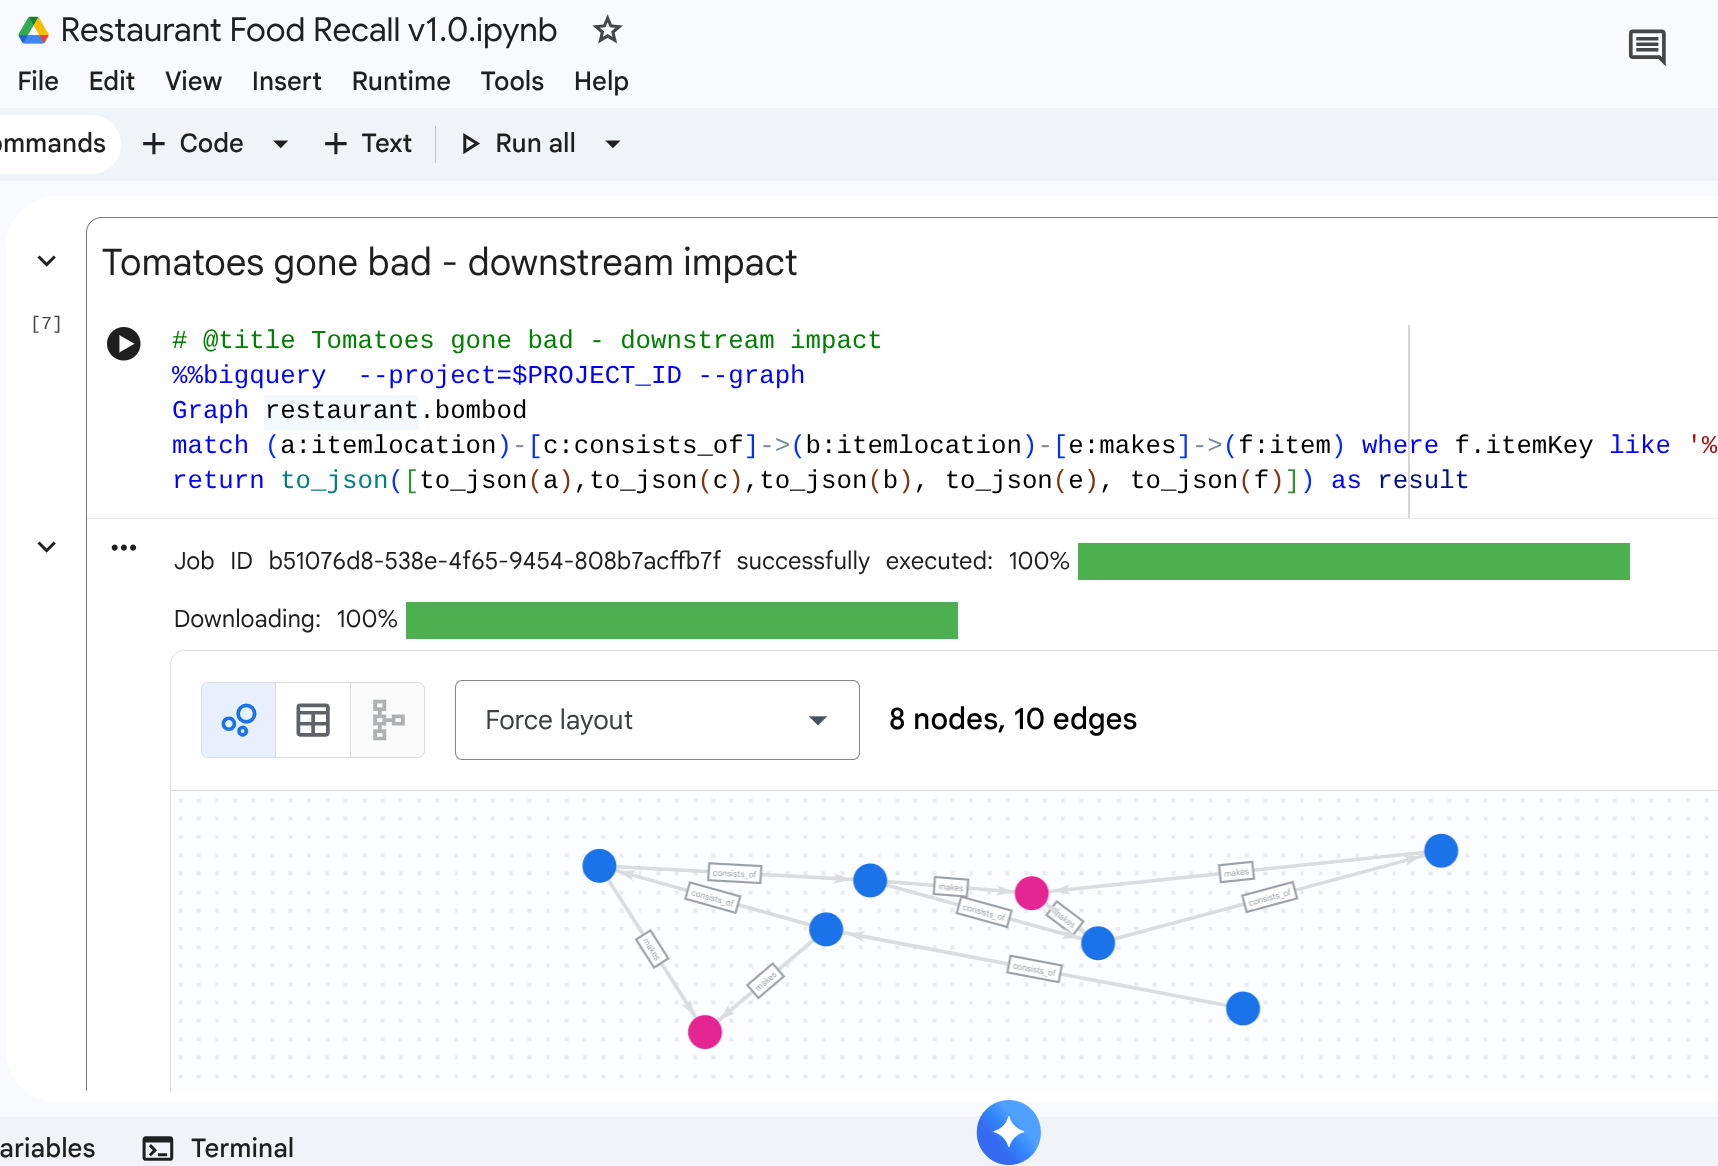
10. 삭제
연습 단계를 완료한 후에는 작업공간에 잔여 요금이 발생하지 않도록 리소스를 삭제하세요.
DROP SCHEMA `restaurant` CASCADE;
11. 결론
축하합니다. BigQuery 그래프를 사용하여 공급망을 모델링하고 영향 분석을 실행했습니다.
마무리
학습한 내용
- 기본 키/외래 키를 사용하여 그래프 중심 관계형 관계를 선언합니다.
- 통합 속성 그래프를 만듭니다.
- 그래프 쿼리 순회 로직을 사용하여 멀티 노드 관계를 효율적으로 탐색합니다.
그래프 아키텍처에 대한 자세한 내용은 Google Cloud 문서를 참고하세요.