
1. Introduction
In this lab, you will step into the role of a lead data investigator for a global logistics firm. A high-value cargo container carrying precious Android figurine collectibles has gone missing! To find its last known position and trace its route, you must aggregate fragmented shipping manifests from regional logistics partners and unstructured transponder log files. To do so, you will configure a modern Google Cloud Open Data Lakehouse.

What you'll do
- Configure the Google Cloud Data Agent Kit extension in Cloud Shell Editor.
- Create a Cloud Storage bucket and provision a Lakehouse Apache Iceberg REST Catalog and namespace.
- Map a BigLake external table to raw JSON partner manifests in Cloud Storage to discover the ship's departure clue.
- Load and process unstructured transponder text logs using Managed Service for Apache Spark serverless. Perform regex normalizations and dynamic clue extraction to target the lost payload destination.
- Write the parsed log metrics as an Apache Iceberg table through the REST catalog.
- Chat with an AI agent about your Apache Iceberg data using Conversational Analytics to discover hidden clues about your lost shipment.
- Leverage automated data insights with Knowledge Catalog to generate metadata about your data.
- Establish ingestion guardrails by creating a security taxonomy and using Knowledge Catalog to apply fine-grained access control via masking sensitive custodian IDs.
What you'll need
- A web browser such as Chrome.
- A Google Cloud project with billing enabled.
- Familiarity with basic SQL queries and terminal commands.
Expected Cost and Duration
- Time to complete: ~45 minutes.
- Estimated Cost: Less than $5.00 USD.
2. Before you begin
Create or Select a Google Cloud Project
- In the Google Cloud Console, select or create a Google Cloud project.
- Make sure that billing is enabled for your Cloud project. Learn how to confirm billing is enabled on a project.
Configure the Environment
You will run most of your commands from the integrated terminal in the Cloud Shell Editor, a cloud-based development environment that comes pre-loaded with developer tools and the standard Google Cloud SDK.
- Open Cloud Shell Editor in a new tab.
- Run the following command in the terminal to clone the repository:
cd ~/ git clone --filter=blob:none --no-checkout https://github.com/GoogleCloudPlatform/devrel-demos.git cd ~/devrel-demos git sparse-checkout init --cone git sparse-checkout set data-analytics/data-cloud-roadshow/lab1 git checkout main cd data-analytics/data-cloud-roadshow/lab1 - Set your project ID. You can also
Ctrl+Shift+Von Windows/Linux, orCmd+Von macOS to paste this into the terminal:export PROJECT_ID="<YOUR_PROJECT_ID>" - Now configure it in your environment.
gcloud config set project $PROJECT_ID - Select a region.
export REGION="<YOUR_REGION>" # Replace with the region you chose, such as "us-central1" - Enable the required APIs.
gcloud services enable \
  bigquery.googleapis.com \
  biglake.googleapis.com \
  storage.googleapis.com \
  dataplex.googleapis.com \
  datacatalog.googleapis.com \
  dataproc.googleapis.com \
  aiplatform.googleapis.com \
  cloudresourcemanager.googleapis.com \
  serviceusage.googleapis.com \
  cloudaicompanion.googleapis.com \
  geminidataanalytics.googleapis.com
Install Extension
You will now configure the Google Data Agent Kit extension, a tool for interacting with Google Cloud's data tools directly in your IDE.
- In the editor's left activity bar, click the Extensions icon (or press
Ctrl+Shift+Xon Windows/Linux, orCmd+Xon macOS). - In the extensions search box, type:
Google Cloud Data Agent Kit - Select the official extension from the results and click Install. If prompted, select "Yes, I trust the authors".
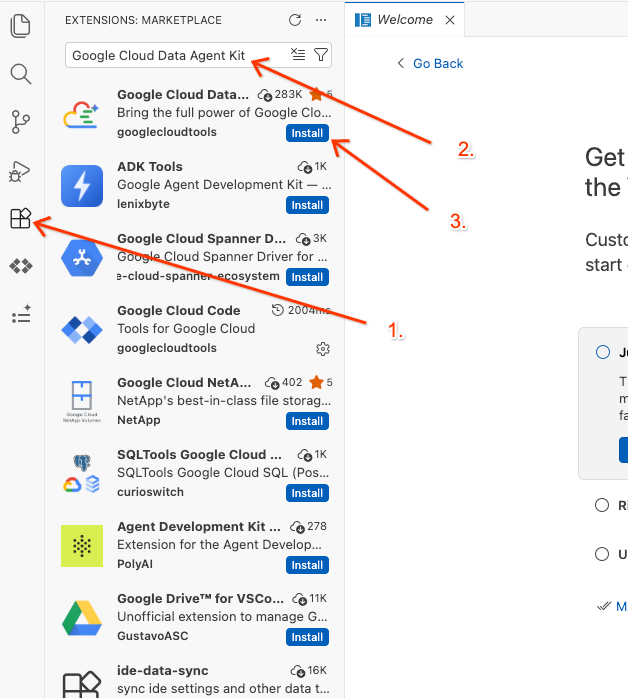
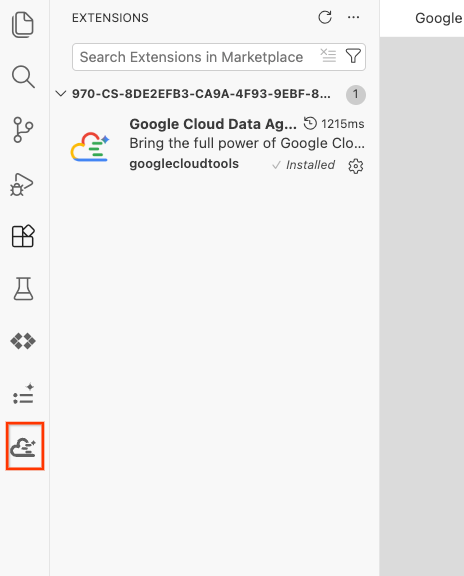
- Once successfully installed, you should see the Google Cloud Data Agent Kit icon displayed in the activity bar! Click it.
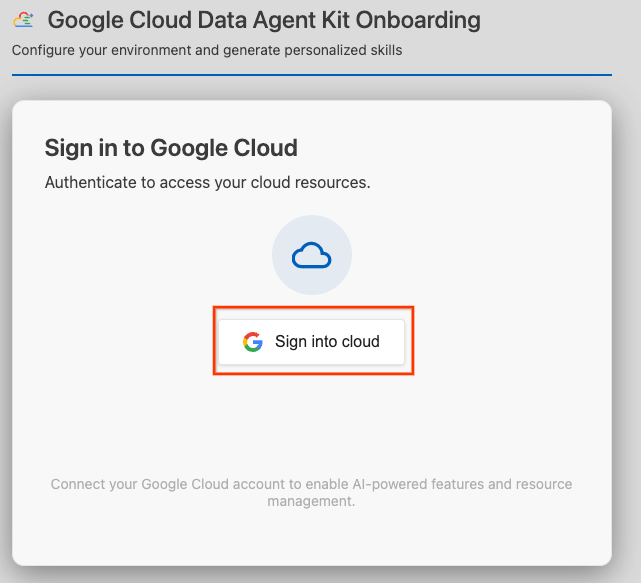
- Click Sign into cloud.
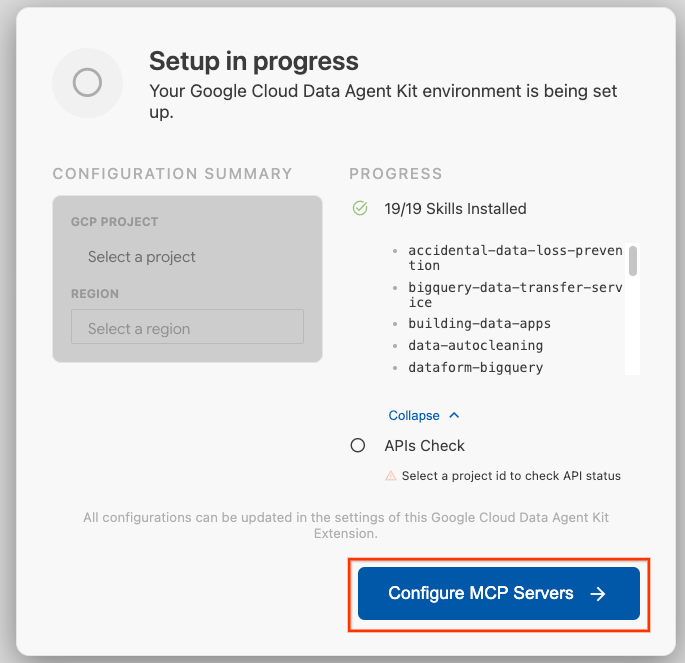
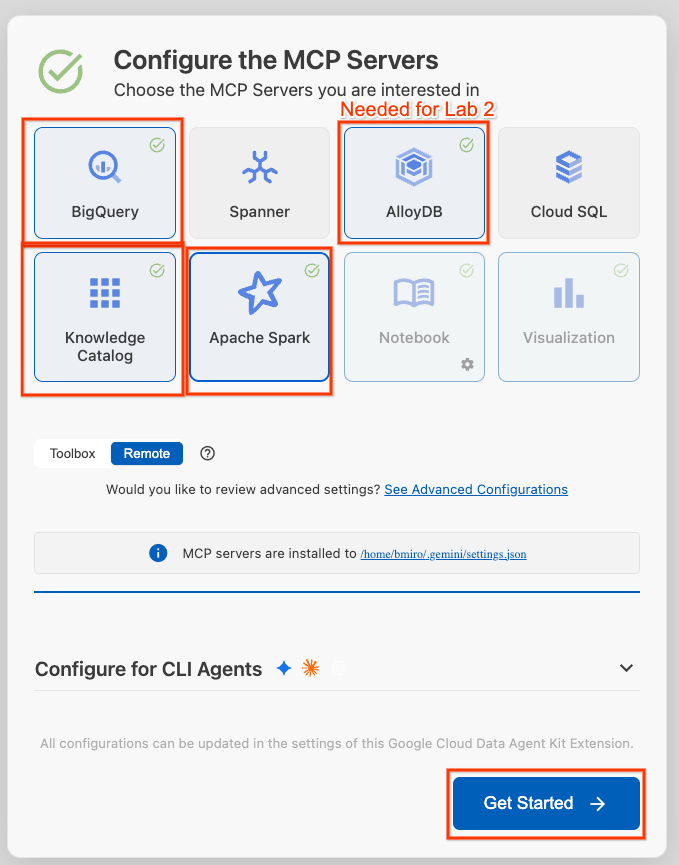
- Click Configure MCP Servers.
- Select BigQuery, Knowledge Catalog, Apache Spark, and AlloyDB. You will use AlloyDB in Lab 2. Then click Get Started.
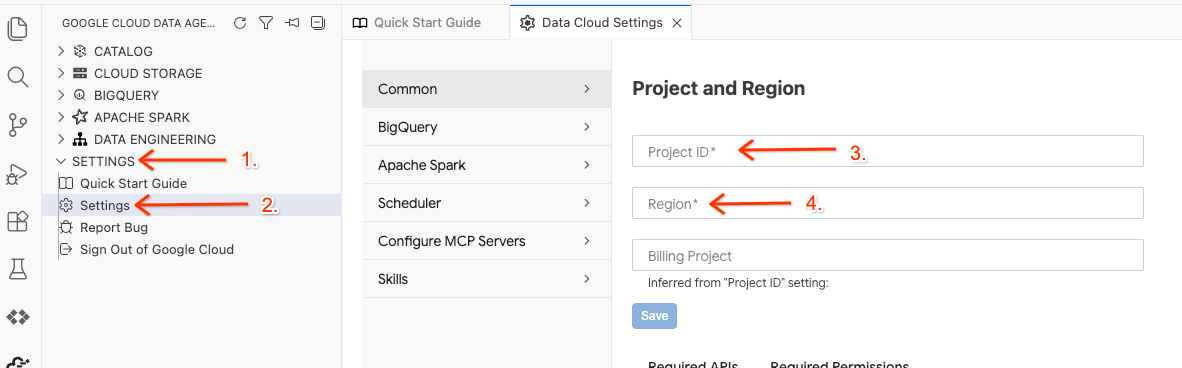
- Click the Project ID selector in the bottom status bar and choose your active Google Cloud project.
- In the Data Agent Kit, click SETTINGS, then Settings, and in the Common tab select your Project ID and Region to run your lab, such as us-central1.
- Click BigQuery Settings and replace the Region with the region you previous selected. Click Save.
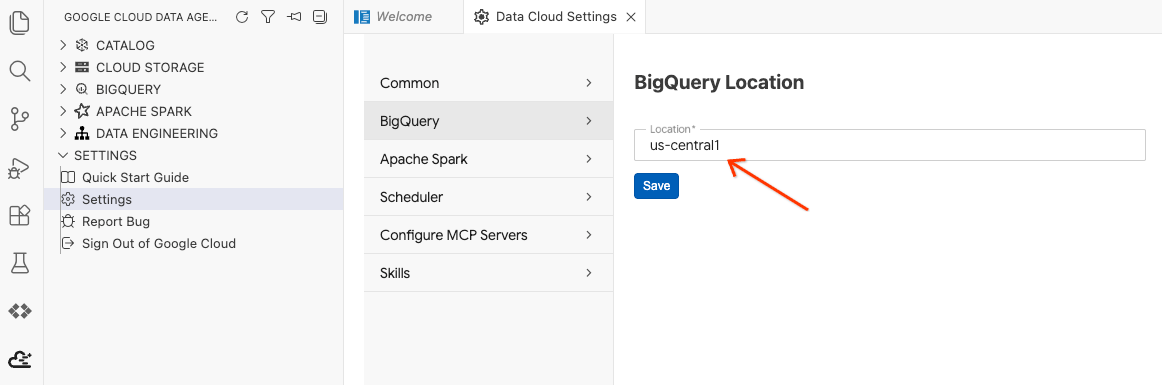
You are now ready to use the Data Agent Kit!
Execute Environment Setup Script
In the terminal, run the setup script to create the necessary background resources for this lab and configure IAM permissions:
chmod +x setup_lab1.sh
./setup_lab1.sh
source .env
You should see a serious of output steps showing what resources are being provisioned. We'll cover these throughout the lab.
Once you see a completion message, you're ready to go:
====================================================
Environment Setup Complete!
====================================================
Now, let's begin our search!
3. Ingest Partner Shipping Manifests
Shipping manifest data from partner vessels is stored in standard JSON Lines (JSONL) format in your bucket: gs://${PROJECT_ID}-lost-cargo-lake/shipping_manifests/manifests.jsonl.
Before carrying out deep analytics, you will create a governed BigLake table for this unstructured data. This allows you to explore partner logistics data immediately using standard SQL without duplicate import costs.
Open the Workspace in the Editor and run the query
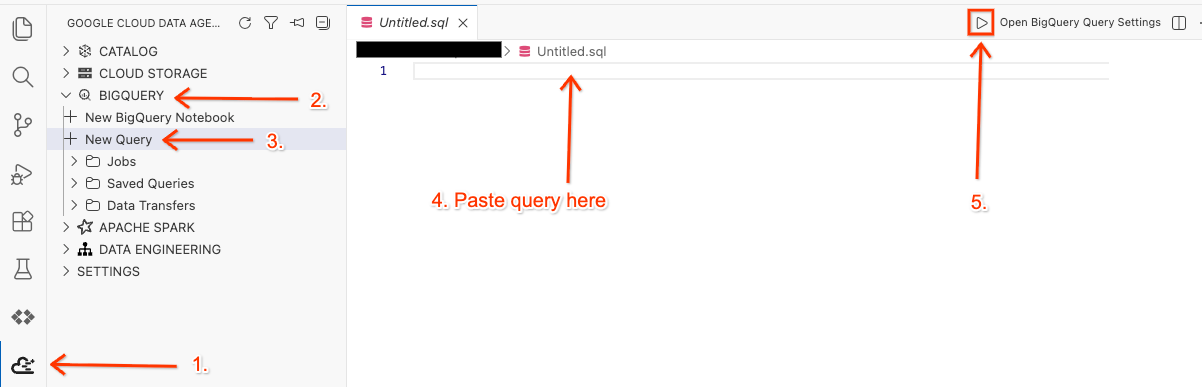
- In your Cloud Shell Editor, click on the Google Cloud Data Agent Kit extension icon on the side panel.
- Go to BigQuery and select + New Query.
- Copy the following query into the query window.
SET @@location = "<YOUR_REGION>"; --Update to your resource region, such as "us-central1". Make sure it is in quotes.

EXECUTE IMMEDIATE ("""
CREATE OR REPLACE EXTERNAL TABLE `lost_cargo_dataset.shipping_manifests`
(
  shipment_id STRING,
  timestamp TIMESTAMP,
  last_ping_lat FLOAT64,
  last_ping_long FLOAT64,
  seal_integrity_status INT64,
  custodian_id STRING OPTIONS(description='Masked identification token for official cargo custodian personnel.')
)
WITH CONNECTION `""" || @@location || """.conn`
OPTIONS (
  format = 'NEWLINE_DELIMITED_JSON',
  uris = ['gs://""" || @@project_id || """-lost-cargo-lake/shipping_manifests/*.jsonl']
)
""");
- Click Run.
- To verify that the table was created, you will see a success message in the Query Results panel that automatically slides open at the bottom.
Query the external table to isolate compromised transponders
Let's identify the compromised transponders by locating failures when the seal_integrity_status was set to 0. Copy and run the following query in the query window you opened before:
SELECT shipment_id, last_ping_lat, last_ping_long, custodian_id
FROM `lost_cargo_dataset.shipping_manifests`
WHERE seal_integrity_status = 0;
In the Query Results panel, you should see output similar to this:
shipment_id | last_ping_lat | last_ping_long | custodian_id |
MV-CAT-001 | 51.5074 | -0.1278 | usr_999_shadow |
4. Process Unstructured Logs with Managed Service for Apache Spark
You've found the starting location from the structured manifests, but the lost transponder has gone completely dark The last transponder ping left a cryptic, unstructured message inside a raw text log file in the GCS path gs://${BUCKET_NAME}/raw_logs/maritime_logs.txt.
To process and map this text log, extract timestamps, camouflage identities, and locate the cargo's downstream route, you will submit a serverless Apache Spark (PySpark) job to Managed Service for Apache Spark.
Managed Service for Apache Spark allows you to run Spark workloads without provisioning or managing a cluster. The service handles the underlying compute resources, autoscaling them dynamically, and you only pay for the execution duration.
The script will:
- Ingest the raw, bracketed, unstructured transponder text.
- Apply PySpark SQL regex extraction filters to separate timestamps, custodian metadata, and raw content.
- Split the messy logs into clean, sentence-level records.
- Extract the dynamic destination coordinate target where the lost payload departures ended.
- Connect and write the processed log dataframe back into your Lakehouse Apache Iceberg REST Catalog as a new analytics table visible directly within BigQuery.
Fix the PySpark Analysis Script
There have been reports of Python Pirates at sea causing all sorts of problems.
- Run the following to open the file
process_maritime_logsin your Cloud Shell Editor.cd ~/devrel-demos/data-analytics/data-cloud-roadshow/lab1 cloudshell open ./process_maritime_logs.py - Spend some time to read the code and understand what it's doing.
- Make sure nothing in the code looks suspicious! If you need to delete anything, make sure you save the file using
Ctrl + S(Windows/Linux) orCmd + S(Mac).
Submit the Serverless Spark Job
Submit the job using the gcloud SDK. The config automatically configures the PySpark job to access the Lakehouse catalog.
Run the following command in your integrated editor terminal.
cd ~/devrel-demos/data-analytics/data-cloud-roadshow/lab1
source .env

gcloud dataproc batches submit pyspark process_maritime_logs.py \
    --project=${PROJECT_ID} \
    --region=${REGION} \
    --version=2.3 \
    --deps-bucket=${BUCKET_NAME} \
    --properties="\
spark.sql.defaultCatalog=cargo_catalog,\
spark.sql.catalog.${CATALOG_NAME}=org.apache.iceberg.spark.SparkCatalog,\
spark.sql.catalog.${CATALOG_NAME}.type=rest,\
spark.sql.catalog.${CATALOG_NAME}.uri=https://biglake.googleapis.com/iceberg/v1/restcatalog,\
spark.sql.catalog.${CATALOG_NAME}.warehouse=gs://${BUCKET_NAME},\
spark.sql.catalog.${CATALOG_NAME}.header.x-goog-user-project=${PROJECT_ID},\
spark.sql.catalog.${CATALOG_NAME}.rest.auth.type=org.apache.iceberg.gcp.auth.GoogleAuthManager,\
spark.sql.extensions=org.apache.iceberg.spark.extensions.IcebergSparkSessionExtensions,\
spark.sql.catalog.${CATALOG_NAME}.gcs.oauth2.refresh-credentials-endpoint=https://oauth2.googleapis.com/token, \
spark.sql.catalog.${CATALOG_NAME}.header.X-Iceberg-Access-Delegation=vended-credentials" \
-- ${BUCKET_NAME}
Wait a few minutes for the serverless environment to spin up, upload your script, and execute the processing logic.
Once you see output similar to the following, your processed table is saved to the Lakehouse catalog as an Apache Iceberg managed table!
Batch [1fae0b4b42c045a084dd67917bd0c332] finished.
metadata:
  '@type': type.googleapis.com/google.cloud.dataproc.v1.BatchOperationMetadata
  batch: projects/<YOUR_PROJECT>/locations/us-central1/batches/1fae0b4b42c045a084dd67917bd0c332
  batchUuid: 611b4465-fdac-4974-bc47-5f10adaf2a08
  createTime: '2026-06-11T21:35:01.868157Z'
  description: Batch
  labels:
    goog-dataproc-batch-id: 1fae0b4b42c045a084dd67917bd0c332
    goog-dataproc-batch-uuid: 611b4465-fdac-4974-bc47-5f10adaf2a08
    goog-dataproc-drz-resource-uuid: batch-611b4465-fdac-4974-bc47-5f10adaf2a08
    goog-dataproc-location: us-central1
  operationType: BATCH
name: projects/<YOUR_PROJECT/regions/us-central1/operations/7e2044db-dd97-3270-b368-4dc4ba417574
Preview the Processed Logs
In Data Agent Kit extension Query editor, copy the following query to preview the data:
SET @@location = "<YOUR_REGION>"; -- e.g. "us-central1"

EXECUTE IMMEDIATE FORMAT("""
select log_timestamp, custodian_id, sentence from
`%s.%s-lost-cargo-lake.lost_cargo_namespace.processed_maritime_logs`
limit 5
""", @@project_id, @@project_id);
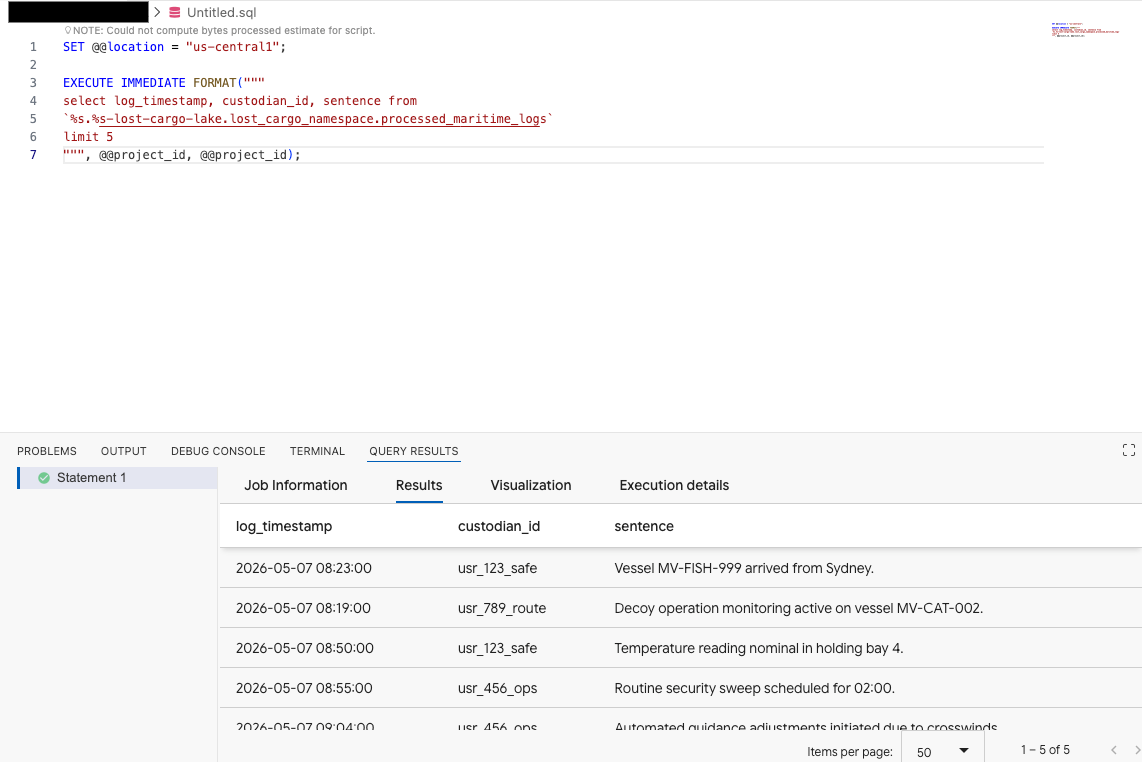
This shows the Iceberg table registered in the catalog can successfully be accessed from BigQuery!
Extract the Destination Clue
Now that we have the processed logs, let's search for the logs that include a destination target. From there, we can search the logs to which include a mention of our origin city.
In your query editor, run the following query, replacing <YOUR_REGION> with your region and replacing <ORIGIN_CITY> with the origin city you discovered earlier.
SET @@location = "<YOUR_REGION>"; --e.g. "us-central1"

DECLARE origin_city STRING;

SET origin_city = "<ORIGIN_CITY>"; --e.g. "Boston". (It's not Boston)

EXECUTE IMMEDIATE FORMAT(r"""
SELECT
  log_timestamp AS event_time,
  custodian_id,
  REGEXP_EXTRACT(raw_message, r'Destination:\s*([^.]+)') AS destination_target
FROM
  `%s.%s-lost-cargo-lake.lost_cargo_namespace.processed_maritime_logs`
WHERE
  -- STRPOS is highly optimized in BigQuery for a simple .contains() substring check
  STRPOS(sentence, '%s') > 0;
""", @@project_id, @@project_id, origin_city);
Chat with your Data in the BigQuery Console using Conversational Analytics
Instead of writing complex SQL queries to explore your data, you can use Conversational Analytics to chat with your tables using natural language!
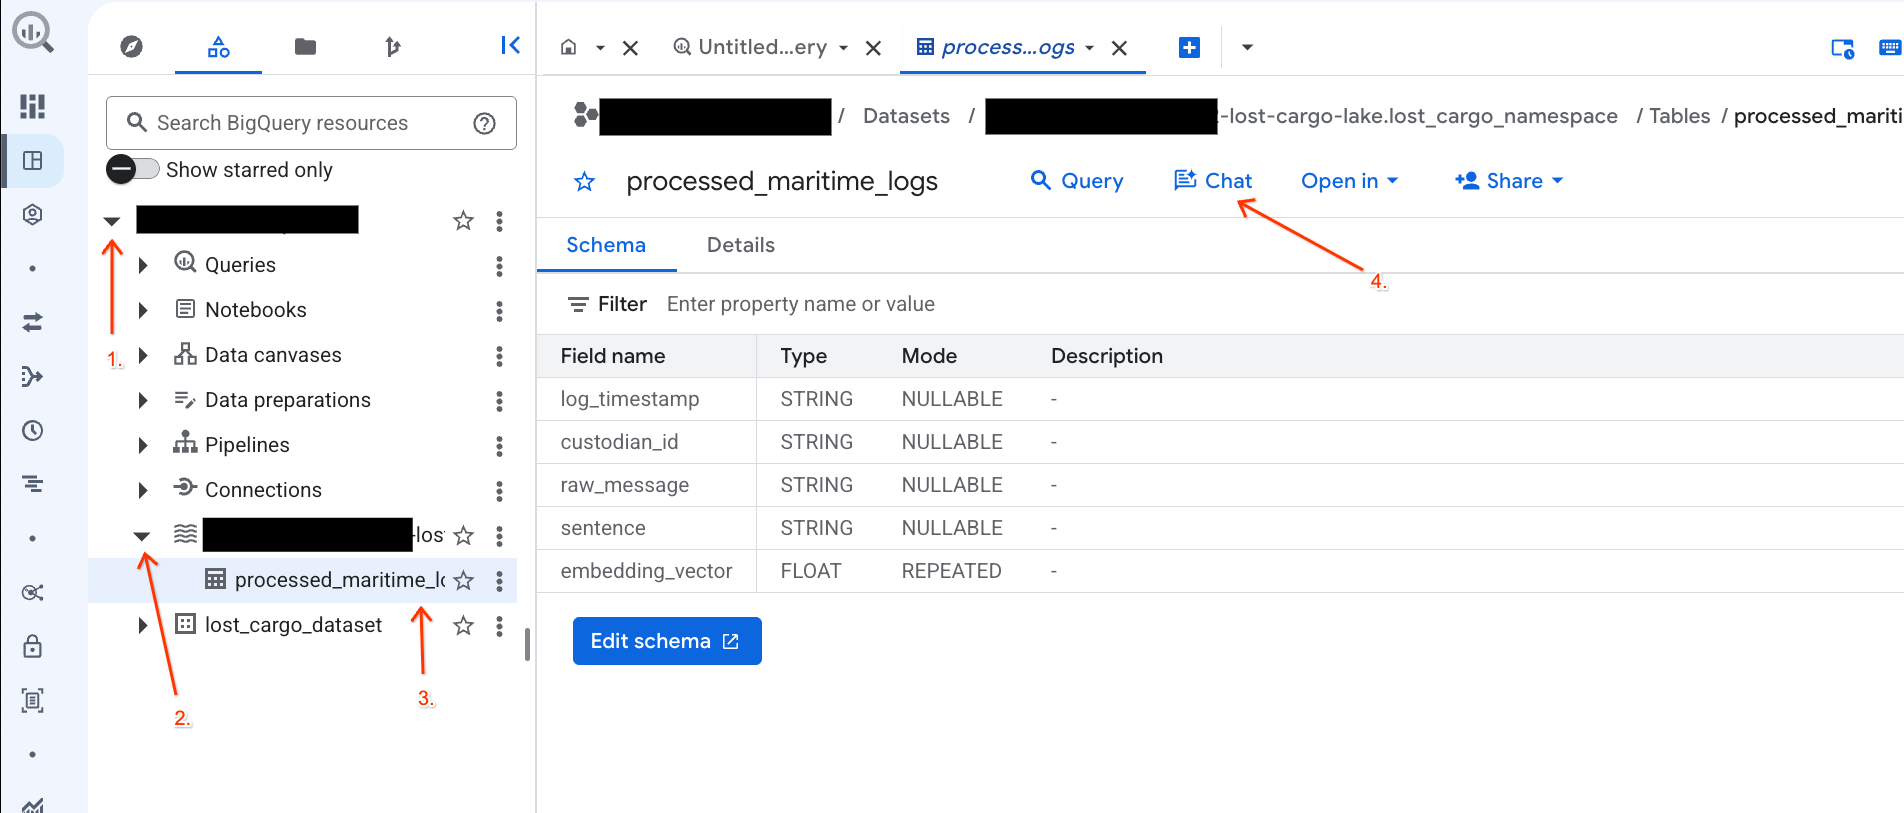
- Go to the BigQuery Console.
- In the Explorer panel on the left, expand your project and the dataset
-lost-cargo-lake.lost_cargo_namespace processed_maritime_logstable to open its details tab. - Next to Query, click Chat.
- In the chat panel, type the following question and press Enter on your keyboard to send:
Based on this table, what color is the shipping container MV-CAT-001?
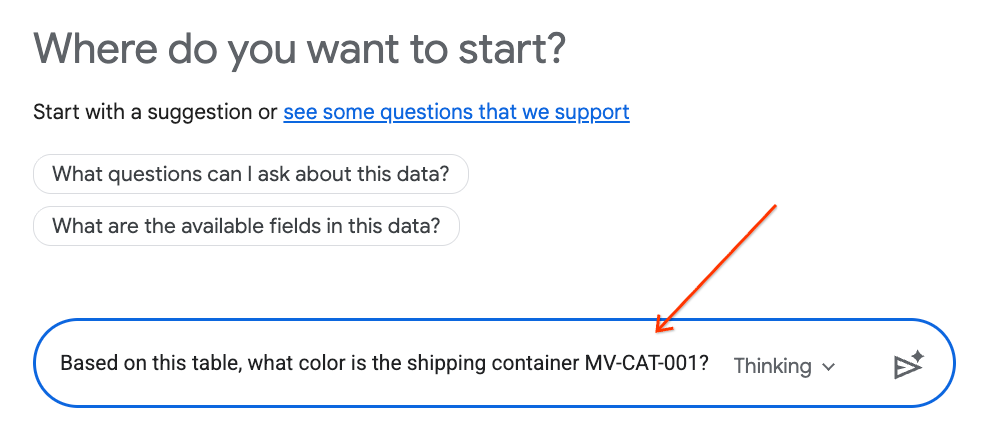
- Conversational Analytics (powered by Gemini) will analyze the active table's data and respond with the color.
5. View the Centralized Lakehouse Catalog
To integrate open-source processing engines (like Apache Spark) securely and seamlessly with enterprise data engines (like BigQuery), your setup script configured a Lakehouse Iceberg REST Catalog.
The Apache Iceberg REST Catalog serves as the serverless "single source of truth" for table metadata, managing schemas and partitioning tables dynamically while storing physical Parquet data files in Cloud Storage.
Let's examine this catalog directly in the Google Cloud Console:
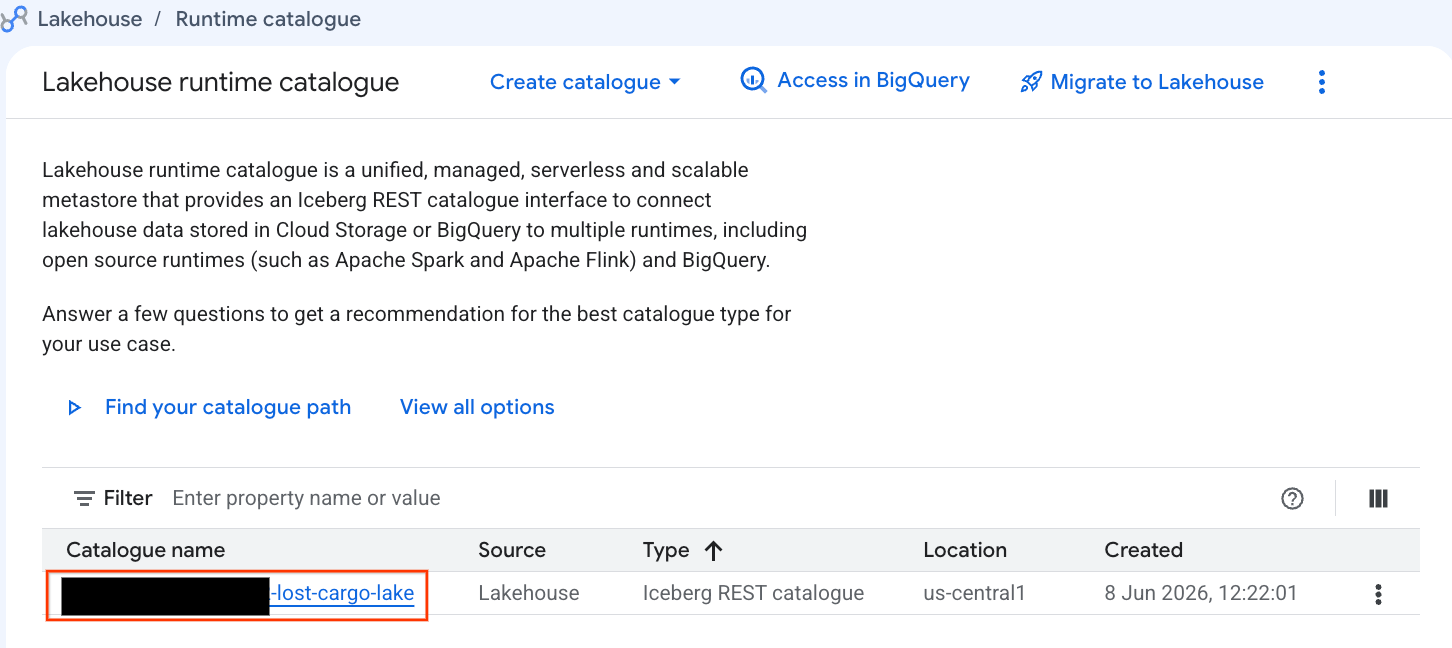
- Open the Lakehouse Console.
- In the Catalogs tab, locate and click on your active Iceberg REST Catalog:
-lost-cargo-lake
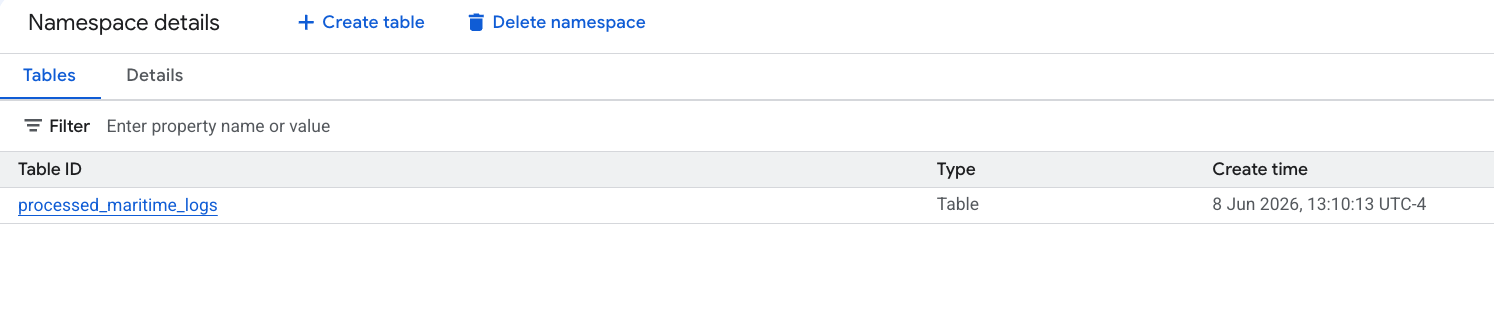
- In the catalog details view, under Namespaces you should see
lost_cargo_namespace. Click on it.
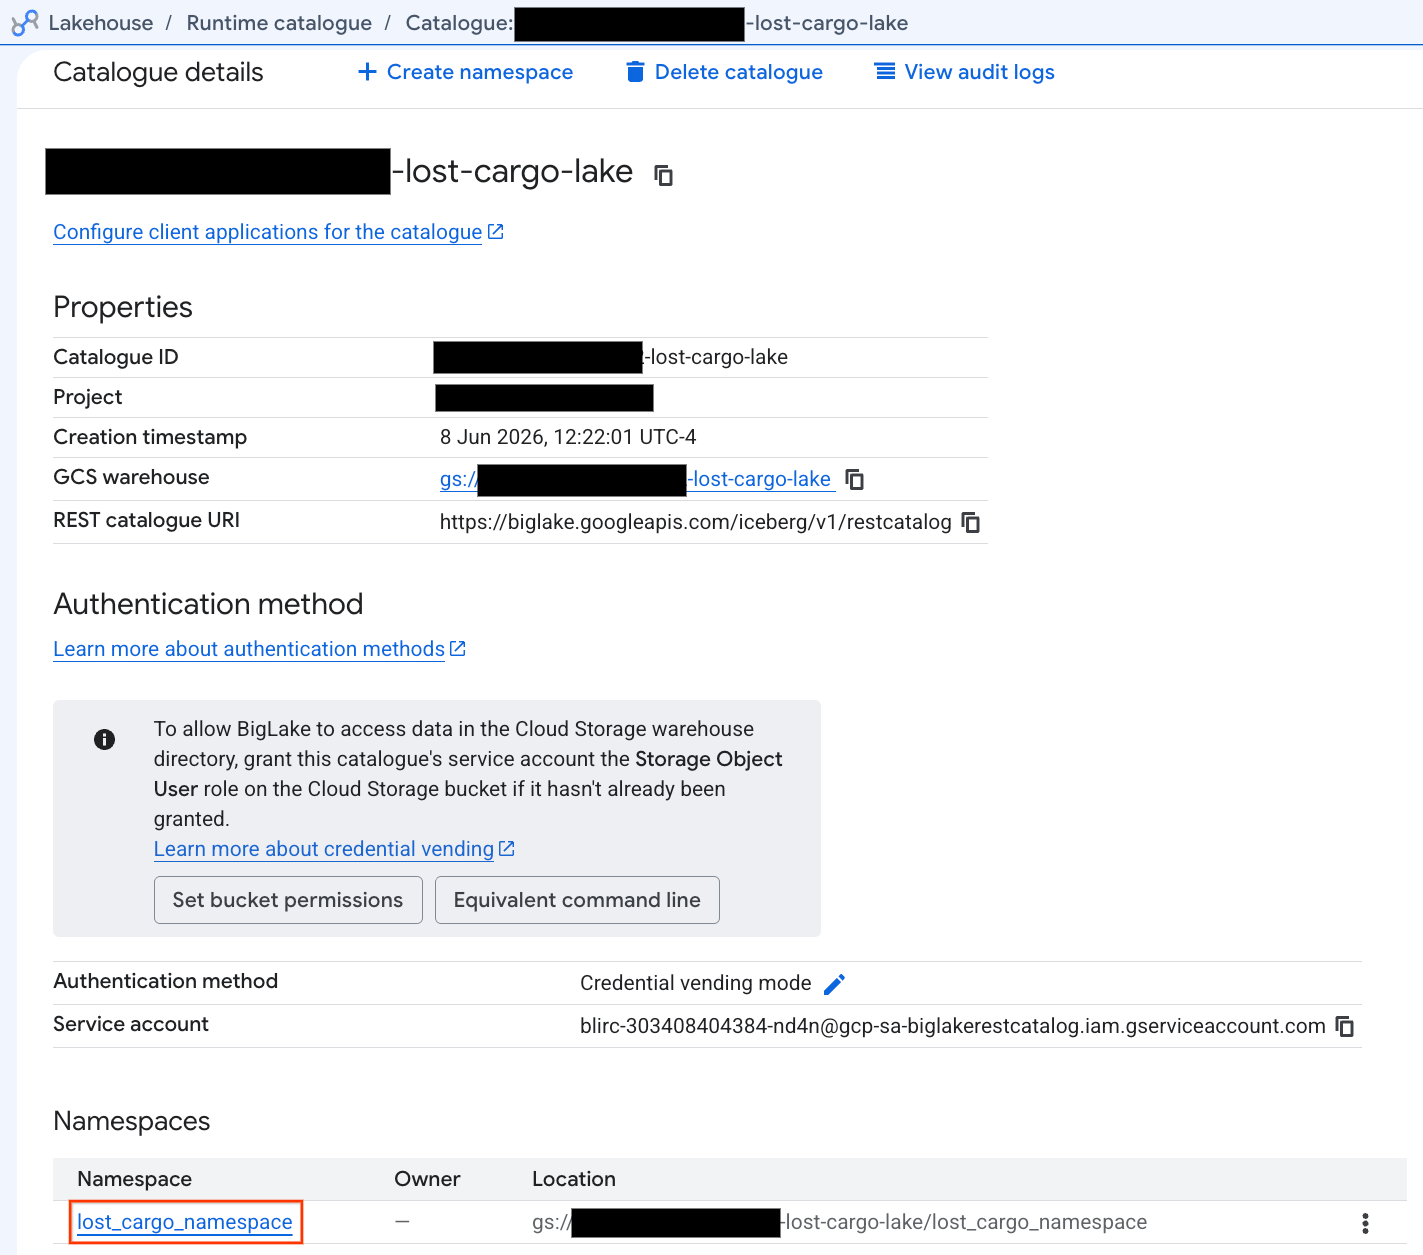
- Your new Apache Iceberg table, generated by PySpark, automatically registered under this metastore namespace and became instantly queryable across BigQuery!
6. Generate Insights on the Shipping Manifests Table
Let's go back and analyze the shipping_manifests table to understand its structure and content using Knowledge Catalog Data Insights. By enriching the metadata, other explorers can better understand the table for future analysis.
Generate Table Insights in BigQuery Studio
- In the Google Cloud Console, navigate to BigQuery Studio.
- In the Explorer panel, expand your project, expand the
lost_cargo_datasetdataset, and click theshipping_manifeststable. - In the details panel on the right, click the Insights tab.
- Use the dropdown to select Generate and publish.
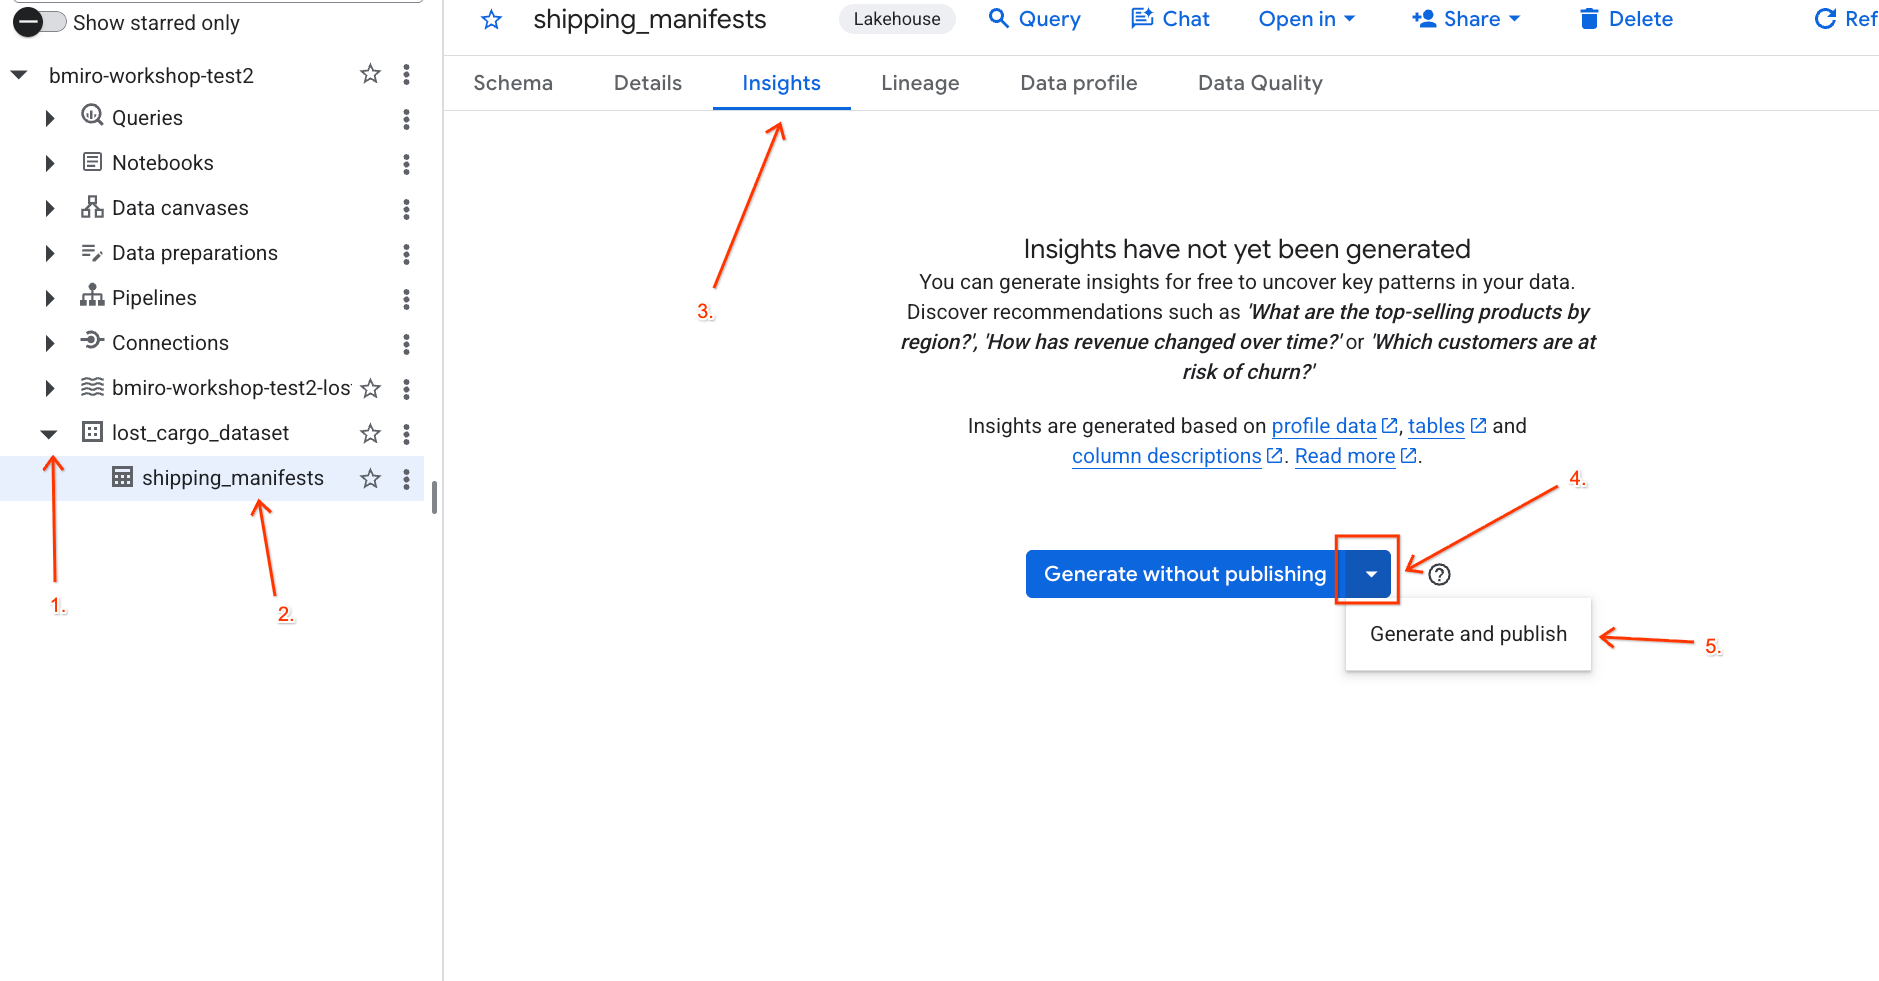
- Wait about 3 minutes for the insights generation to complete. Gemini will analyze the table metadata and generate natural language questions and corresponding SQL queries.
- Once complete, you'll see a Table description with a natural language explanation of the table.
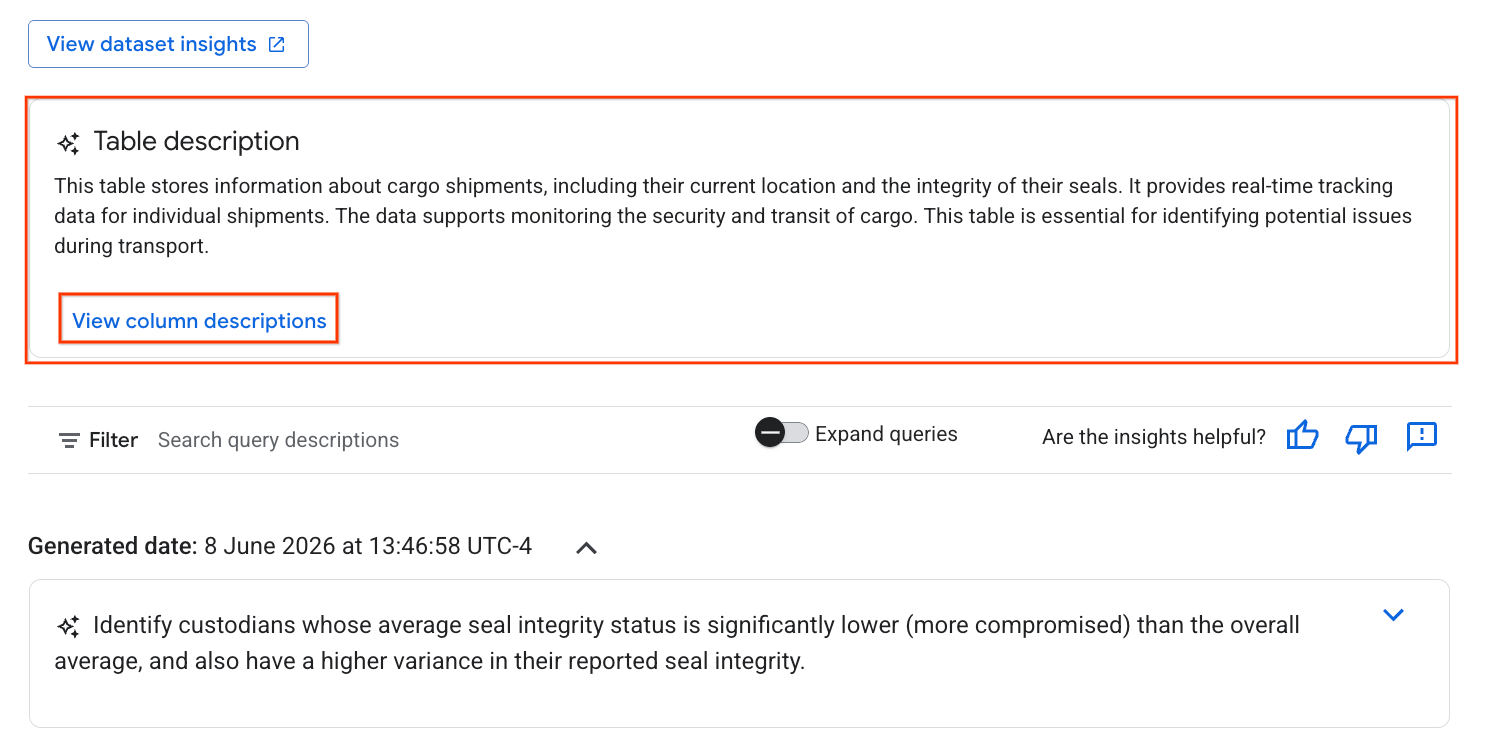
- Click View column descriptions to see information about the individual columns.
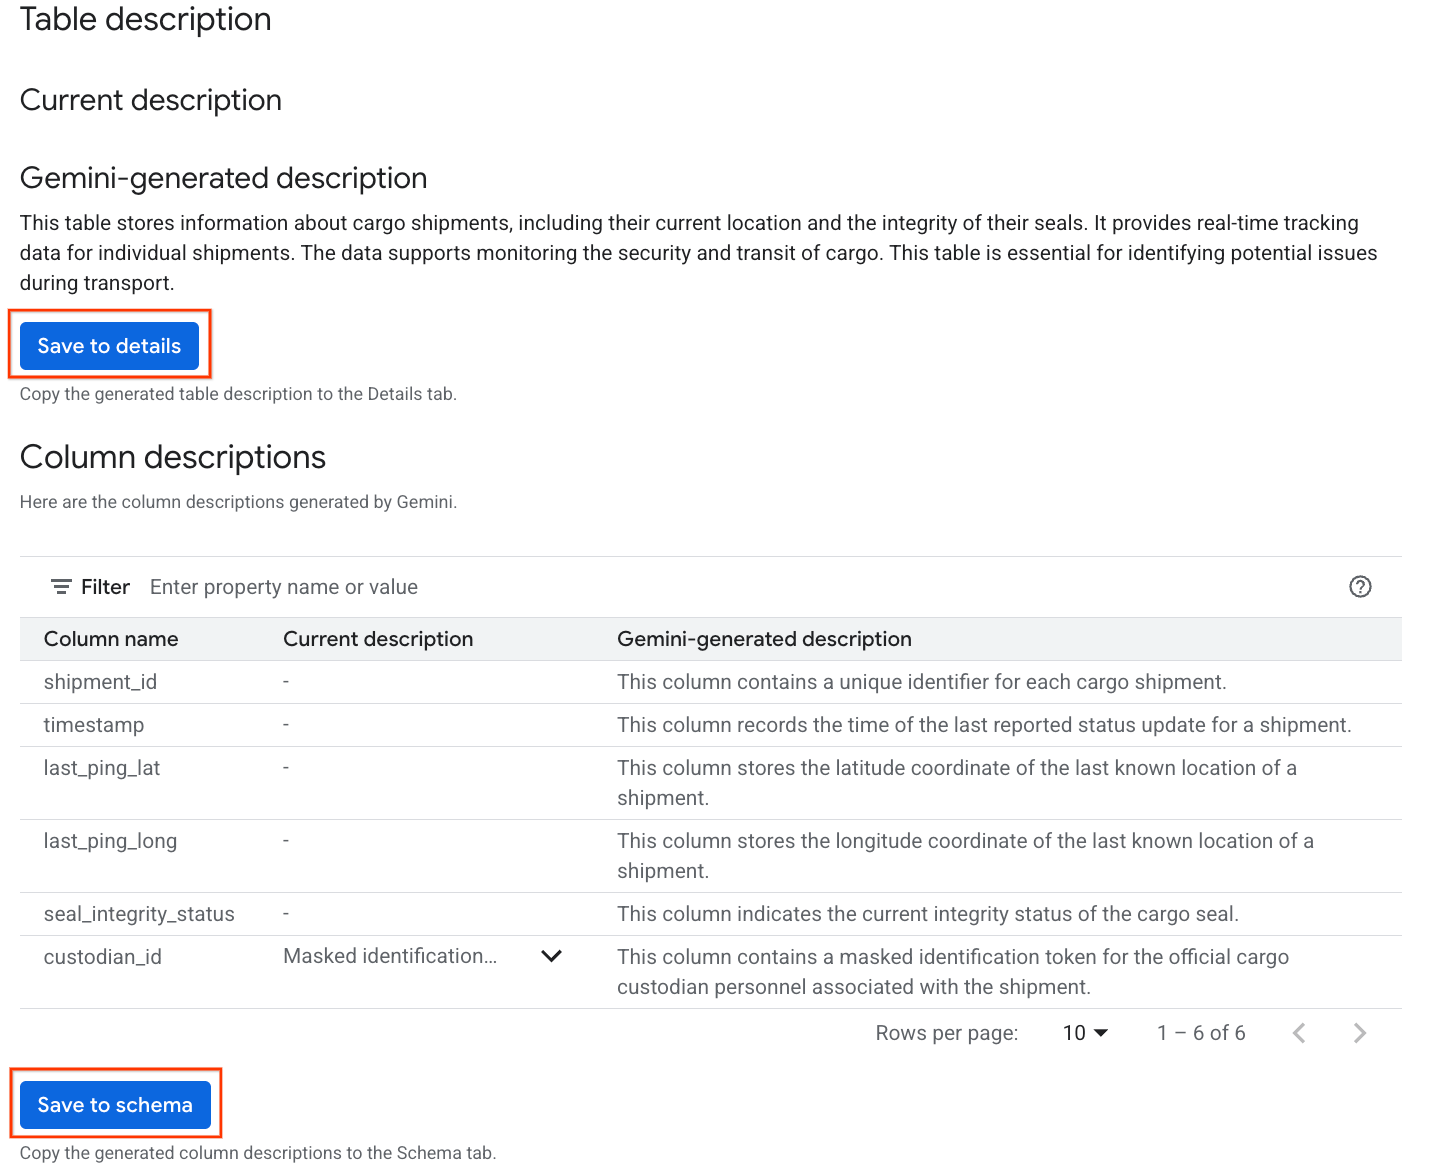
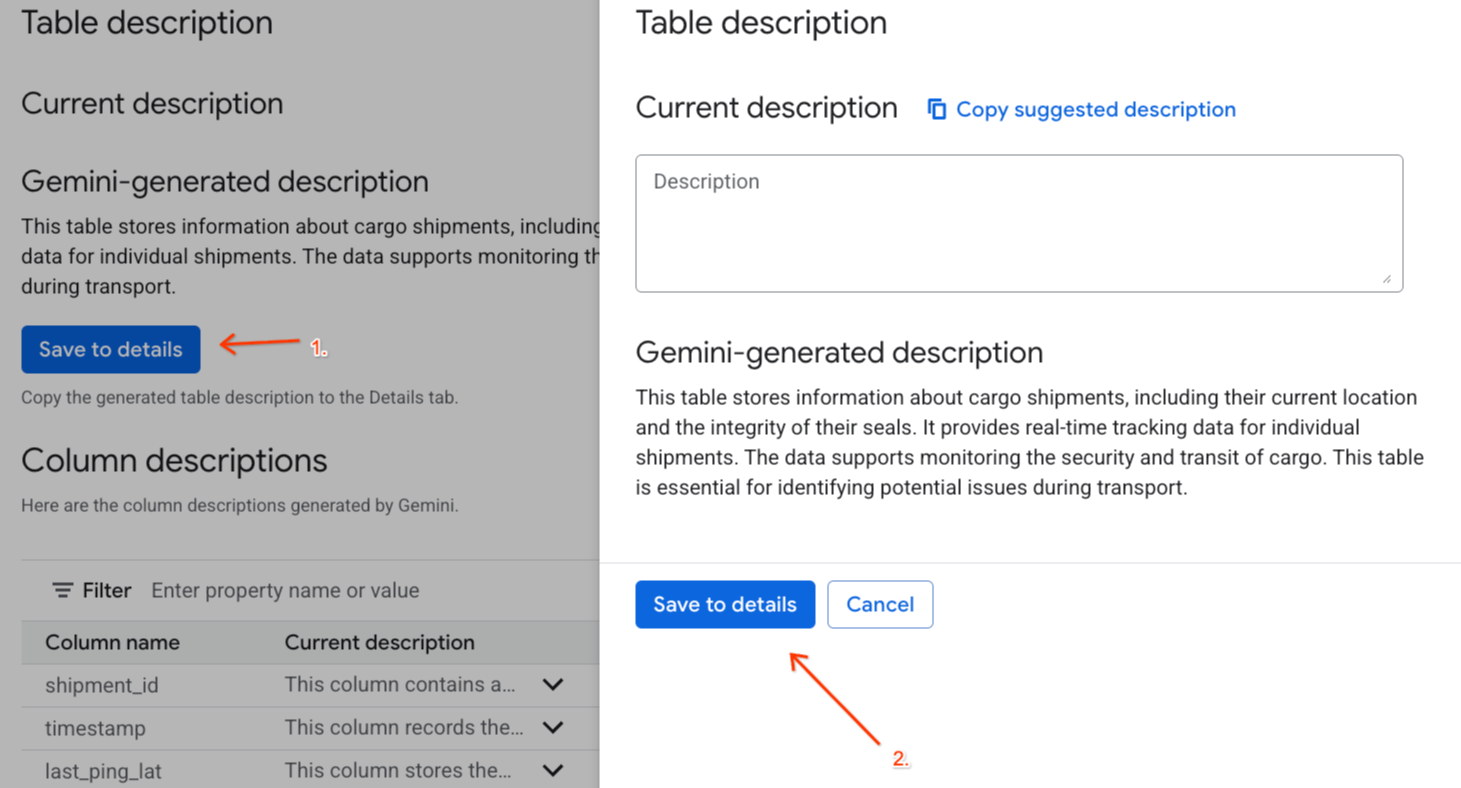
- Click Save to details under
Gemini generated descriptionand click Save to details in the window that pops up.
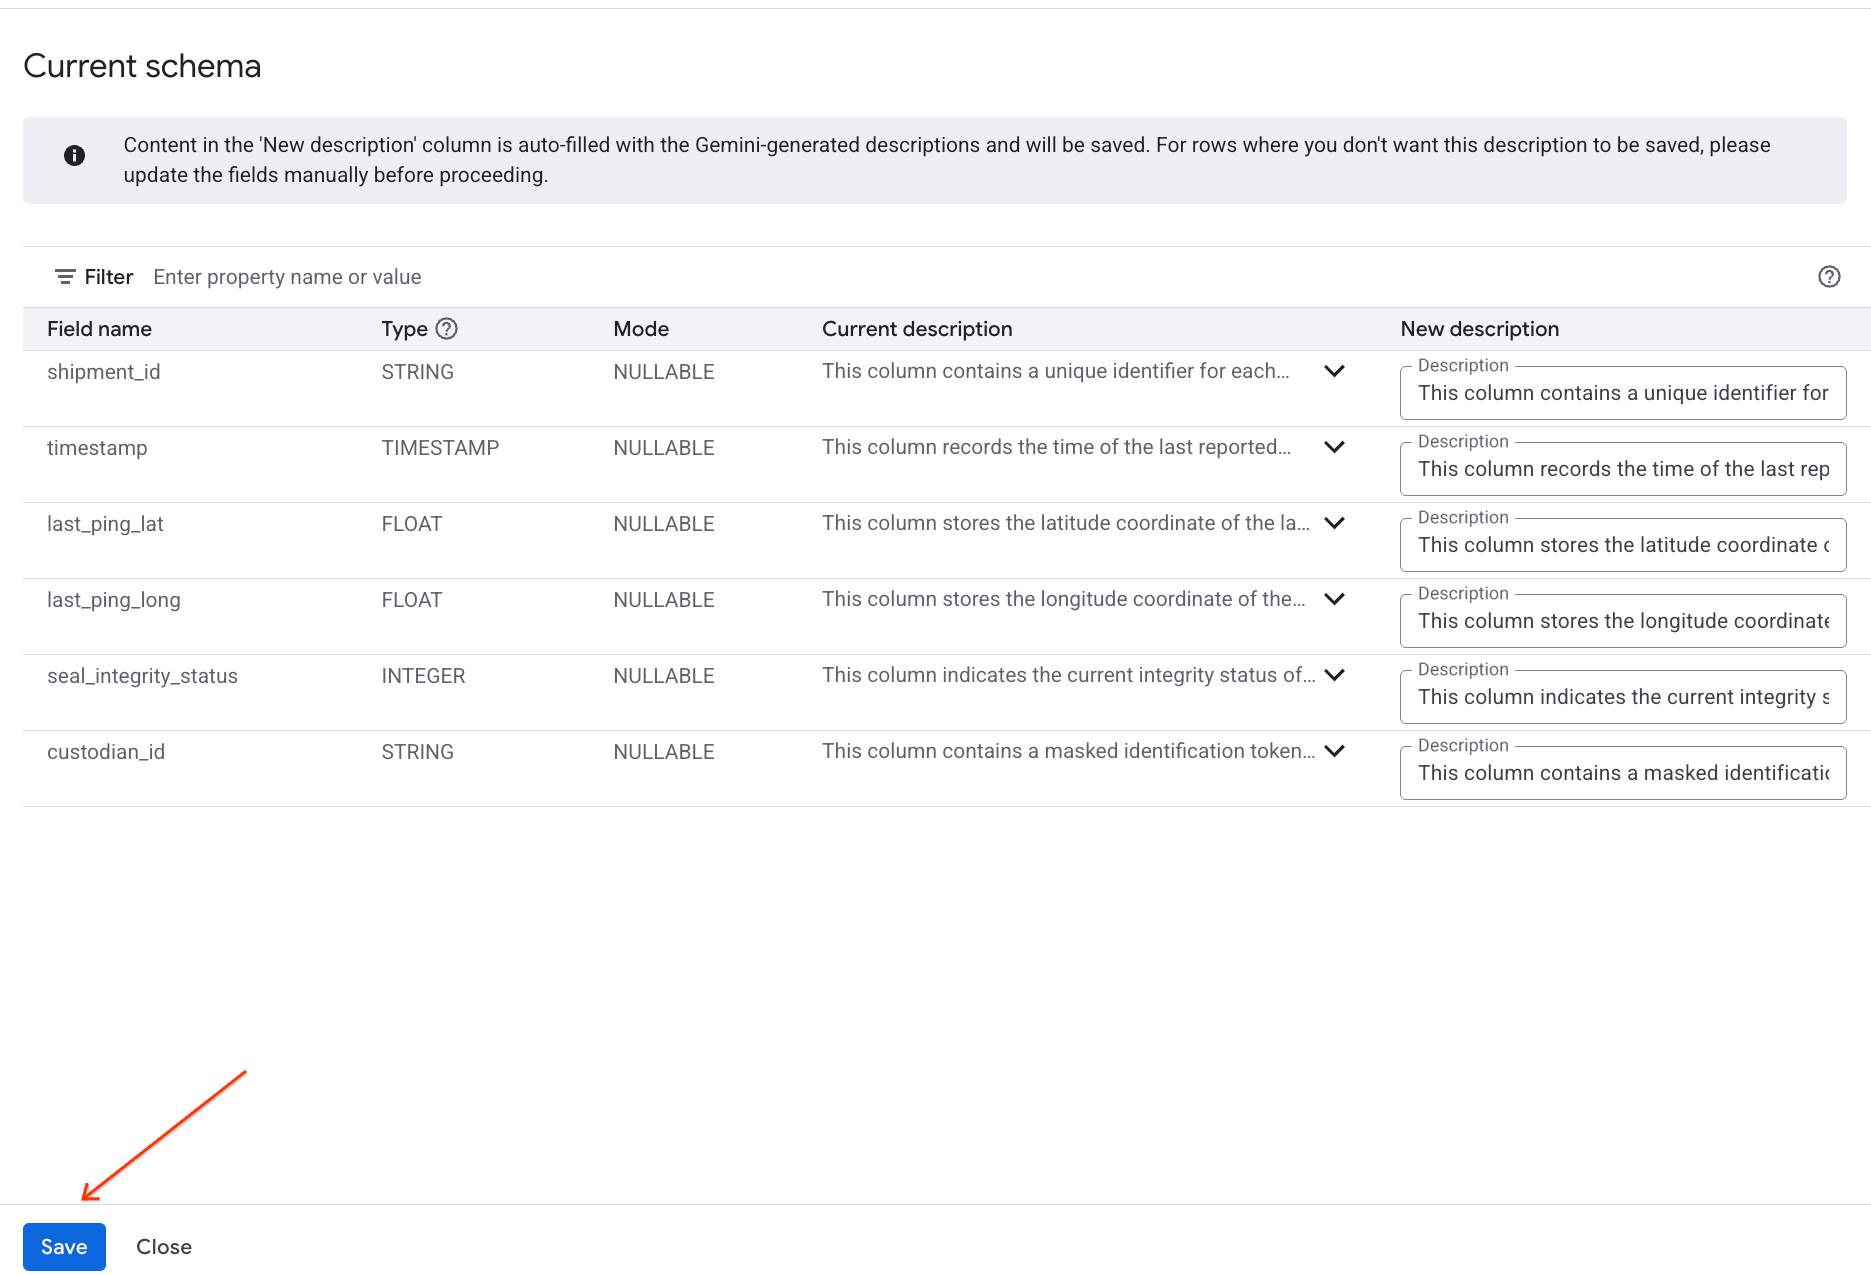
- Similarly, click Save to schema to add the column descriptions to the table metadata.
Review Generated Insights
You will also see a list of suggested questions. You can click on any question to see the generated SQL query and run it to explore the data. For example, you might see questions like:
- "What is the total number of shipments?"
- "List the unique custodian IDs."
Running these queries helps you understand the data.
7. Implement Data Masking and Governance
To guarantee that active research accounts and usernames cannot be leaked during this ongoing cargo investigation, you must enforce standard security protocols. You will create a Security Policy Tag Taxonomy and configure Knowledge Catalog Data Masking over the sensitive custodian_id column to verify data privacy.
By default, BigQuery denies access to columns protected by policy tags. To query the table and verify active data masks, your user account must hold the BigQuery Data Policy Masked Reader role.
This role was automatically bound to your active user account during your initial execution of setup_lab1.sh!
Create the Taxonomy and Policy Tag
Create a data taxonomy and associated policy tag for managing access to your data.
- Go to the Policy tag taxonomies page.
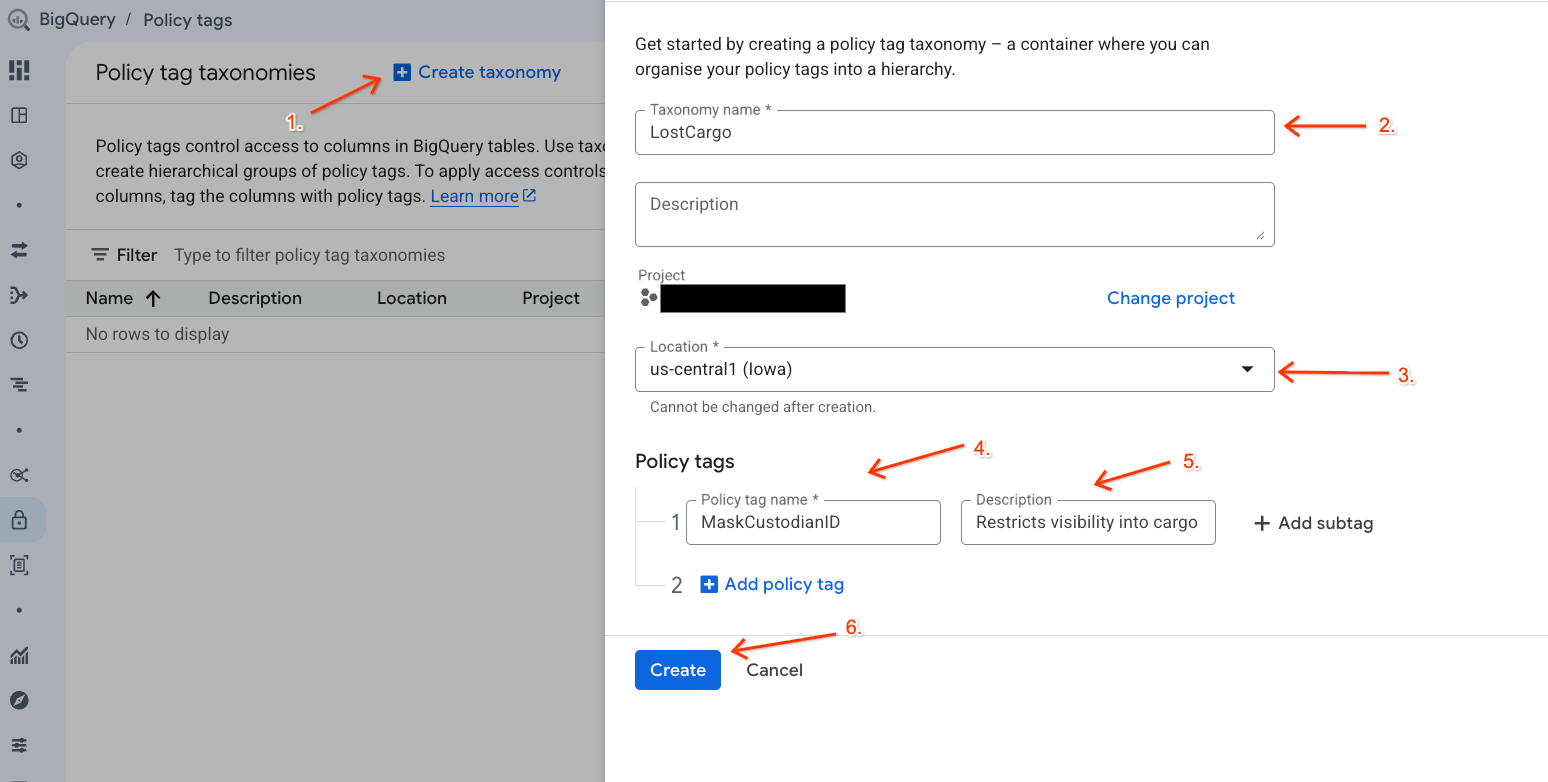
- Click + Create Taxonomy.
- Configure the parameters:
- Taxonomy name: Enter
lost-cargo-, replacing with your project ID. - Region: Select your region.
- For Policy tag Name: Enter
MaskCustodianID - For Policy tag Description:
Restricts visibility into cargo custodian usernames
- Taxonomy name: Enter
- Click Create to register your new taxonomy and policy tag.
Create the Data Masking Policy
Next, configure a data policy to define how the data gets masked under the MaskCustodianID classification tag. You will use the Always Null masking rule (replacing matching values with empty/Null returns for all non-privileged actors).
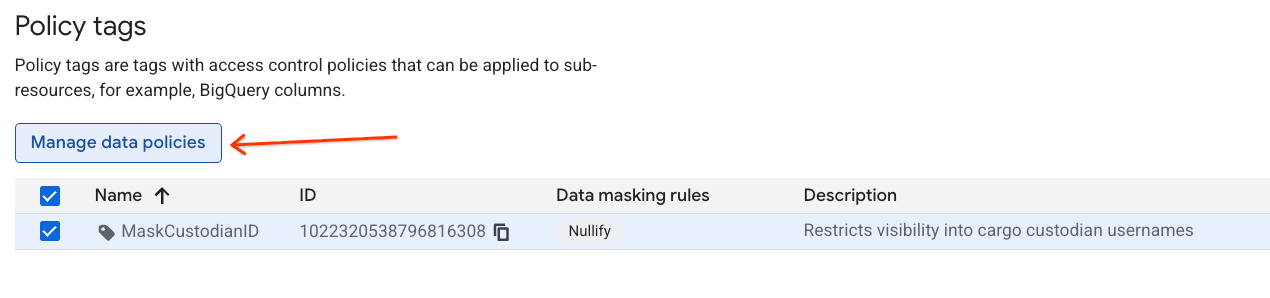
- On the Policy tag taxonomies page, click the newly created taxonomy from your list of taxonomies.
- In the hierarchy list, click on the
MaskCustodianIDtag to select it and then select Manage data policies.
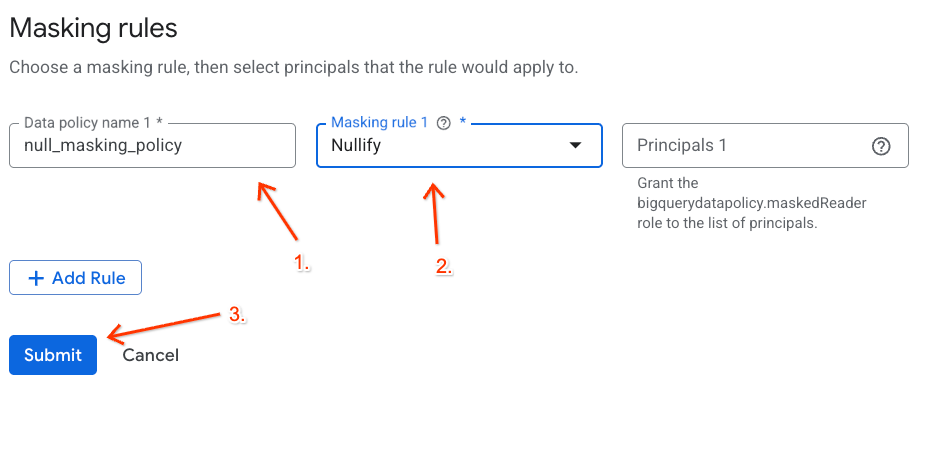
- On the right-hand panel, click the + Add Rule button.
- Configure the policy details in the panel that appears:
- Data policy name: Enter
null_masking_policy(do not leave it auto-generated, as we will reference it by name in the next steps). - Masking rule: Select
Nullifyfrom the dropdown menu.
- Data policy name: Enter
- Click Submit.
Assign the Policy Tag to your BigQuery Column
With the policy tag and its data masking rule active, map the classification tag directly to the custodian_id column in your BigQuery partner shipping manifest table.
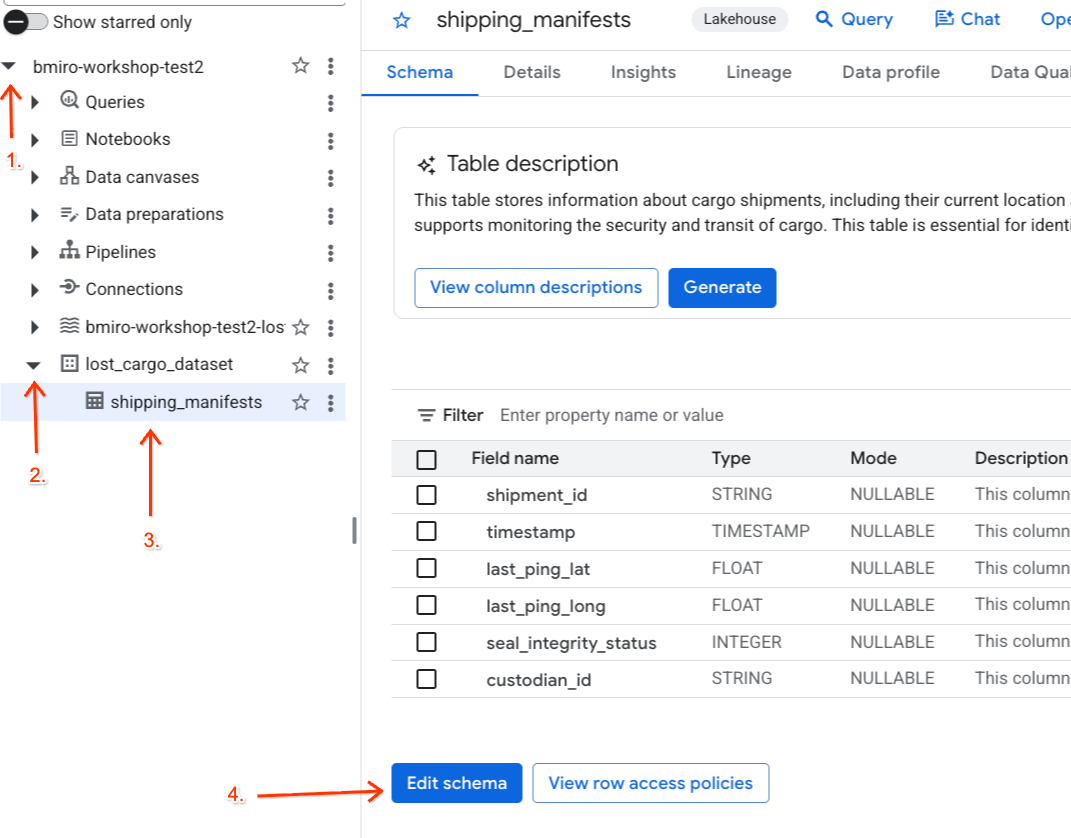
- Navigate to the BigQuery console.
- In the Explorer panel on the left, expand your active project, expand the
lost_cargo_datasetdataset, and click on theshipping_manifeststable to open its detailed view. - Click Edit Schema.
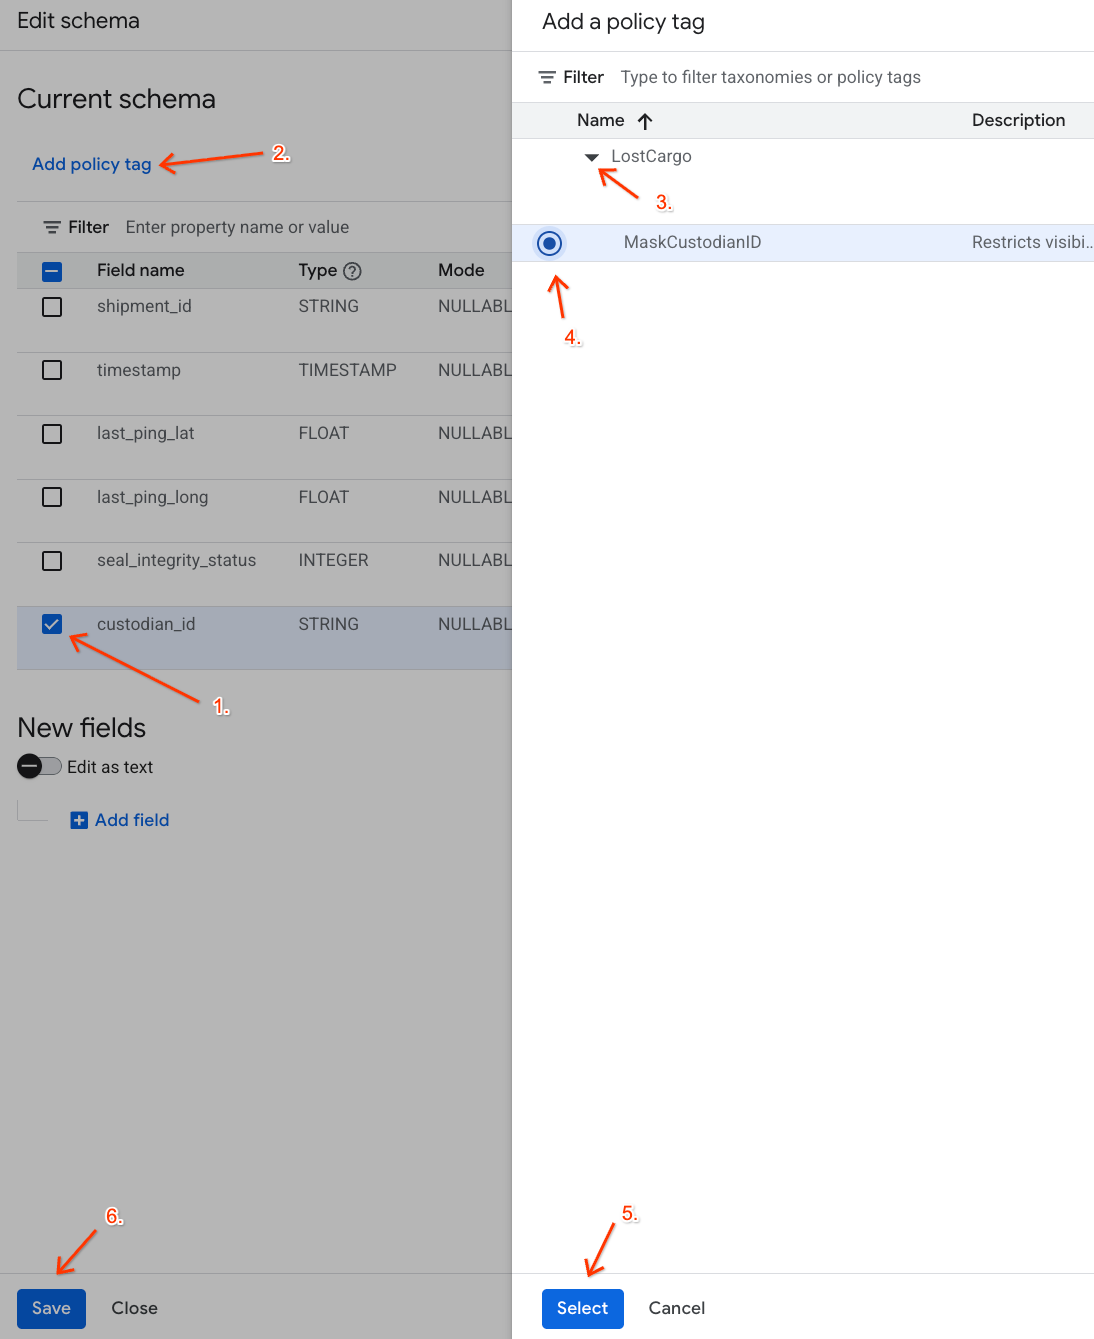
- In the list of columns, check the box next to
custodian_id. - Click the Add policy tag button on the top toolbar of the schema editor.
- In the Add a policy tag panel:
- Locate and expand your
LostCargotaxonomy. - Select the bubble next to
MaskCustodianID. - Click Select.
- Locate and expand your
- Verify that the
MaskCustodianIDtag is now visible under the Policy tag column in the row representingcustodian_id. - Click Save.
Verify the Policy Restrictions
Now that you have the Masked Reader role at the project level, you can query the table to verify that the masking policy is active.
Go back to the Data Agent Kit and run the following query:
SELECT shipment_id, custodian_id
FROM lost_cargo_dataset.shipping_manifests
LIMIT 5;
You should see output similar to the following:
shipment_id | custodian_id |
NORMAL-001 | null |
NORMAL-002 | null |
MV-CAT-001 | null |
Success! Even though you can view the shipment_id records, the sensitive custodian_id field returns secure null masks to prevent leaks!
8. Clean up
To avoid ongoing charges to your Google Cloud account for the resources created during this codelab, run these commands in your Cloud Shell terminal to drop your datasets and buckets:
# Verify active variables
export PROJECT_ID=$(gcloud config get-value project)
export BUCKET_NAME="${PROJECT_ID}-lost-cargo-lake"

# Delete Knowledge Catalog security taxonomies
export TAXONOMY_NAME=$(gcloud data-catalog taxonomies list --location=us-central1 --filter="displayName:LostCargo" --format="value(name)")
if [[ -n "$TAXONOMY_NAME" ]]; then
  curl -X DELETE \
    -H "Authorization: Bearer $(gcloud auth print-access-token)" \
    "https://datacatalog.googleapis.com/v1/${TAXONOMY_NAME}" || true
fi

# Delete Lakehouse Iceberg REST Catalog tables and namespaces
gcloud biglake iceberg tables delete processed_maritime_logs \
    --catalog=${BUCKET_NAME} \
    --namespace=lost_cargo_namespace \
    --quiet || true

gcloud biglake iceberg namespaces delete lost_cargo_namespace \
    --catalog=${BUCKET_NAME} \
    --quiet || true

# Delete Lakehouse Iceberg REST Catalog
gcloud biglake iceberg catalogs delete ${BUCKET_NAME} --quiet || true

# Delete dependencies bucket
gcloud storage rm -r gs://${BUCKET_NAME} || true

# Delete BigQuery dataset and tables
bq rm -r -f -d ${PROJECT_ID}:lost_cargo_dataset || true
9. Congratulations
Congratulations! You have successfully completed the first crucial module of the Lost Cargo investigation. You have established a governed search zone using Lakehouse Iceberg REST Catalogs, PySpark log normalization, and fine-grained data masking.
What you've learned
- Installing, setting up, and configuring the Data Agent Kit extension inside your IDE workspace.
- Establishing a serverless Lakehouse Iceberg REST catalog utilizing vended credentials and hierarchical namespaces.
- Ingesting multi-format regional feeds and building BigQuery external tables over Cloud Storage buckets.
- Launching serverless Apache Spark jobs to parse, normalise, segment, and write unstructured transponder logs back into BigQuery as registered Iceberg catalog tables.
- Building security taxnomies and mapping Knowledge Catalog data masking policies to prevent identity leaks on sensitive log indices.
- Generating and analyzing table metadata insights using BigQuery data insights to accelerate data exploration.
Collected Clues Verification
Verify you have recorded the following definitive clues required to launch into the next lab phase:
- Lost Shipment ID:
MV-CAT-001(last ping location: London) - Planned Target Destination:
New York(and transponder true alias:MV-DOG-002) - Container Color:
Crimson RED - Governance Access Tag:
MaskCustodianID
Ready for the next phase?
Now that the transponder Depart / Destination routes are secure, the investigation moves forward! Launch straight into Lab 2 to examine security cameras using multimodal Gemini models, identify the vessel visually, and perform vector searches in AlloyDB to verify tampering anomalies!
➡️ Continue with Step Two: Data Analysis & Multimodal Insights