
1. Introduction and Overview
DNS Armor, powered by Infoblox, is a fully-managed service that provides DNS-layer security for your Google Cloud workloads. Its advanced threat detector is designed to detect malicious activity at the earliest point in the attack chain—the DNS query—without adding operational complexity or performance overhead.
This codelab provides step-by-step instructions to configure and test the DNS Armor service. You will set up the necessary network infrastructure, create the threat detector, test the service by simulating DNS threats, and finally, visualize and analyze the threat logs using a custom Cloud Monitoring dashboard.
What You'll build
In this codelab, you will provision the following resources:
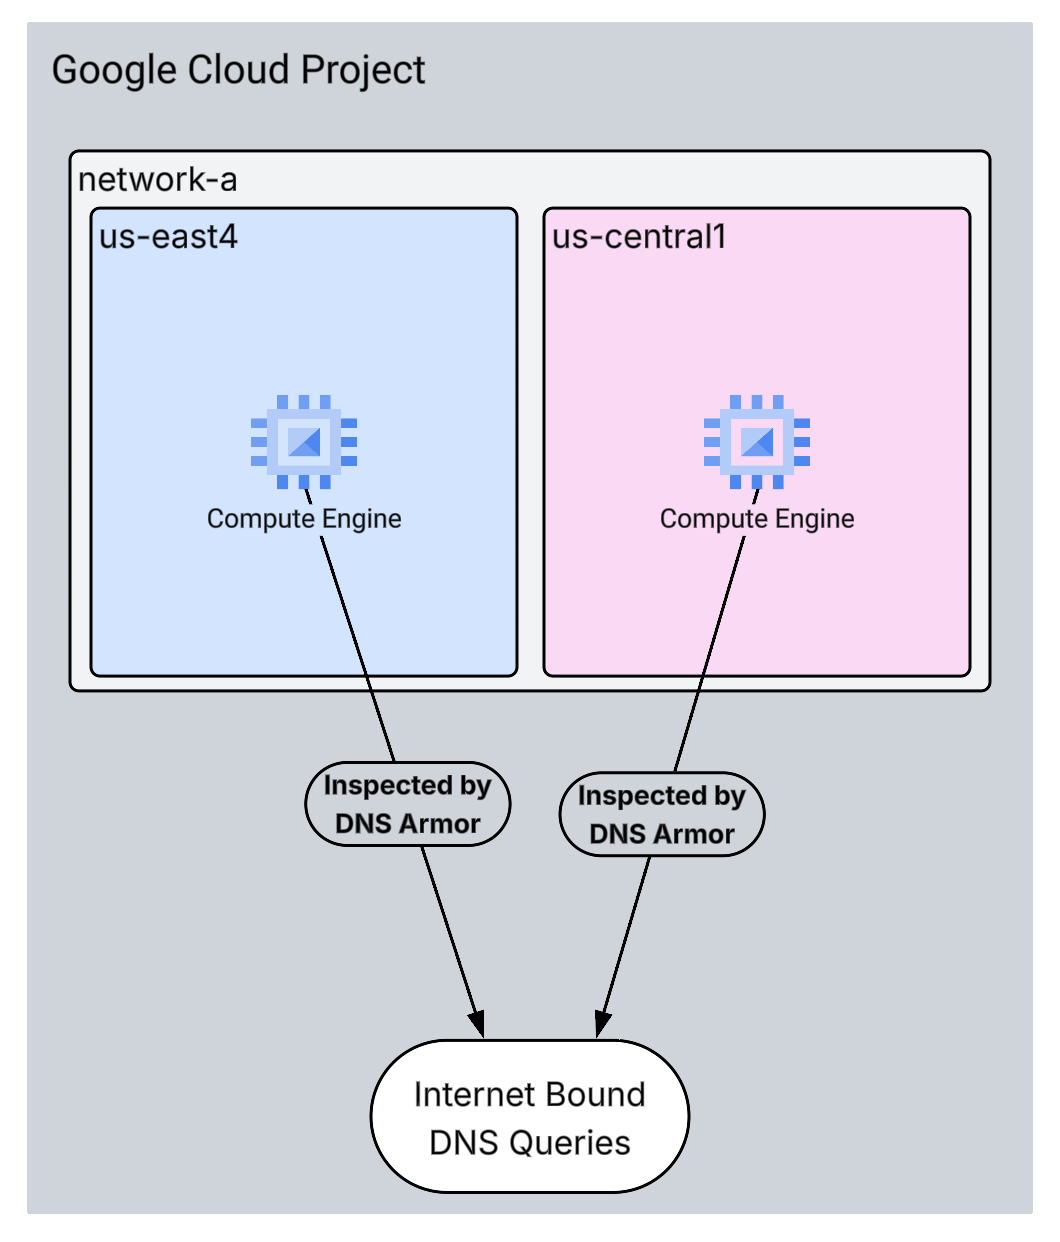
- One VPC network (
network-a) with subnets and virtual machines provisioned in theus-east4andus-central1regions. - A DNS Armor advanced threat detector configured to inspect DNS queries.
- Log based metrics based on the DNS threat logs.
- A custom dashboard to visualize the DNS threat logs.
What you'll learn
- How to provision the necessary networking resources, including VPCs and virtual machines.
- How to deploy an advanced threat detector and exclude specific networks.
- How to validate the threat detection configuration using a threat simulation script.
- How to visualize the DNS threat logs using log based metrics and custom dashboard.
What you'll need
- A Google Cloud project.
- Access to the
gcloudcommand-line tool.
2. Prerequisites
In this section, you will perform the following tasks:
- Verify that your Google Cloud project meets the necessary Organization Policy constraints.
- Confirm that your user account has the required IAM roles and permissions.
- Enable the Google Cloud APIs essential for this codelab.
- Assign the
roles/logging.viewerIAM role to the Compute Engine Service Account.
Organization Policy Constraints
To successfully complete this codelab, please verify the Organization Policy constraints applied to your project. Certain policies might hinder the provisioning of necessary resources. The following constraints could impact the configuration of this codelab:
constraints/gcp.resourceLocations: Restricts the regions where you can create resources; the codelab requiresus-east4andus-central1.constraints/compute.vmExternalIpAccess: Prevents the creation of virtual machines with public IP addresses, which could interfere with the setup if you don't follow the codelab's use of the--no-addressflag .constraints/compute.shieldedVm: Enforces the creation of Shielded VMs, which the codelab's VM creation commands do not specify, potentially causing an error.constraints/gcp.restrictServiceUsage: Limits which Google Cloud APIs can be enabled, and could block the codelab if it doesn't allowcompute.googleapis.com,networksecurity.googleapis.com,logging.googleapis.com, andmonitoring.googleapis.com.
IAM Roles and Permissions
To successfully complete this codelab, please verify the IAM roles and permissions granted to your user. The following IAM roles and permissions are required to complete this Codelab.
- Service Usage Admin (
roles/serviceusage.serviceUsageAdmin): To enable the required Google Cloud APIs for the codelab. - Compute Network Admin (
roles/compute.networkAdmin): To create and manage VPC networks, subnets, and Cloud NAT. - Compute Security Admin (
roles/compute.securityAdmin): To configure the firewall rules for SSH access to the virtual machines. - Compute Instance Admin (v1) (
roles/compute.instanceAdmin.v1): To create and manage the virtual machines required for the lab. - IAP-secured Tunnel User (
roles/iap.tunnelResourceAccessor): To connect to the virtual machines using SSH through Identity-Aware Proxy (IAP). - Network Security Admin (
roles/networksecurity.admin): To create and manage the DNS Armor threat detector. - Logs Viewer (
roles/logging.viewer): To view and analyze the threat logs in Logs Explorer.
Google Cloud APIs
Please make sure that the required Google Cloud APIs are enabled in your project.
1. Enable the necessary APIs, run the following gcloud commands within Cloud Shell.
gcloud services enable compute.googleapis.com \
networksecurity.googleapis.com \
logging.googleapis.com \
monitoring.googleapis.com
2. Verify the APIs are Enabled, run the following gcloud commands within Cloud Shell.
gcloud services list --enabled
Compute Engine Service Account
The threat simulation script requires permissions to read and report on the generated threat logs from Cloud Logging. Since the script will be executed from a VM utilizing the default Compute Engine Service Account, the roles/logging.viewer IAM role must be assigned to this service account.
1. Set the environment variables, run following commands within Cloud Shell.
export PROJECT_ID=$(gcloud config get-value project)
export PROJECT_NUMBER=$(gcloud projects describe $PROJECT_ID --format='value(projectNumber)')
2. Grant the logging viewer role to the Compute Engine SA. Run the following gcloud commands within Cloud Shell
gcloud projects add-iam-policy-binding $PROJECT_ID \
--member="serviceAccount:${PROJECT_NUMBER}-compute@developer.gserviceaccount.com" \
--role="roles/logging.viewer"
3. Provisioning Network and Compute Resources
In this section, you will perform the following tasks:
- Create VPC network
network-awith custom subnets. - Configure Cloud Routers and Cloud NAT for internet egress in
network-a. - Create firewall rules to allow SSH access to VMs from IAP's IP range for
network-a. - Provision Linux virtual machines in
network-awithout public IP addresses.
Create VPCs and Subnets
1. Create network-a and its subnets in the us-east4 and us-central1 regions. Run the following gcloud commands within Cloud Shell.
gcloud compute networks create network-a --subnet-mode=custom
gcloud compute networks subnets create subnet-a-use4 \
--network=network-a \
--range=10.10.0.0/24 \
--region=us-east4
gcloud compute networks subnets create subnet-a-usc1 \
--network=network-a \
--range=10.10.1.0/24 \
--region=us-central1
Configure Internet Egress
1. Create Cloud Router and Cloud NAT for network-a to allow internet egress for VMs without public IPs.
gcloud compute routers create router-a-use4 \
--network=network-a \
--region=us-east4
gcloud compute routers nats create nat-a-use4 \
--router=router-a-use4 \
--auto-allocate-nat-external-ips \
--nat-all-subnet-ip-ranges \
--region=us-east4
gcloud compute routers create router-a-usc1 \
--network=network-a \
--region=us-central1
gcloud compute routers nats create nat-a-usc1 \
--router=router-a-usc1 \
--auto-allocate-nat-external-ips \
--nat-all-subnet-ip-ranges \
--region=us-central1
Configure Firewall Rules
1. Create firewall rules for network-a to allow SSH access from IAP's IP range. Run the following gcloud commands within Cloud Shell.
gcloud compute firewall-rules create allow-ssh-iap-a \
--network=network-a \
--allow=tcp:22 \
--source-ranges=35.235.240.0/20
Create Virtual Machines
1. Create Linux VMs in network-a.
gcloud compute instances create vm-a-use4 \
--zone=us-east4-c \
--network=network-a \
--subnet=subnet-a-use4 \
--no-address \
--scopes=cloud-platform
gcloud compute instances create vm-a-usc1 \
--zone=us-central1-a \
--network=network-a \
--subnet=subnet-a-usc1 \
--no-address \
--scopes=cloud-platform
4. Create the DNS Threat Detector
In this section, you will perform the following tasks:
- Create the threat detector.
- List the threat detector.
With the VPCs, subnets, and virtual machines now provisioned, the next step is to create the DNS threat detector.
1. Create the threat detector using the gcloud beta network-security dns-threat-detectors create command.
gcloud beta network-security dns-threat-detectors create my-dns-threat-detector \
--location=global \
--provider=infoblox
2. List the threat detector to confirm creation.
gcloud beta network-security dns-threat-detectors list --location=global
5. Create the log-based metrics
In this section, you will perform the following tasks:
- Understanding the Log Entry.
- Create the
config.yamlfile. - Create the log-based metric.
1. Understanding the Log Entry. You can review a table of all the fields in the DNS Armor logs in the threat logs documentation. This section focuses on the specific fields that will be used to create the log-based metrics.
The following fields will be used to create the log-based metrics:
- vmInstanceId: Compute Engine VM instance name, only applicable to queries initiated by Compute Engine VMs.
- queryName: DNS query name.
- severity: The severity (High, Medium, Low, or Info) associated with the threat detected. For more information, see Infoblox's Severity Level Definition.
- location: Google Cloud region from which the response was served.
- threat: The name of the threat detected.
- threatId: Unique threat identifier.
2. Create the config.yaml file. First, create an empty config.yaml file using the touch command.
touch config.yaml
3. Populate the config.yaml file. This file defines how to create a log-based metric for DNS Armor threat logs. It specifies which log entries to filter, what labels to extract from those entries, and the properties of the metric itself.
Open the config.yaml file in a text editor of your choice and paste the following content.
filter: |
  resource.type="networksecurity.googleapis.com/DnsThreatDetector"
  jsonPayload.dnsQuery.projectNumber="PROJECT_NUMBER"
labelExtractors:
  InstanceId: EXTRACT(jsonPayload.dnsQuery.vmInstanceId)
  QueryName: EXTRACT(jsonPayload.dnsQuery.queryName)
  Severity: EXTRACT(jsonPayload.threatInfo.severity)
  region: EXTRACT(jsonPayload.dnsQuery.location)
  threat: EXTRACT(jsonPayload.threatInfo.threat)
  threatId: EXTRACT(jsonPayload.threatInfo.threatId)
metricDescriptor:
  labels:
  - key: InstanceId
  - key: threat
  - key: Severity
  - key: threatId
  - key: region
  - key: QueryName
  metricKind: DELTA
  unit: '1'
  valueType: INT64
4. Update the Project Number. Use the following sed command to replace the PROJECT_NUMBER placeholder with the value from your environment variable.
sed -i "s/PROJECT_NUMBER/$PROJECT_NUMBER/g" config.yaml
5. Create the log-based metric. Finally, run the following gcloud command within Cloud Shell to create the metric.
gcloud logging metrics create dns-armor-log-based-metric --config-from-file=config.yaml
6. Create the Custom Dashboard
In this section, you will perform the following tasks:
- Create the
dashboard.jsonfile. - Create the custom dashboard
1. Create the dashboard.json file. First, create an empty dashboard.json file using the touch command.
touch dashboard.json
2. Populate the dashboard.json file. The dashboard.json file configures custom monitoring dashboard, defining widgets, display properties, and how log-based metrics are visualized, aggregated, and filtered.
Open the dashboard.json file in a text editor of your choice and paste the following content.
{
  "displayName": "DNS Armor - Custom Dashboard",
  "dashboardFilters": [],
  "description": "",
  "labels": {},
  "mosaicLayout": {
    "columns": 48,
    "tiles": [
      {
        "height": 20,
        "width": 24,
        "widget": {
          "title": "Threat Logs",
          "id": "",
          "xyChart": {
            "chartOptions": {
              "displayHorizontal": false,
              "mode": "COLOR",
              "showLegend": false
            },
            "dataSets": [
              {
                "breakdowns": [],
                "dimensions": [],
                "legendTemplate": "",
                "measures": [],
                "minAlignmentPeriod": "60s",
                "plotType": "STACKED_BAR",
                "targetAxis": "Y1",
                "timeSeriesQuery": {
                  "outputFullDuration": false,
                  "timeSeriesFilter": {
                    "aggregation": {
                      "alignmentPeriod": "60s",
                      "crossSeriesReducer": "REDUCE_SUM",
                      "groupByFields": [],
                      "perSeriesAligner": "ALIGN_SUM"
                    },
                    "filter": "metric.type=\"logging.googleapis.com/user/dns-armor-log-based-metric\" resource.type=\"networksecurity.googleapis.com/DnsThreatDetector\""
                  },
                  "unitOverride": ""
                }
              }
            ],
            "thresholds": [],
            "yAxis": {
              "label": "",
              "scale": "LINEAR"
            }
          }
        }
      },
      {
        "xPos": 24,
        "height": 20,
        "width": 24,
        "widget": {
          "title": "Threat Logs per region",
          "id": "",
          "xyChart": {
            "chartOptions": {
              "displayHorizontal": false,
              "mode": "COLOR",
              "showLegend": false
            },
            "dataSets": [
              {
                "breakdowns": [],
                "dimensions": [],
                "legendTemplate": "",
                "measures": [],
                "minAlignmentPeriod": "60s",
                "plotType": "STACKED_BAR",
                "targetAxis": "Y1",
                "timeSeriesQuery": {
                  "outputFullDuration": false,
                  "timeSeriesFilter": {
                    "aggregation": {
                      "alignmentPeriod": "60s",
                      "crossSeriesReducer": "REDUCE_SUM",
                      "groupByFields": [
                        "metric.label.\"region\""
                      ],
                      "perSeriesAligner": "ALIGN_SUM"
                    },
                    "filter": "metric.type=\"logging.googleapis.com/user/dns-armor-log-based-metric\" resource.type=\"networksecurity.googleapis.com/DnsThreatDetector\""
                  },
                  "unitOverride": ""
                }
              }
            ],
            "thresholds": [],
            "yAxis": {
              "label": "",
              "scale": "LINEAR"
            }
          }
        }
      },
      {
        "yPos": 20,
        "height": 20,
        "width": 24,
        "widget": {
          "title": "Group by Threat",
          "id": "",
          "pieChart": {
            "chartType": "DONUT",
            "dataSets": [
              {
                "breakdowns": [],
                "dimensions": [],
                "measures": [],
                "minAlignmentPeriod": "60s",
                "sliceNameTemplate": "",
                "timeSeriesQuery": {
                  "outputFullDuration": true,
                  "timeSeriesFilter": {
                    "aggregation": {
                      "alignmentPeriod": "60s",
                      "crossSeriesReducer": "REDUCE_SUM",
                      "groupByFields": [
                        "metric.label.\"threat\""
                      ],
                      "perSeriesAligner": "ALIGN_SUM"
                    },
                    "filter": "metric.type=\"logging.googleapis.com/user/dns-armor-log-based-metric\" resource.type=\"networksecurity.googleapis.com/DnsThreatDetector\""
                  },
                  "unitOverride": ""
                }
              }
            ],
            "showLabels": false,
            "showTotal": false,
            "sliceAggregatedThreshold": 0
          }
        }
      },
      {
        "yPos": 20,
        "xPos": 24,
        "height": 20,
        "width": 24,
        "widget": {
          "title": "Top List - ThreatID",
          "timeSeriesTable": {
            "columnSettings": [
              {
                "column": "threatId",
                "visible": true
              },
              {
                "column": "threat",
                "visible": true
              },
              {
                "column": "project_id",
                "visible": false
              },
              {
                "column": "value",
                "visible": true
              }
            ],
            "dataSets": [
              {
                "minAlignmentPeriod": "60s",
                "timeSeriesQuery": {
                  "outputFullDuration": true,
                  "timeSeriesFilter": {
                    "aggregation": {
                      "alignmentPeriod": "60s",
                      "crossSeriesReducer": "REDUCE_SUM",
                      "groupByFields": [
                        "metric.label.\"threatId\"",
                        "metric.label.\"threat\""
                      ],
                      "perSeriesAligner": "ALIGN_SUM"
                    },
                    "filter": "metric.type=\"logging.googleapis.com/user/dns-armor-log-based-metric\" resource.type=\"networksecurity.googleapis.com/DnsThreatDetector\"",
                    "pickTimeSeriesFilter": {
                      "direction": "TOP",
                      "numTimeSeries": 30,
                      "rankingMethod": "METHOD_MEAN"
                    }
                  }
                }
              }
            ],
            "metricVisualization": "BAR"
          }
        }
      },
      {
        "yPos": 40,
        "height": 20,
        "width": 24,
        "widget": {
          "title": "Group by Severity",
          "id": "",
          "pieChart": {
            "chartType": "DONUT",
            "dataSets": [
              {
                "breakdowns": [],
                "dimensions": [],
                "measures": [],
                "minAlignmentPeriod": "60s",
                "sliceNameTemplate": "",
                "timeSeriesQuery": {
                  "outputFullDuration": true,
                  "timeSeriesFilter": {
                    "aggregation": {
                      "alignmentPeriod": "60s",
                      "crossSeriesReducer": "REDUCE_SUM",
                      "groupByFields": [
                        "metric.label.\"Severity\""
                      ],
                      "perSeriesAligner": "ALIGN_SUM"
                    },
                    "filter": "metric.type=\"logging.googleapis.com/user/dns-armor-log-based-metric\" resource.type=\"networksecurity.googleapis.com/DnsThreatDetector\""
                  },
                  "unitOverride": ""
                }
              }
            ],
            "showLabels": false,
            "showTotal": false,
            "sliceAggregatedThreshold": 0
          }
        }
      },
      {
        "yPos": 40,
        "xPos": 24,
        "height": 20,
        "width": 24,
        "widget": {
          "title": "Top List - Source",
          "id": "",
          "timeSeriesTable": {
            "columnSettings": [
              {
                "column": "InstanceId",
                "visible": true
              },
              {
                "column": "region",
                "visible": true
              },
              {
                "column": "project_id",
                "visible": true
              },
              {
                "column": "value",
                "visible": true
              }
            ],
            "dataSets": [
              {
                "minAlignmentPeriod": "60s",
                "tableTemplate": "",
                "timeSeriesQuery": {
                  "outputFullDuration": true,
                  "timeSeriesFilter": {
                    "aggregation": {
                      "alignmentPeriod": "60s",
                      "crossSeriesReducer": "REDUCE_SUM",
                      "groupByFields": [
                        "metric.label.\"InstanceId\"",
                        "metric.label.\"region\""
                      ],
                      "perSeriesAligner": "ALIGN_SUM"
                    },
                    "filter": "metric.type=\"logging.googleapis.com/user/dns-armor-log-based-metric\" resource.type=\"networksecurity.googleapis.com/DnsThreatDetector\"",
                    "pickTimeSeriesFilter": {
                      "direction": "TOP",
                      "numTimeSeries": 30,
                      "rankingMethod": "METHOD_MEAN"
                    }
                  },
                  "unitOverride": ""
                }
              }
            ],
            "displayColumnType": false,
            "metricVisualization": "BAR"
          }
        }
      },
      {
        "yPos": 60,
        "height": 20,
        "width": 48,
        "widget": {
          "title": "Group by Domains",
          "id": "",
          "xyChart": {
            "chartOptions": {
              "displayHorizontal": false,
              "mode": "COLOR",
              "showLegend": false
            },
            "dataSets": [
              {
                "breakdowns": [],
                "dimensions": [],
                "legendTemplate": "",
                "measures": [],
                "minAlignmentPeriod": "60s",
                "plotType": "STACKED_BAR",
                "targetAxis": "Y1",
                "timeSeriesQuery": {
                  "outputFullDuration": false,
                  "timeSeriesFilter": {
                    "aggregation": {
                      "alignmentPeriod": "60s",
                      "crossSeriesReducer": "REDUCE_SUM",
                      "groupByFields": [
                        "metric.label.\"QueryName\""
                      ],
                      "perSeriesAligner": "ALIGN_SUM"
                    },
                    "filter": "metric.type=\"logging.googleapis.com/user/dns-armor-log-based-metric\" resource.type=\"networksecurity.googleapis.com/DnsThreatDetector\""
                  },
                  "unitOverride": ""
                }
              }
            ],
            "thresholds": [],
            "yAxis": {
              "label": "",
              "scale": "LINEAR"
            }
          }
        }
      }
    ]
  }
}
2. Create the custom dashboard. Run the following gcloud commands within Cloud Shell.
gcloud monitoring dashboards create --config-from-file=dashboard.json
7. Generating emulated malicious DNS queries
In this section, you will perform the following tasks:
- SSH into the VMs.
- Install Git on the VMs.
- Clone the Infoblox threat detection simulator repository.
- Run the script and analyze the generated output.
Validate the setup by generating emulated malicious DNS queries from your VMs.
1. SSH into vm-a-use4. Run the following gcloud commands within Cloud Shell.
gcloud compute ssh vm-a-use4 --zone=us-east4-c
2. Install Git on the VM.
sudo apt-get install git -y
3. Clone the Infoblox threat detection simulator repository.
git clone https://github.com/infobloxopen/ib-threat-detection-simulator
4. Change directory to the simulator's directory.
cd ib-threat-detection-simulator/threat_detection_simulator/
5. Run the script and analyze the generated output.
Make the script executable.
chmod +x run.sh
Run the script.
./run.sh info basic
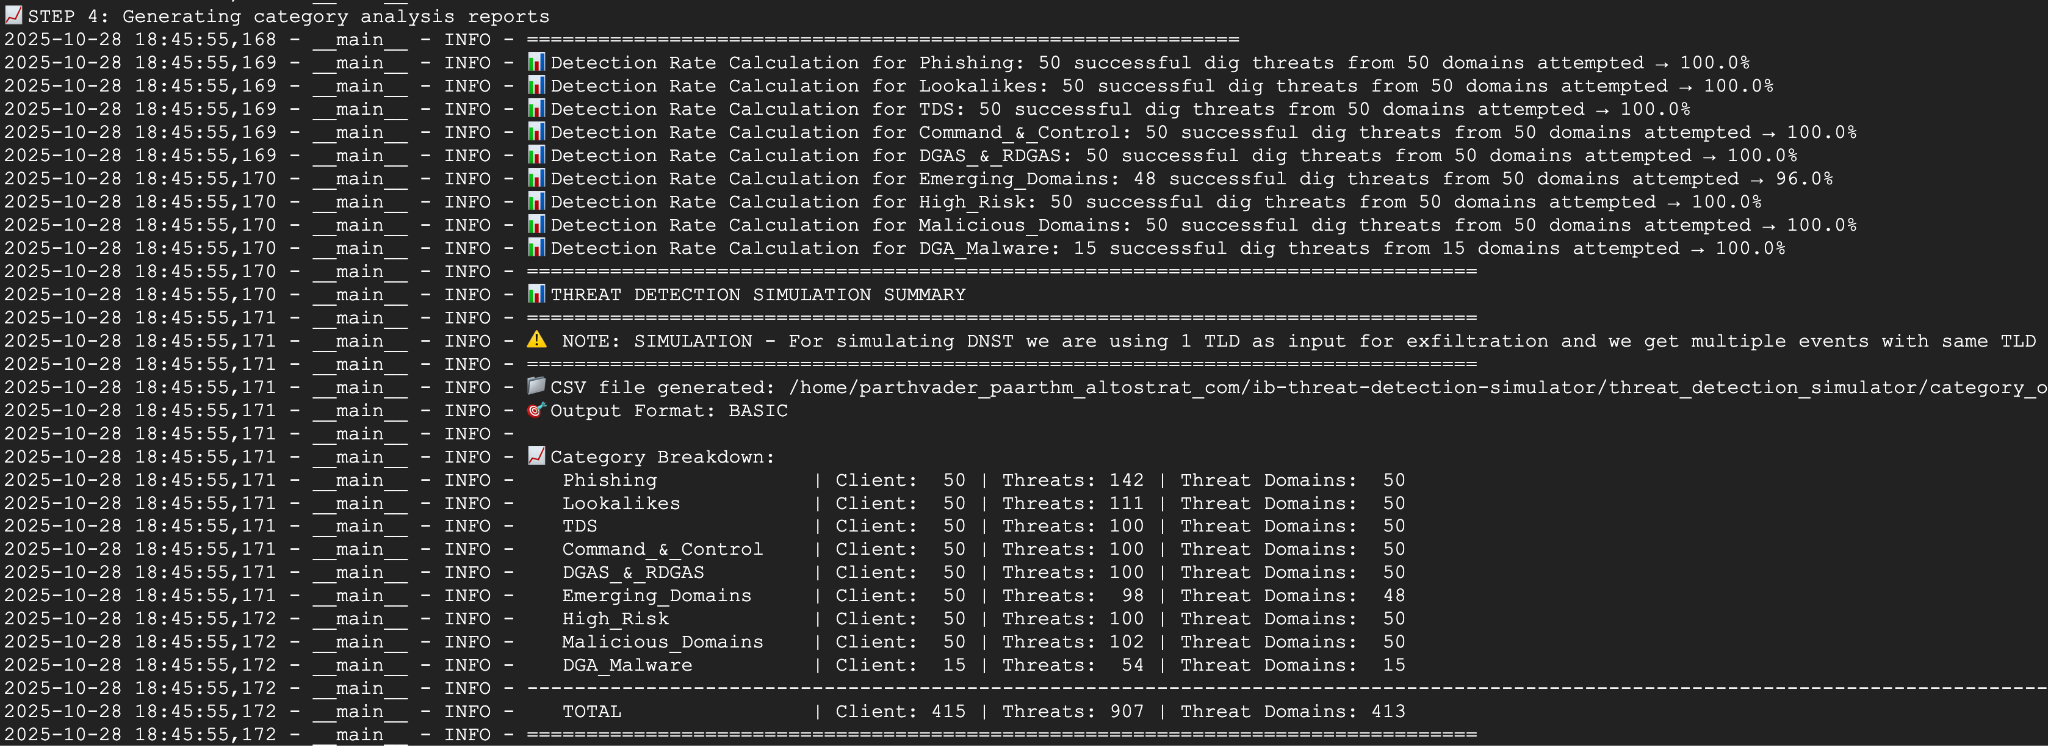
6. Sample Output
The following image displays a portion of the script's output as seen on a VM within network-a. This output details the detection rates for the different DNS threat types that the test script emulated.
7. Return to Cloud Shell by exiting the SSH session.
exit
8. View the custom dashboard
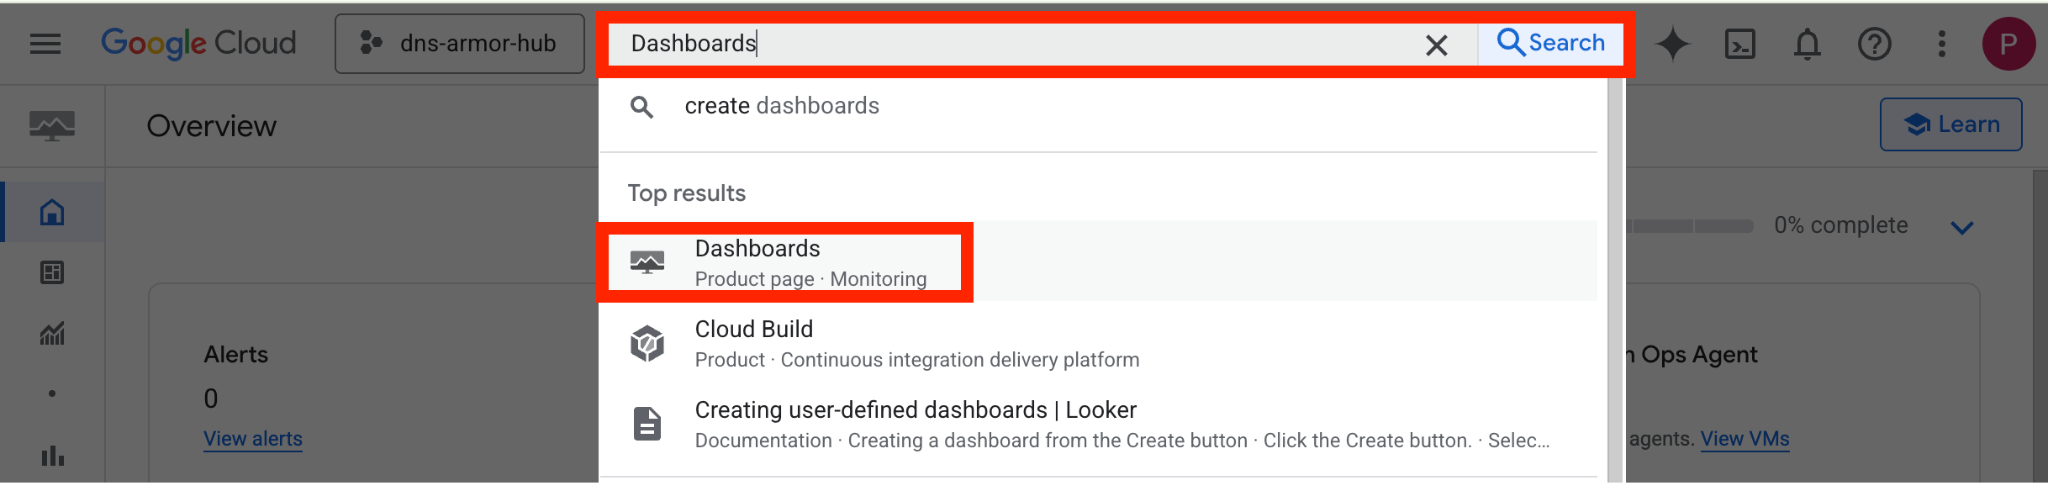
View the Dashboard
1. Type Dashboards into the search field at the top of the Google Cloud console, then click on Dashboards under top results.
2. Search for DNS Armor - Custom Dashboard in the search field and then click on DNS Armor - Custom Dashboard to open the dashboard.
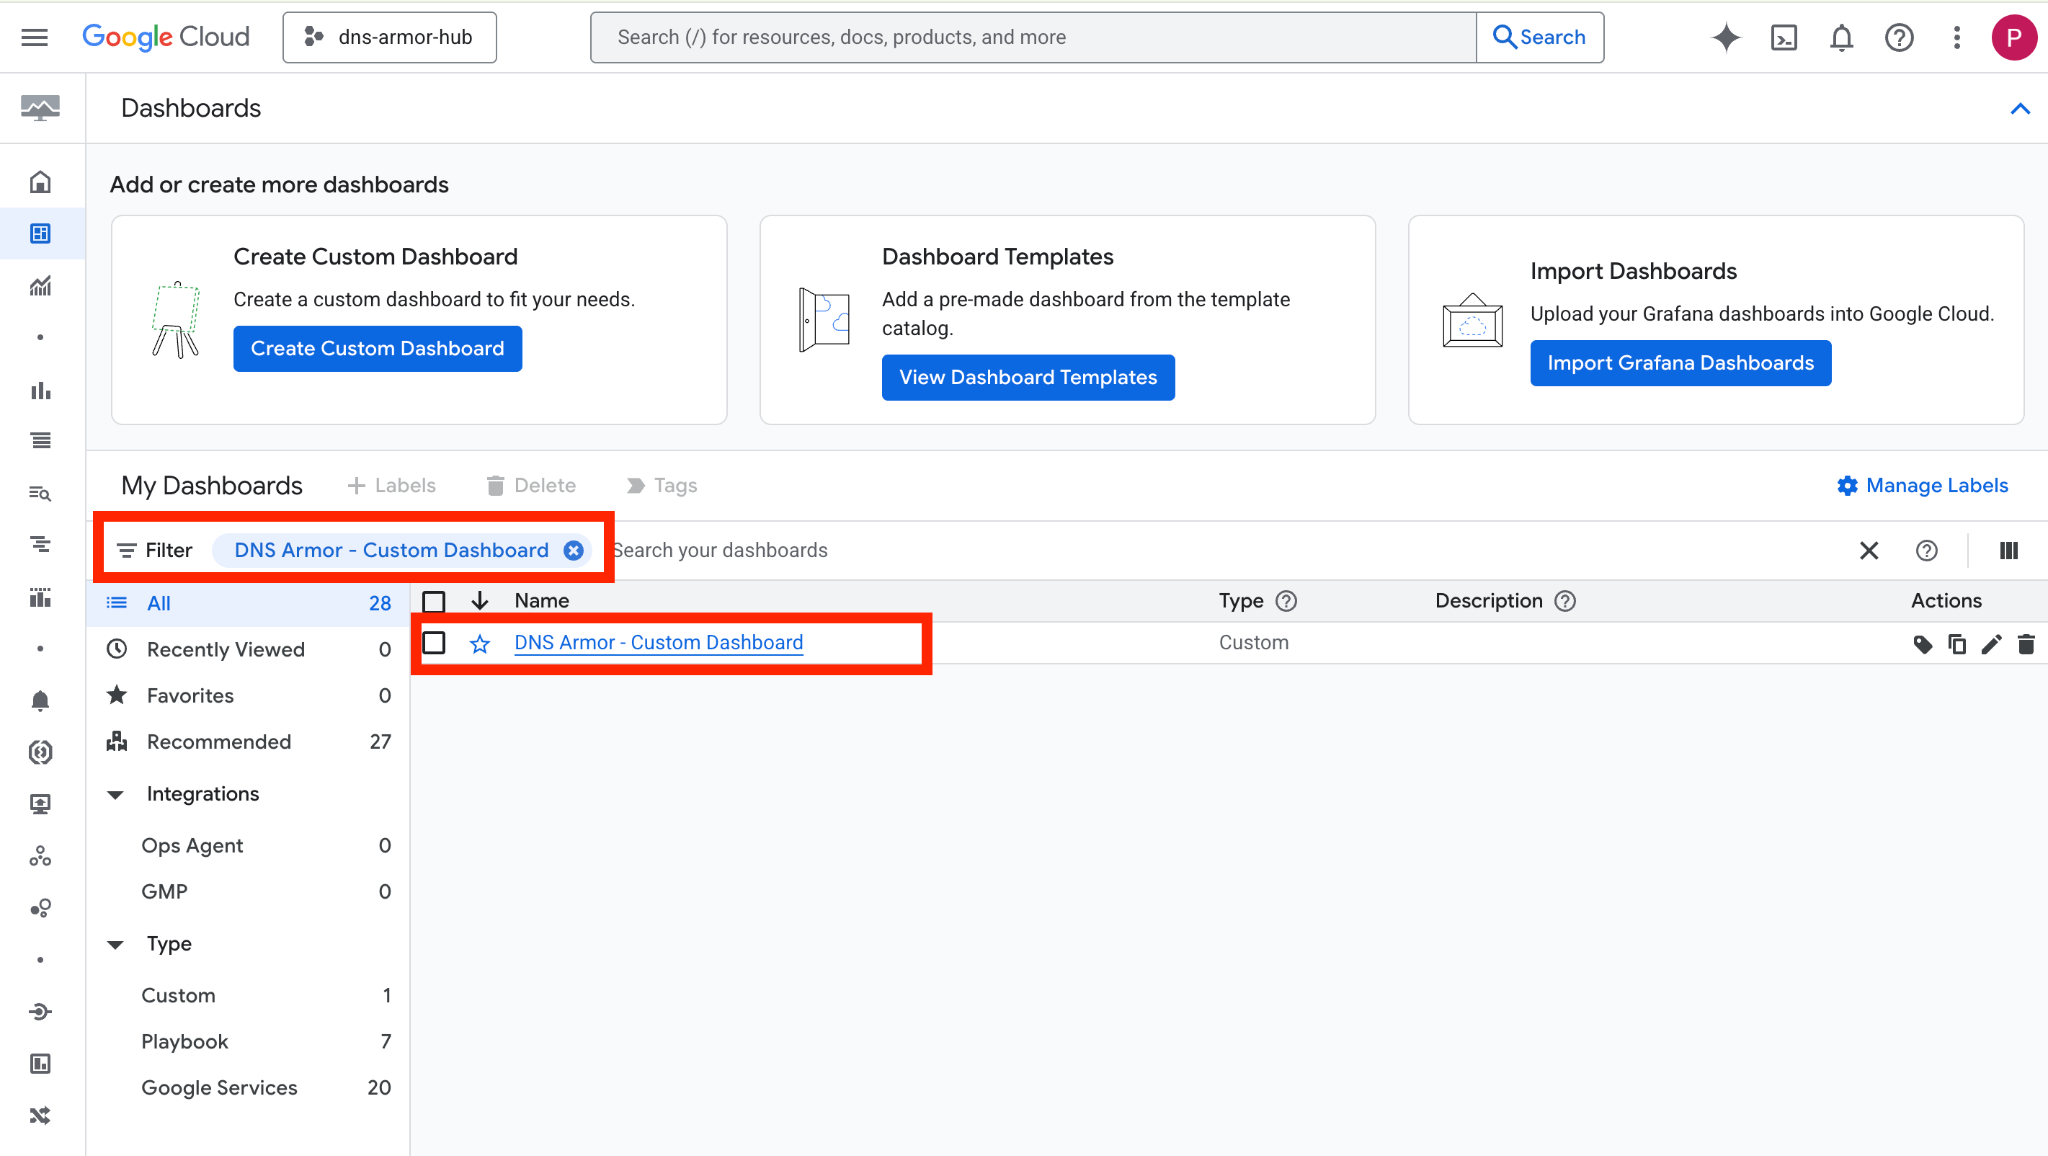
3. View the dashboard.
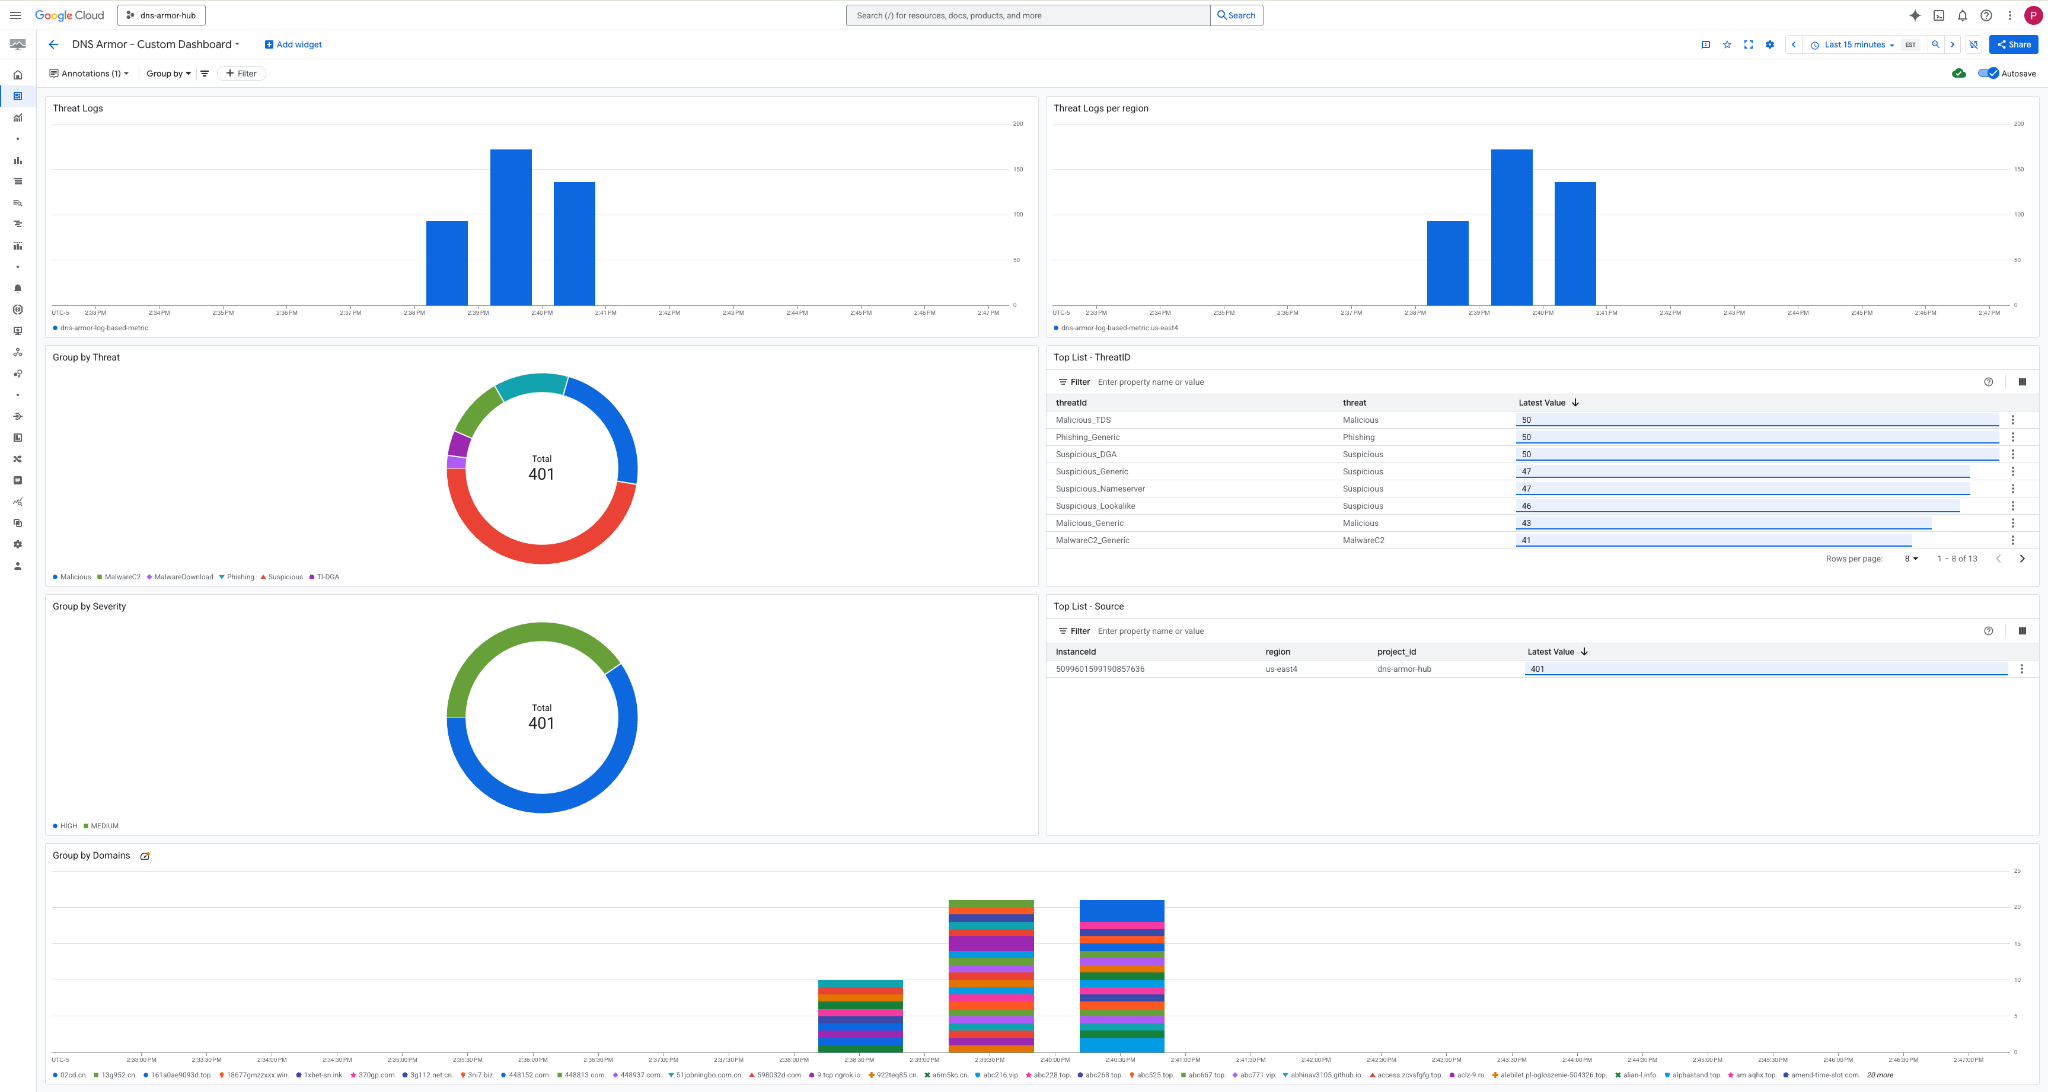
Widgets in the Dashboard
This section outlines the various widgets available on the custom dashboard, providing an overview of their functionalities and the data they represent.
- Threat Logs: A stacked bar chart displaying the threat logs generated for all included networks within a project over a specified timeframe.
- Threat Logs per region: A stacked bar chart illustrating threat logs, grouped by region, over a defined timeframe.
- Group by threat: A pie chart categorizing threat logs based on threat type within a given timeframe.
- Top List - ThreatID: A list showcasing the top 30 threat IDs within a specified timeframe.
- Group by severity: A pie chart grouping threat logs by severity level within a defined timeframe.
- Top List - Source: A list presenting the top 30 Instance IDs (Source VMs) within a specified timeframe.
- Group by Domains: A stacked bar chart grouping threat logs by the domain names found in the queries.
9. Cleanup
To avoid incurring future charges, delete the resources created in this codelab. Be sure to exit the shell of the VM and return to Cloud Shell when running the cleanup commands.
1. Delete the Custom Dashboard.
Since the dashboard ID is dynamically generated upon creation, you first need to retrieve the resource name using its display name.
DASHBOARD_NAME=$(gcloud monitoring dashboards list --filter="displayName='DNS Armor - Custom Dashboard'" --format='value(name)')
gcloud monitoring dashboards delete $DASHBOARD_NAME --quiet
2. Delete the Log-based Metric.
gcloud logging metrics delete dns-armor-log-based-metric --quiet
3. Delete the VMs.
gcloud compute instances delete vm-a-use4 --zone=us-east4-c --quiet
gcloud compute instances delete vm-a-usc1 --zone=us-central1-a --quiet
4. Delete the firewall rules.
gcloud compute firewall-rules delete allow-ssh-iap-a --quiet
5. Delete the Cloud NAT Gateways.
gcloud compute routers nats delete nat-a-use4 --router=router-a-use4 --region=us-east4 --quiet
gcloud compute routers nats delete nat-a-usc1 --router=router-a-usc1 --region=us-central1 --quiet
6. Delete the Cloud Routers.
gcloud compute routers delete router-a-use4 --region=us-east4 --quiet
gcloud compute routers delete router-a-usc1 --region=us-central1 --quiet
7. Delete the subnets.
gcloud compute networks subnets delete subnet-a-use4 --region=us-east4 --quiet
gcloud compute networks subnets delete subnet-a-usc1 --region=us-central1 --quiet
8. Delete the DNS threat detector.
gcloud beta network-security dns-threat-detectors delete my-dns-threat-detector --location=global --quiet
9. Delete the VPCs.
gcloud compute networks delete network-a --quiet
10. Congratulations
Congratulations! You have successfully configured, deployed, and visualized DNS Armor threat detection logs . You've gained hands-on experience in protecting your Google Cloud environment from DNS-based threats and building a custom monitoring solution for security insights.
In this codelab, you have:
- Provisioned a network environment with VPC, subnets, and virtual machines.
- Configured internet egress for private VMs using Cloud NAT.
- Deployed a DNS Armor threat detector.
- Simulated DNS threats and validated the threat detection configuration.
- Created a custom log-based metrics from DNS threat logs.
- Built a custom Cloud Monitoring dashboard to visualize and analyze DNS threats.