
1. 🏰 Disneyland Data Analytics Hackathon (2nd Edition - 3rd Dec) 🏰
Summary | In this Hackathon, you will build an end-to-end data analytics pipeline leveraging AI/ML capabilities on Google Cloud. You'll load data into AlloyDB, a fully-managed, PostgreSQL-compatible database optimized for demanding workloads, then use Datastream, a serverless change data capture (CDC) service, to move it to BigQuery, Google Cloud's serverless data warehouse. In BigQuery, you'll apply BigQuery ML, which allows you to create and execute machine learning models directly in BigQuery using standard SQL, for review analysis and attendance forecasting. Finally, you'll play around with agents, either out of the box through Conversational Analytics & Data Agents or create a custom agent, powered by Agent Development Kit and MCP toolbox for natural language interaction with your data. |
categories | docType:Codelab, product:Bigquery |
Author | Rayhane Rezgui, Matt Cornillon |
Layout | scrolling |
Robots | noindex |
2. Introduction
Welcome, future Disney data wizards!🪄
Forget tedious travel guides and endless forum scrolling. Imagine planning the perfect Disneyland trip, equipped with data-driven insights. Which park offers the best experience? When are the crowds thinnest? Can you predict the best time to conquer that notoriously long queue?
In this Hackathon, you're building your ultimate Disneyland planning tool. We've got the data: reviews from visitors across global branches, historical waiting times, and attendance figures. Your mission? Transform this raw data into actionable insights:
- Gather Data: Load diverse Disneyland reviews, waiting times, and attendance figures into AlloyDB, our high-performance, PostgreSQL-compatible database.
- Seamless Movement: Use Datastream, our serverless change data capture service, to effortlessly move this dynamic information into BigQuery, Google Cloud's powerful serverless data warehouse.
- Predict the Magic: Unleash BigQuery ML to analyze review sentiment and forecast waiting times directly with SQL. Discover which branches consistently deliver smiles and the optimal time for your visit.
- Talk to your data - literally!: Use pre-built tools that allow you to get insights with a swipe of a wand.
- Intelligent Interaction: Crown your creation with an intelligent agent, powered by MCP toolbox for databases and ADK (Agent Development Kit). Ask, "What's the best attraction in DisneyLand Paris for space lovers, and what is the best time to join the queue?" and get instant, data-driven answers.
Get ready to unlock the secrets of the most magical places on Earth and build a data analytics pipeline that would make Mickey proud!
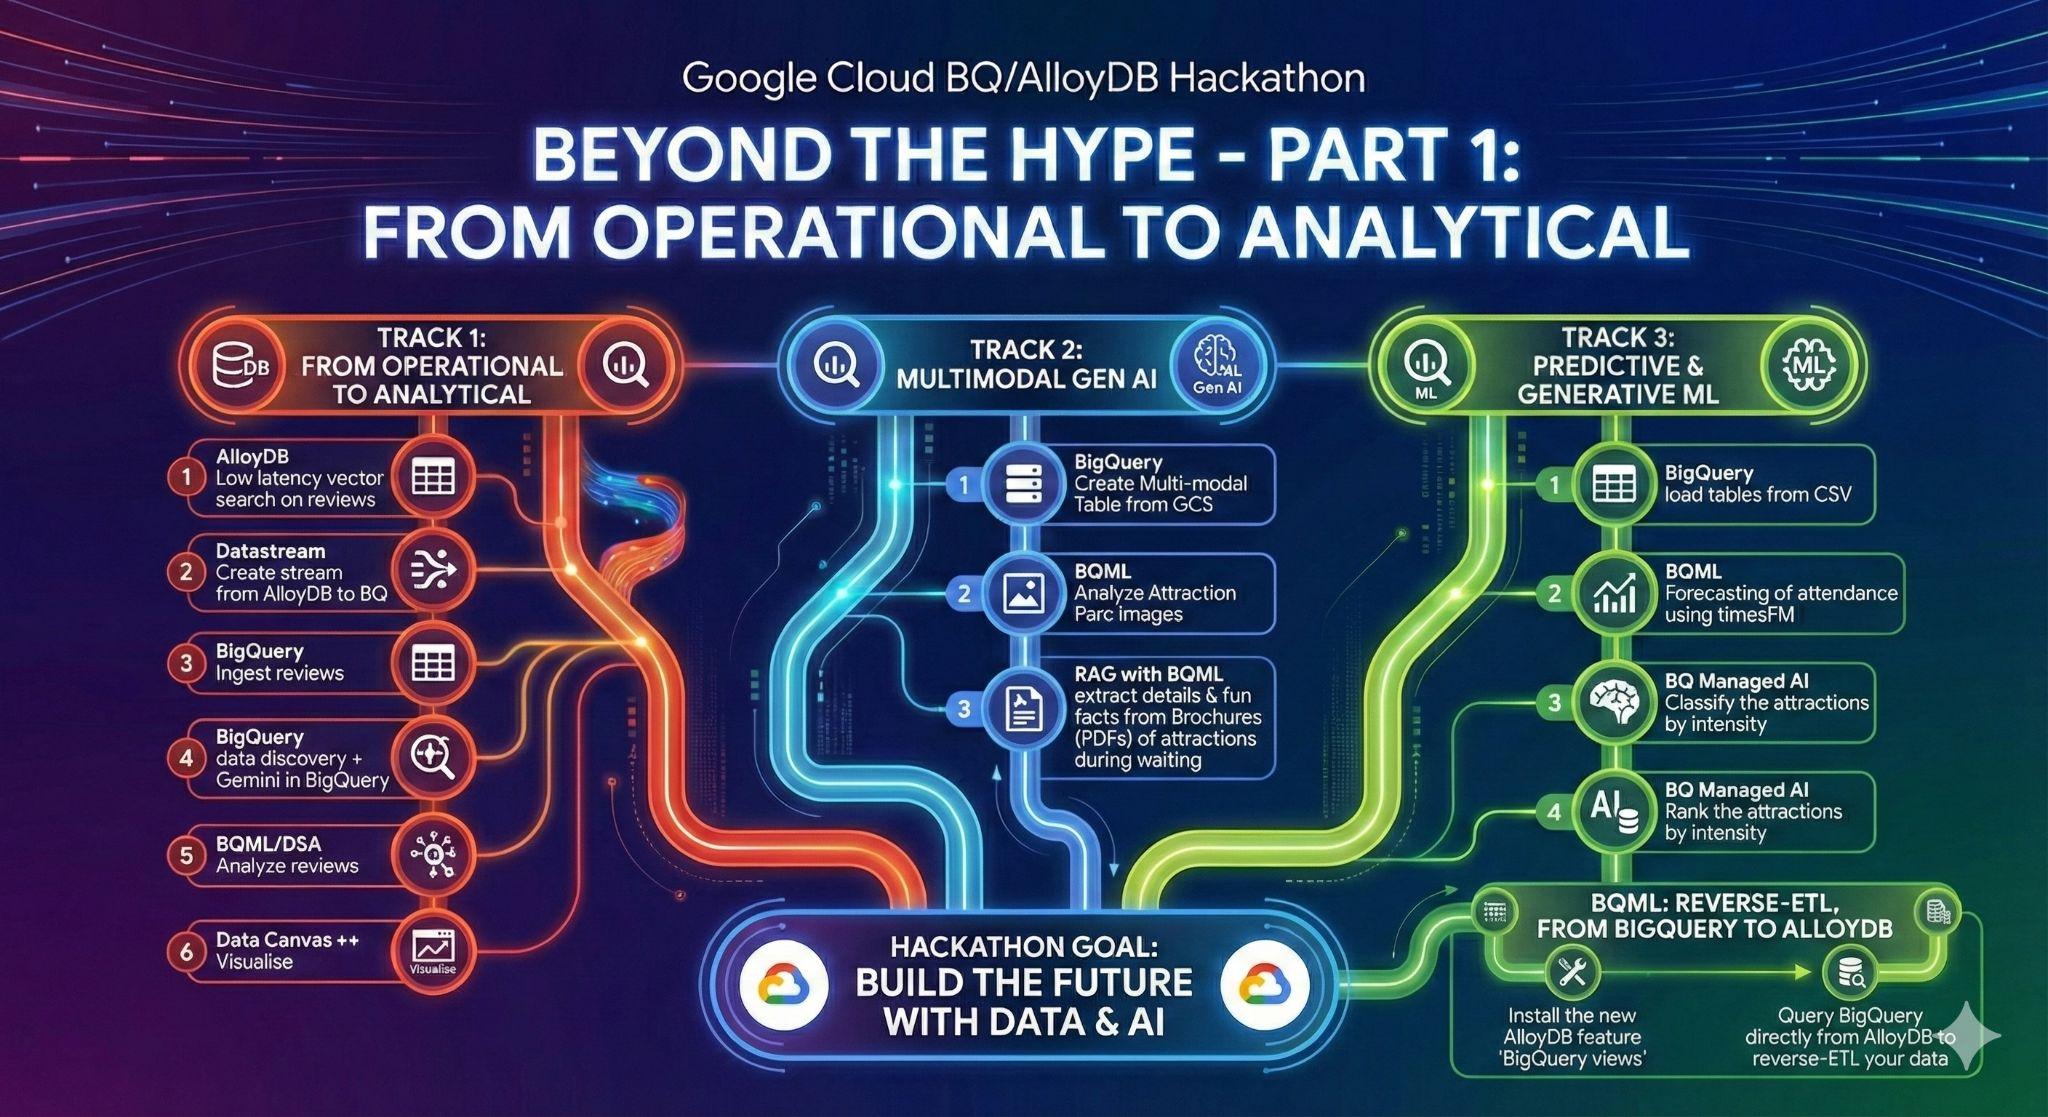
3. Task 1: From Operational to Analytical; Analyze Disneyland reviews with Gemini
For this initial stage, you will retrieve the data from your AlloyDB operational database and load it into BigQuery for subsequent data analysis.
You will also set up everything needed in AlloyDB for your future agent!
Data loading in AlloyDB
First of all, let's import some data into our AlloyDB for PostgreSQL cluster !
We are gonna ingest 20k reviews for DisneyLand amusement parks and a list of attractions.
The steps you need to take are as follows:
Tables creation:
- Create a table disneyland_reviews with 6 columns: review_id and rating as integer, year_month, reviewer_location, review_text, branch as text.
- Create a table disneyland_attractions with 4 columns: attraction_id as integer, branch, name and description as text.
Using the tool of your choice, import data from the CSVs:
gs://hackathon_data_disneyland_<YOUR_PROJECT_3DIGITS>/reviews.csvfor the reviews tablegs://hackathon_data_disneyland_<YOUR_PROJECT_3DIGITS>/attractions.csvfor the attractions table
To provide attractions recommendation, we need to create embeddings of attractions description:
- Install the pgvector extension in AlloyDB
- Add a vector column called "embedding" to your table attraction
- Generate and populate the embedding of the descriptions using the native integration between AlloyDB and Vertex AI
From operational to analytical with Datastream
To stream our data from AlloyDB to BigQuery, we're gonna use Google Datastream. It's a powerful serveless solution that will listen to all changes in source tables (using Change Data Capture) and send them to BigQuery.
To be able to replicate changes from AlloyDB with Datastream, we need to create what is called a publication and replication slot on Postgres.
Execute the following queries on your AlloyDB cluster (you need to run them one at a time):
CREATE PUBLICATION pub_disney FOR TABLE disneyland_reviews, disneyland_attractions;

ALTER USER postgres WITH REPLICATION;

SELECT PG_CREATE_LOGICAL_REPLICATION_SLOT('slot_disney', 'pgoutput');
You'll use the publication and replication slot in your stream so remember the names!
And that's all, now we can create a stream!
The steps in Datastream you need to take are as follows:
- Create a source profile for your AlloyDB cluster (use the public IP address)
- Create a destination profile for BigQuery
- Create a stream from AlloyDB to BigQuery.
The data should be available in BigQuery in a few minutes.
Data Discovery in BigQuery
Now that we have our data in BigQuery, let's make sure we know the new enhancements in the interface before getting into work!
We have 3 new functions that you can already see in the BigQuery exploration panel.
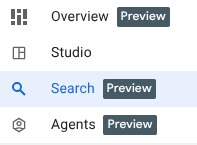
- Overview: contains information about BigQuery features, tours to get started on analysis amongst other possibilities.
- Search: perform semantic search on your data assets.
- Agents: Shhh! We'll save this for later 🤫
Search your data semantically in BigQuery
Go to the Search tab in BigQuery exploration panel, and play around with terms related to disney like "attractions" or "branch".
Visualize your Data in BigQuery
You can now visualize and manipulate your data in BigQuery. For this, you can run this query in a new query tab;
SELECT
  *
FROM
  [dataset_name].[table_name];
Generate data insights on the reviews table
In this task, you will enable data insights on the disneyland_reviews table within the disney dataset.
Data insights is a tool for anyone who wants to explore their data and gain insights without writing complex SQL queries.
This might take a few minutes.
Query the disneyland_reviews table without SQL
The insights you generated in the previous section are now ready. In this task, you will use a prompt generated from these insights to query the disneyland_reviews table without using code.
Select an insight and run the query associated with it. For example, find the query that calculates the difference in the average rating between consecutive months for each branch. It would look like this:
WITH
 monthly_avg AS (
 SELECT
   branch,
   year_month,
   AVG(rating) AS avg_rating
 FROM
   [dataset_name].[table_name]
 WHERE
   year_month IS NOT NULL
 GROUP BY
   1,
   2 )
SELECT
 branch,
 year_month,
 avg_rating,
 avg_rating - LAG(avg_rating, 1, 0) OVER (PARTITION BY branch ORDER BY year_month) AS rating_difference
FROM
 monthly_avg
ORDER BY
 branch,
 year_month;
Use BigQuery Knowledge engine to better understand the data
First things first; let's start with looking at the Insights tab on a dataset level; this will give us an idea on the hidden relationships across tables in the disney dataset. Then,
- Generate a description of the dataset using Gemini and add it to the dataset details.
- Generate a description of the tables reviews and attractions; as well as all the individual columns in those tables, and save it.
Perform a profile scan of your data
The goal of this section is to clean and prepare your data. However, you're not very familiar with the distribution of the values of each column. You need to profile your data to know what kind of transformation steps you need to perform on your data.
Google Cloud's Dataplex Universal Catalog automates profiling scans to deliver consistent data quality metrics. Key statistics identified include null counts, distinct values, data ranges, and value distributions. It's possible to activate a profile scan through the BigQuery Interface.
It can take a couple of minutes, so you can look at the next section while waiting.
Answer the following questions:
- What's the average rating of Disneyland?
- Where are reviewers located the most?
- Are all reviews unique?
- What's the percentage of missing data from the Year_Month column?
Perform a quality scan of your data
Dataplex Universal Catalog automatic data quality lets you define and measure the quality of the data in your BigQuery tables. You can automate the scanning of data, validate data against defined rules, and log alerts if your data doesn't meet quality requirements. You can manage data quality rules and deployments as code, improving the integrity of data production pipelines.
Based on the profile scan, define a quality scan (on no more than 10% of your data as sample size) that:
- Checks for null values for the column "branch"
- Performs a validity check for the "rating", as it can only be in the set of : 1,2,3,4,5
- Checks uniqueness of "review_id"
Make sure the scan exports results to a BigQuery Table quality_scan_results.
Think about all the potential transformations you need to apply to your data.
Prepare your data using Gemini's Data Preparation
Following the data quality and profiling scans you performed, it's time to clean the data before analyzing it.
Data preparations are BigQuery resources, which use Gemini in BigQuery to analyze your data and provide intelligent suggestions for cleaning, transforming, and enriching it. You can significantly reduce the time and effort required for manual data preparation tasks.
In this section, you'll use Data Preparation to perform these operations on your disneyland_reviews table:
- Filter out rows where the Branch column is either NULL or an empty string.
- Replace "missing" in Year_Month by Null.
- Replaces underscores with spaces in the branch column to improve readability
- Export to transformed table disneyland_reviews_cleaned
Analyze reviews with Gemini
Now that you've cleaned your data, you can start analyzing it using BigQuery ML and Gemini models. You have two objectives:
- Extract categories from reviews
- Sentiment Analysis of disneyland_reviews
BigQuery ML lets you create and run machine learning (ML) models by using GoogleSQL queries. BigQuery ML models are stored in BigQuery datasets, similar to tables and views. BigQuery ML also lets you access Vertex AI models and Cloud AI APIs to perform artificial intelligence (AI) tasks like text generation or machine translation. Gemini for Google Cloud also provides AI-powered assistance for BigQuery tasks.
You can choose to use ML.GENERATE_TEXT or AI.GENERATE (preview) with Gemini pro or Flash models.
The following steps guide you through if you want to use ML.GENERATE_TEXT.
Create the cloud resource connection and grant IAM role
You need to create a Cloud resource connection in BigQuery to Vertex AI models, so you can work with Gemini Pro and Gemini Flash models. You will also grant the cloud resource connection's service account IAM permissions, through a role, to enable it access the Vertex AI services.
Grant Vertex AI User role to the connection's service account
Allow the connection's service account to use your chosen model (for example gemini-2.5-flash), by granting it the Vertex AI User role. It takes 1 minute for the permission to propagate.
Create the Gemini models in BigQuery
Create your model by using the connection above. Use for example the endpoint gemini-2.5-flash.
Prompt Gemini to analyze customer reviews for categories and sentiment
In this task, you will use the Gemini model to analyze each customer review for categories and sentiment, either positive or negative.
Analyze the customer reviews for categories
Note: From now on, for the analysis, we'll only take 100 rows, as Gemini call on 20k rows can take a while.
Extract categories by modifying and running the following SQL Query:
CREATE OR REPLACE TABLE
[dataset_name].[results_table_name] AS (
SELECT Review_ID, Rating, Year_Month, Reviewer_Location, Review_Text, Branch, ml_generate_text_llm_result AS categories FROM
ML.GENERATE_TEXT(
MODEL [model_name],
(
   SELECT Review_ID, Rating, Year_Month, Reviewer_Location, Review_Text, Branch, CONCAT(
      '[WRITE YOUR PROMPT HERE].',
      Review_Text) AS prompt
   FROM (SELECT * FROM [dataset_name].[table_name] LIMIT 100)
),
STRUCT(
   0.2 AS temperature, TRUE AS flatten_json_output)));
This query takes customer reviews from the disneyland_reviews table, constructs prompts for the gemini model to identify categories within each review. The results should be stored in a new table reviews_categories
. Please wait. The model takes approximately 30 seconds to process the customer review records and to have the results in the output table.
Display the results:
SELECT * FROM [dataset_name].[results_table_name];
Take some time to read some of the categories.
Analyze the customer reviews for positive and negative sentiment
Based on the SQL query for Keyword extraction, write a query that analyses review into Positive, Negative and Neutral under a column called "sentiment".
This query takes customer reviews from the disneyland_reviews table, constructs prompts for the gemini model to classify the sentiment of each review. The results are then stored in a new table reviews_analysis, so that you may use it later for further analysis. Please wait. The model takes a few seconds to process the customer review records. When the model is finished, the result is in the reviews_analysis table that is created.
Explore the results:
SELECT * FROM [...];
The reviews_analysis table has the Sentiment column containing the sentiment analysis, with the social_media_source, review_text, customer_id, location_id and review_datetime columns included. Take a look at some of the records. You may notice some of the results for positive and negative may not be formatted correctly, with extraneous characters like periods, or extra space. You can sanitize the records by using the view below.
Create a view to sanitize the records
Create a view that sanitizes the values of the column sentiment by:
- Using LOWER to make sure all the values are lowercase.
- Removing punctuation (. and , and space) by using REPLACE
CREATE OR REPLACE VIEW [view_name] AS
SELECT [SANITIZATION_EXPRESSION] AS sentiment,
Review_ID, Rating, Year_Month, Reviewer_Location, Review_Text, Branch,
FROM `disney.reviews_analysis`;
The query creates the view cleaned_data_view and includes the sentiment results, the review text, Review_ID, Rating, Year_Month, Reviewer_Location, Review_Text and Branch. It then takes the sentiment result (positive or negative) and ensures that all letters are made lower case, and extraneous characters like extra spaces or periods are removed. The resulting view will make it easier to do further analysis in later steps within this lab.
- You can query the view with the query below, to see the rows created.
SELECT * FROM [view_name];
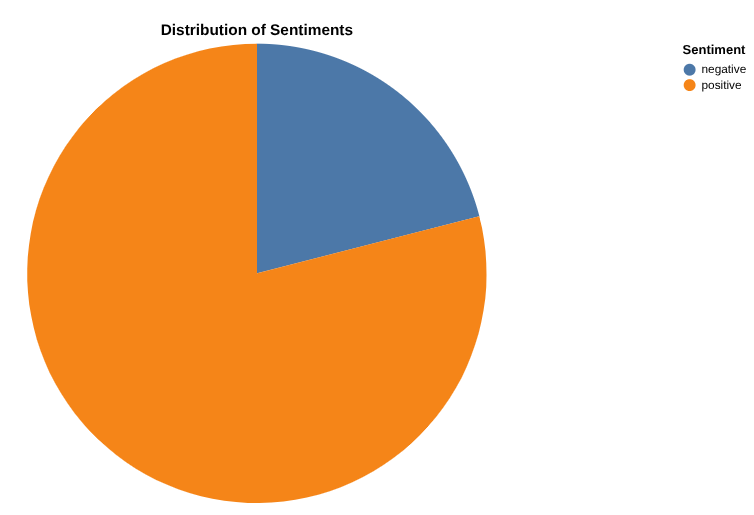
Create a report of positive and negative review counts with Data Canvas
Now, it's time to analyze your results. Let's start by doing directly in BigQuery, through Data Canvas. This is a tool that allows you to search data (semantically or keyword), query and join tables, create graphs and get insights by creating a flow of canvas.
Your final goal is to create a graph of your choice of the percentages of positive vs negative reviews . Here's an example:
Create a graph of the number of reviews per category, as well as the distribution of positive and negative reviews for each category
Tip: Activate and use Data Canvas's Advanced Analysis, which runs a Python Notebook inside a canvas.
4. Task 2: Analyze attraction parc images to identify Disneyland photos & extract fun facts from Park Brochures
Image Analysis in BigQuery
You have access to some thrilling and appealing pictures of Attraction parc that visitors took along the years. You're so excited for your upcoming trip! However, you don't know which ones are actual photos of disneyland. You're tasked with identifying those. The pictures are located in gs://hackathon_data_disneyland_<YOUR_PROJECT_3DIGITS>/attraction_parc_photos/.

Is_disneyland: False

Is_disneyland: True
In order to rapidly perform this analysis. You should use BigQuery's object tables and Gemini through BigQuery ML (ML.GENERATE_TEXT).
Can you verify the output of Gemini by checking some photos?
Create your own RAG system with BigQuery on Disneyland brochures
While waiting in line, you want to get some fun facts/technical details about the attraction you're waiting for.
In gs://hackathon_data_disneyland_<YOUR_PROJECT_3DIGITS>/disneyland_brochures/, you'll find PDF files that contain brochures for all parks around the world.
Goal: Create a Retrieval-Augmented Generation (RAG) system entirely within BigQuery to allow users to ask complex questions about the park based on some PDF documents.
To achieve this, you need to:
- Create an object table of pdf files
- Create a Python UDF to chunk PDF files. Here's an example you can use:
CREATE OR REPLACE FUNCTION disney.chunk_pdf(src_json STRING, chunk_size INT64, overlap_size INT64)
RETURNS ARRAY<STRING>
LANGUAGE python
WITH CONNECTION `[LOCATION].[CONN_NAME]`
OPTIONS (entry_point='chunk_pdf', runtime_version='python-3.11', packages=['pypdf'])
AS """
import io
import json

from pypdf import PdfReader  # type: ignore
from urllib.request import urlopen, Request

def chunk_pdf(src_ref: str, chunk_size: int, overlap_size: int) -> str:
 src_json = json.loads(src_ref)
 srcUrl = src_json["access_urls"]["read_url"]

 req = urlopen(srcUrl)
 pdf_file = io.BytesIO(bytearray(req.read()))
 reader = PdfReader(pdf_file, strict=False)

 # extract and chunk text simultaneously
 all_text_chunks = []
 curr_chunk = ""
 for page in reader.pages:
     page_text = page.extract_text()
     if page_text:
         curr_chunk += page_text
         # split the accumulated text into chunks of a specific size with overlaop
         # this loop implements a sliding window approach to create chunks
         while len(curr_chunk) >= chunk_size:
             split_idx = curr_chunk.rfind(" ", 0, chunk_size)
             if split_idx == -1:
                 split_idx = chunk_size
             actual_chunk = curr_chunk[:split_idx]
             all_text_chunks.append(actual_chunk)
             overlap = curr_chunk[split_idx + 1 : split_idx + 1 + overlap_size]
             curr_chunk = overlap + curr_chunk[split_idx + 1 + overlap_size :]
 if curr_chunk:
     all_text_chunks.append(curr_chunk)

 return all_text_chunks
""";
- Parse the PDF file into chunks
- Generate embeddings after creating a remote model
- Run a vector search to find "
Ou manger un repas tex-mex à volonté?" or "where to eat a tex-mex meal buffet-style?" - Generate an answer augmented by vector search results of the question "
Ou manger un repas tex-mex à volonté?" or ""where to eat a tex-mex meal buffet-style?"
5. Task 3: Machine Learning at scale with BigQuery: Forecasting, classification & ranking
Forecast Waiting times
The pictures are very cool! You can't wait! Now in order to know which attractions to choose and which ones to avoid, you want to know the actual waiting times for some of the attractions between Paris and California. Your task is to forecast waiting_times of every attraction using Machine Learning (Arima plus or TimesFM) for every 30mns in 2025.
The data you'll use is in this csv file: gs://hackathon_data_disneyland_<YOUR_PROJECT_3DIGITS>/waiting_times.csv
The steps of your task are:
- Load the file into your BigQuery dataset under a table called waiting_times.
- Train a forecasting model on your data (Arima_Plus) or forecast directly using AI.Forecast
- Evaluate the model performance or compare the forecasted data to the input data
Classify the rides by intensity
You're visiting Disneyland with friends, and while the park is generally family-friendly, some rides can be too intense for some people. Let's use BigQuery Managed AI functions to classify and rank the attractions by thrill & intensity level, without human bias, so we can accommodate to everyone.
- Use
AI.CLASSIFYto categorize rides based on their descriptions into one of three magical categories: [easy-peasy, thrilling, extreme]
Rank rides on thrill level
- Use
AI.SCOREto compare and order attractions based on a thrill level, where Rank 10 is the most extreme and Rank 1 is the least.
6. Task 3-Bonus: Reverse-ETL, from BigQuery to AlloyDB
You've taken advantage of BigQuery's powerful capabilities to generate insights on large amounts of data. Now you want those insights to be actionable by your operational applications (and AI agents!).
But how? By going the other way around! AlloyDB for Postgres thrive at serving data with low-latency and high speed, perfect for your critical user facing applications. So let's reverse-ETL the data we just generated.
In order to do that, we are gonna use a brand new feature, still in private preview, called "BigQuery views" in AlloyDB. This feature allows you to query BigQuery data right in your Postgres database.
First, you need to grant your AlloyDB cluster service account the necessary privileges to query BigQuery.
gcloud beta alloydb clusters describe <CLUSTER ID> --region=europe-west1
The output contains a serviceAccountEmail field, which is the service account for this cluster.
In the Google Cloud Console, go to the IAM page and grant the following privileges to this principal:
- BigQuery Data Viewer (roles/bigquery.dataViewer)
- BigQuery Read Session User (roles/bigquery.readSessionUser)
Now, go to AlloyDB Studio in the Console and connect to the "postgres" database.
Execute the following queries to install and configure the new feature:
CREATE EXTENSION bigquery_fdw;

CREATE SERVER bq_disney FOREIGN DATA WRAPPER bigquery_fdw;

CREATE USER MAPPING FOR postgres SERVER bq_disney ;
You can now create a "foreign table" that will be mapped to a current table in BigQuery. Use any table you created in Task 3. Here's an example of the syntax:
CREATE FOREIGN TABLE reviews_analysis ( "Review_ID" int,
    "Sentiment" text) SERVER bq_disney OPTIONS (PROJECT 'bqml-hack25par-xxx',
    dataset 'disney',
    TABLE 'reviews_analysis');
All set, let's query the table! Execute a first SELECT to validate the link between AlloyDB and BigQuery, and finally create a new table in AlloyDB to ingest the data from your foreign table.
7. Task 4: Out-of-the-Box Data Agents
You have friends who want to contribute to the Disneyland Application project. They have access to the data in BigQuery, but have varying levels in SQL and data engineering. You want to leverage BigQuery's recent announcements around data agents that are already integrated into the UI to assist your friends:
- Create Data pipelines.
- Collaborate on SQL code.
- Talk to their Data.
Data Engineering Agents for automating your Data Pipelines
Create a new view average_waiting_time that joins the table waiting time and attractions, and calculates the average waiting_time per attraction, using the Data Engineering Agent.
Create your Conversational Analytics agent in BigQuery
What if you could create an agent to talk to your data, without coding, without SQL, and without deployment, and from BigQuery's interface, how cool would that be? Well it's possible today with the "Agents" tab in BigQuery.
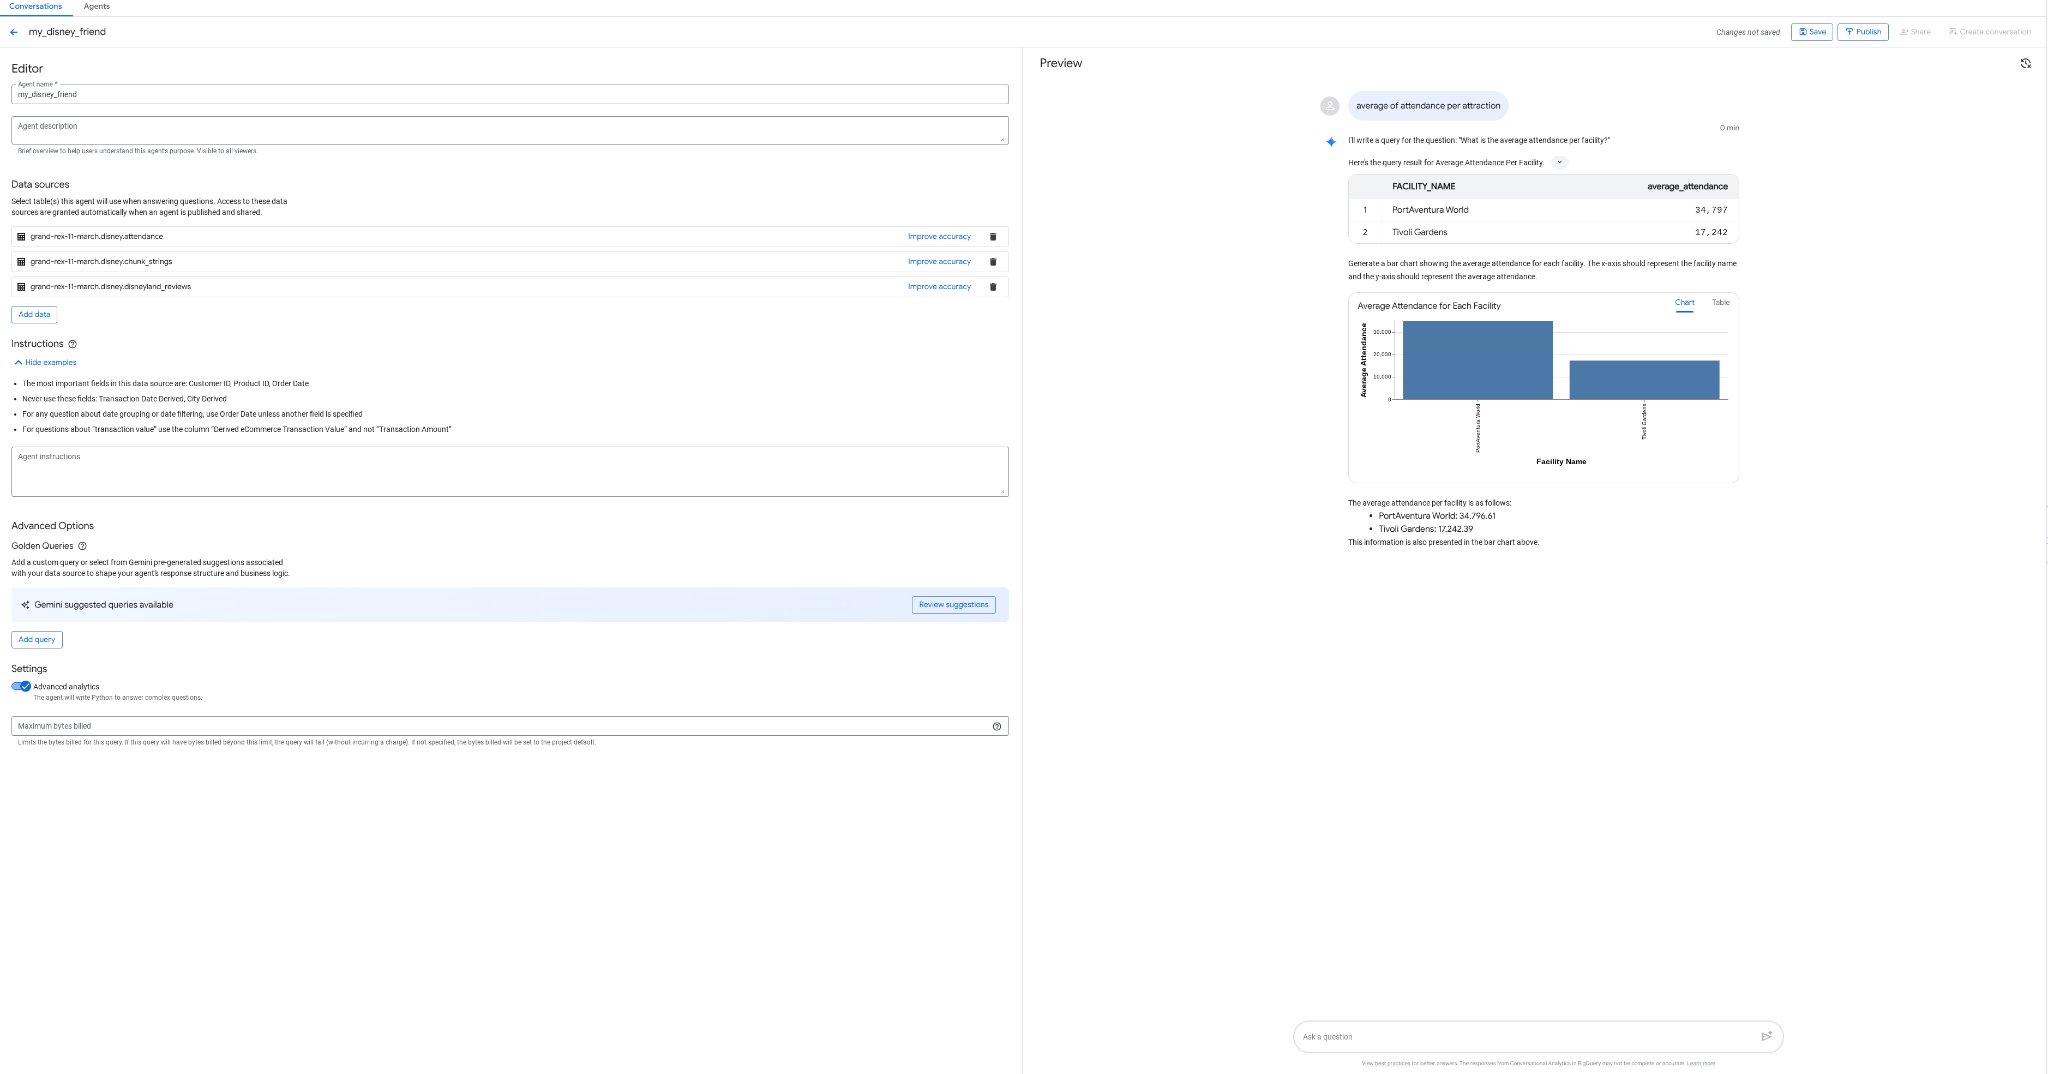
- Create an agent my_disney_friend, that connects to your disney tables. You can improve the agent performance by filling the Agent instructions. Ask questions like "what percentage of positive vs negative reviews, what's the average waiting time per attraction,etc ... ?"
- Publish the agent in BigQuery and on API (you will be using it later).
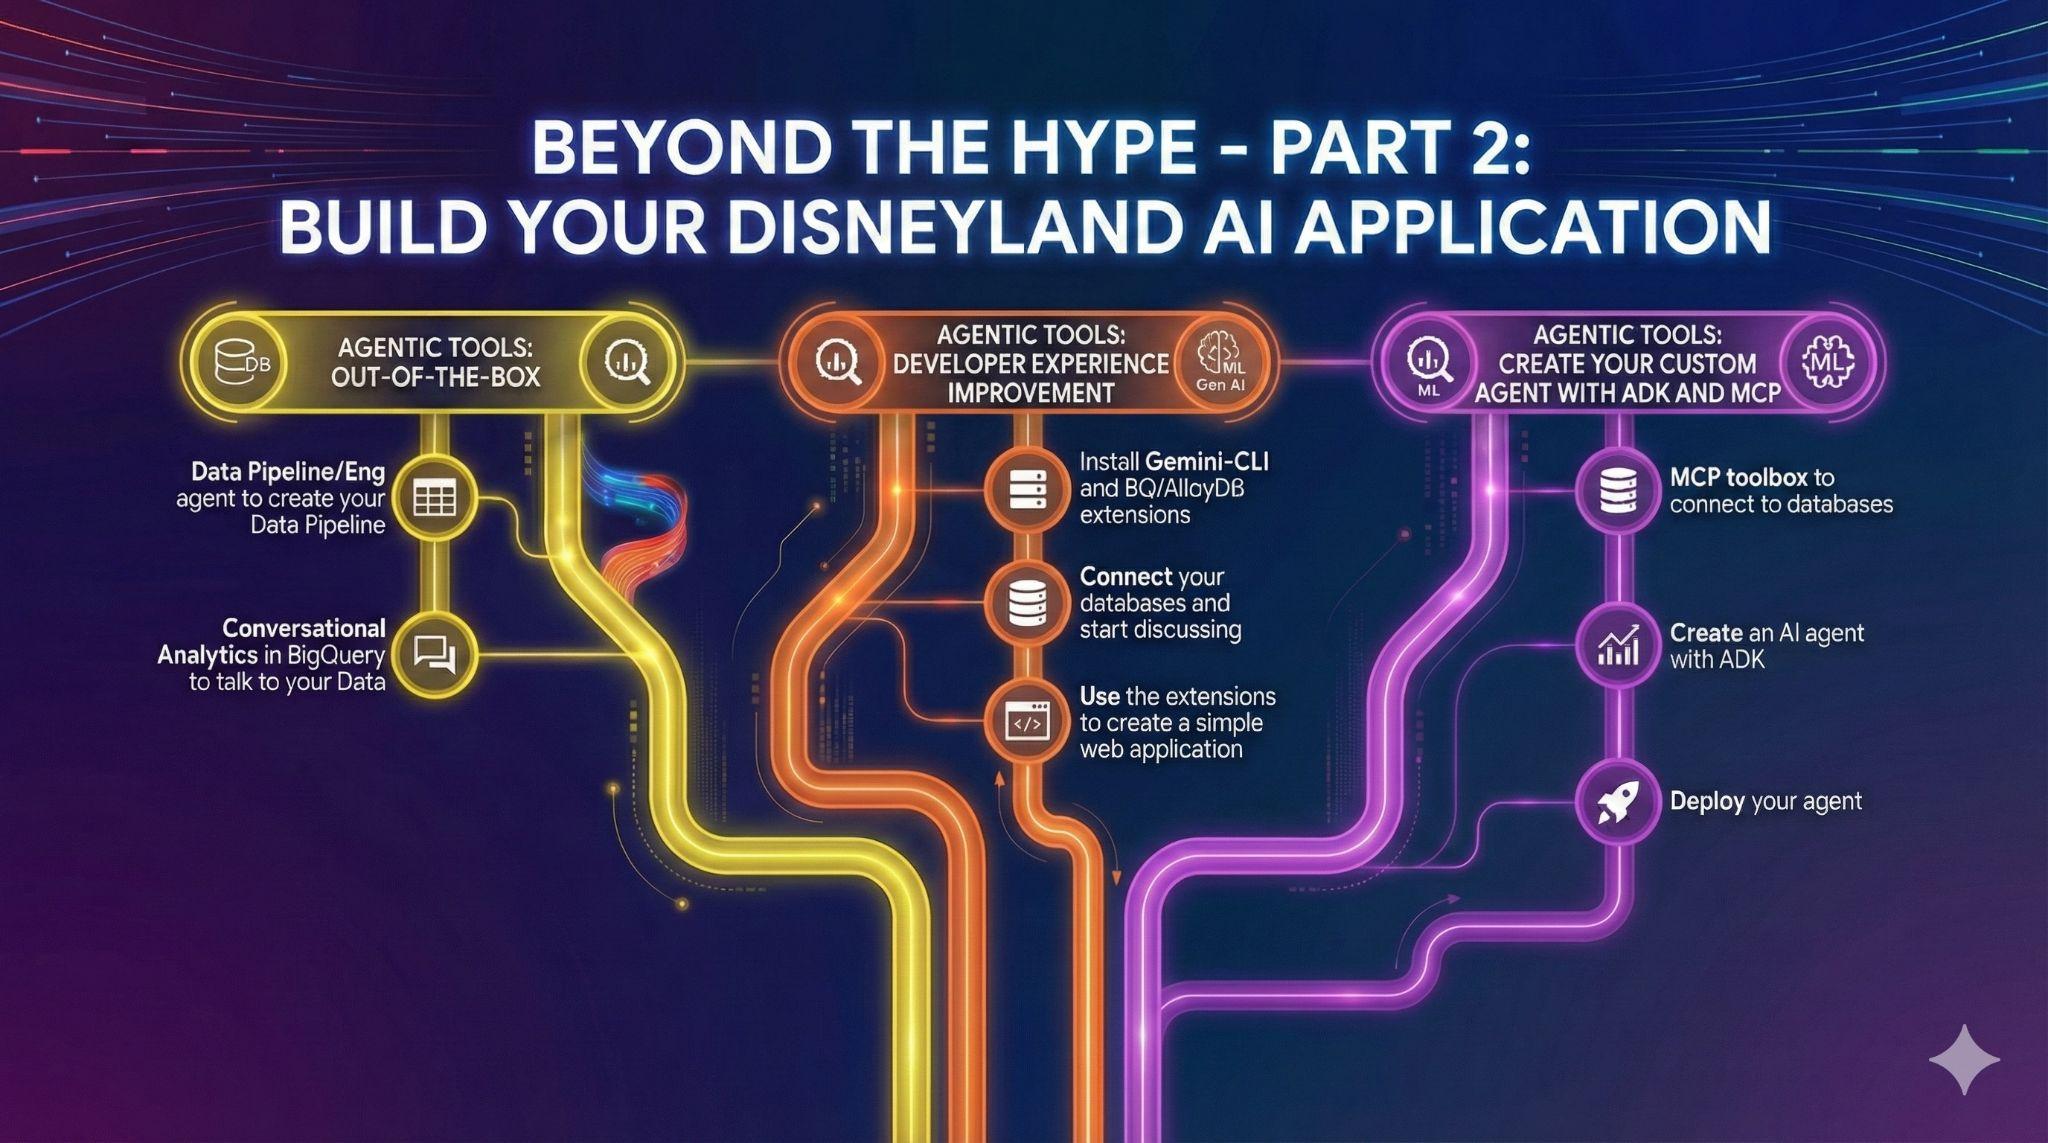
8. Task 5: Improve your development experience with Gemini-CLI
In this AI era, building software has never been more accessible. You have thousands of ideas for your Disneyland application, and you want to use your data at its maximum capacity. You want to go further than just talking to the data, now you need action!
To help you in that path, you are gonna need help. And we've got you covered.
Gemini CLI is an open-source AI agent that brings the power of Gemini directly into your terminal. Developers can build powerful applications and thanks to extensions, they can also interact with various MCP (Model Context Protocol) servers.
Amongst those, you can of course find extensions to query your AlloyDB or BigQuery data!
In this task, your goal is to:
- Install Gemini-CLI (in your own terminal or in Cloud Shell)
- Install BigQuery and AlloyDB Gemini-CLI extensions
- Create an environment file that allows Gemini-CLI to connect to your BigQuery and AlloyDB instances
- Ask Gemini-CLI to generate a fancy single HTML page that explains the content of your AlloyDB database
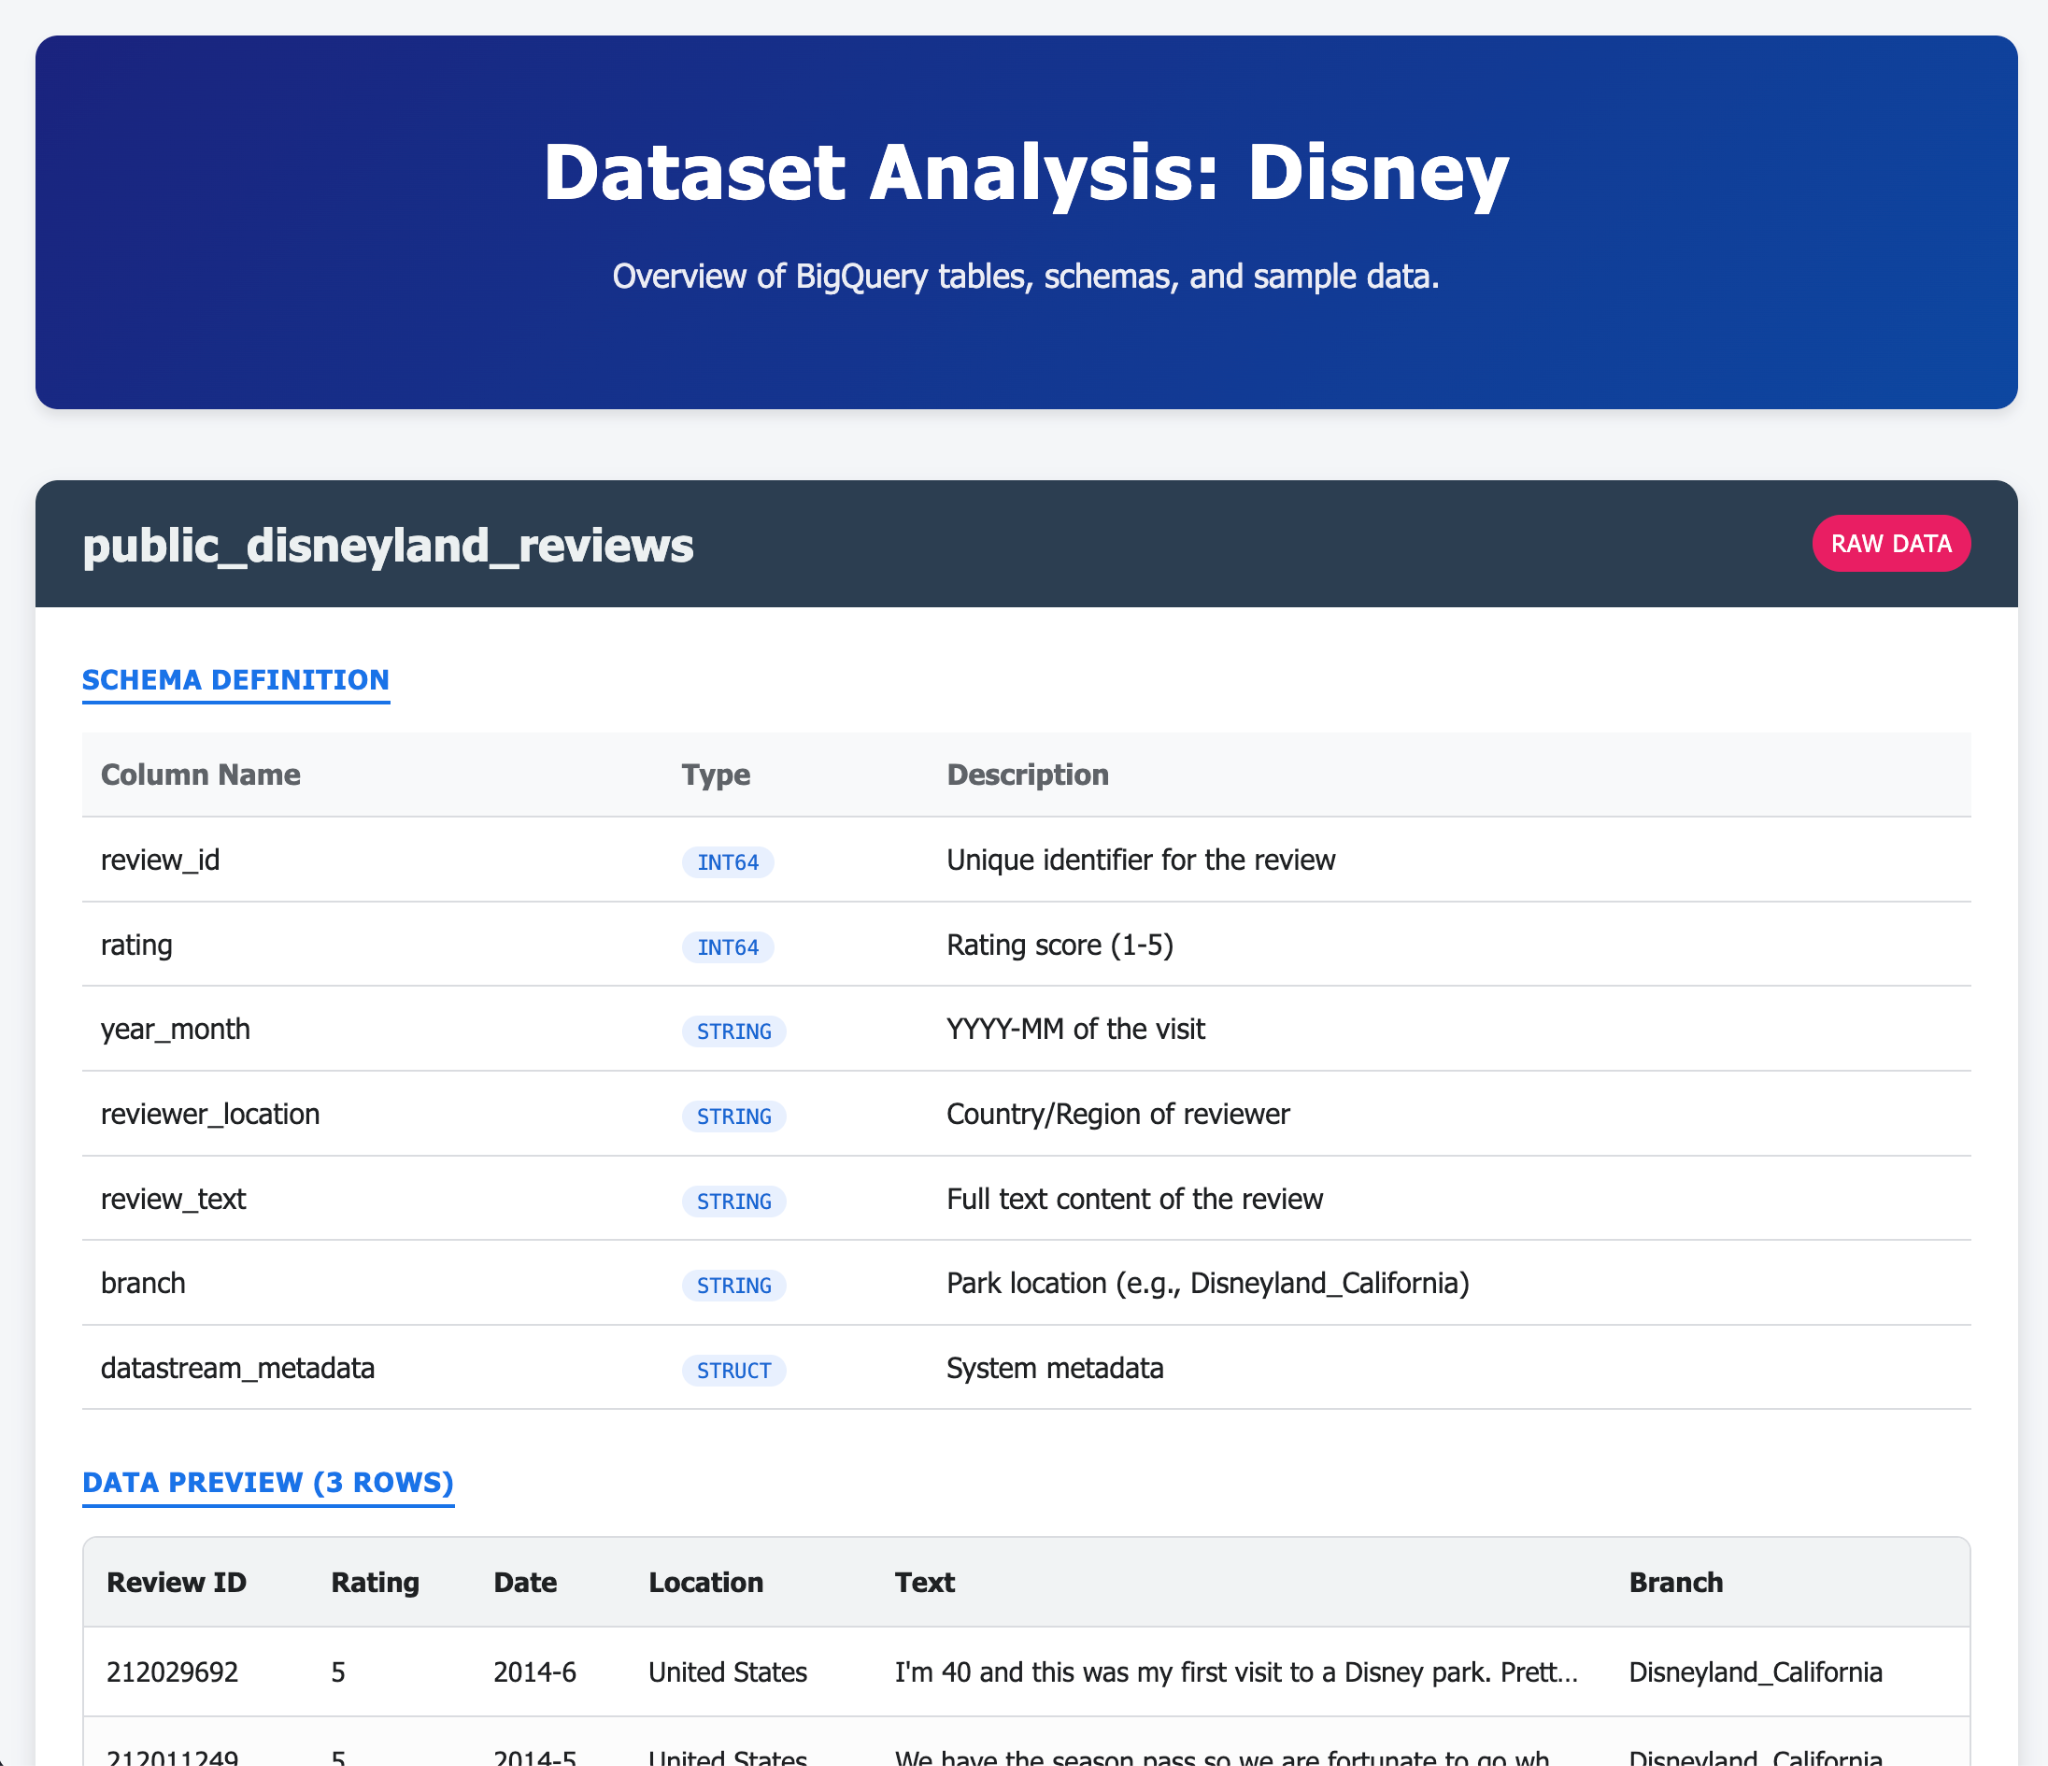
- Do the same for BigQuery
Here are some examples of what you could generate in a single (or few) prompts with Gemini-CLI and its extensions. Now imagine that you could do that with real life applications? 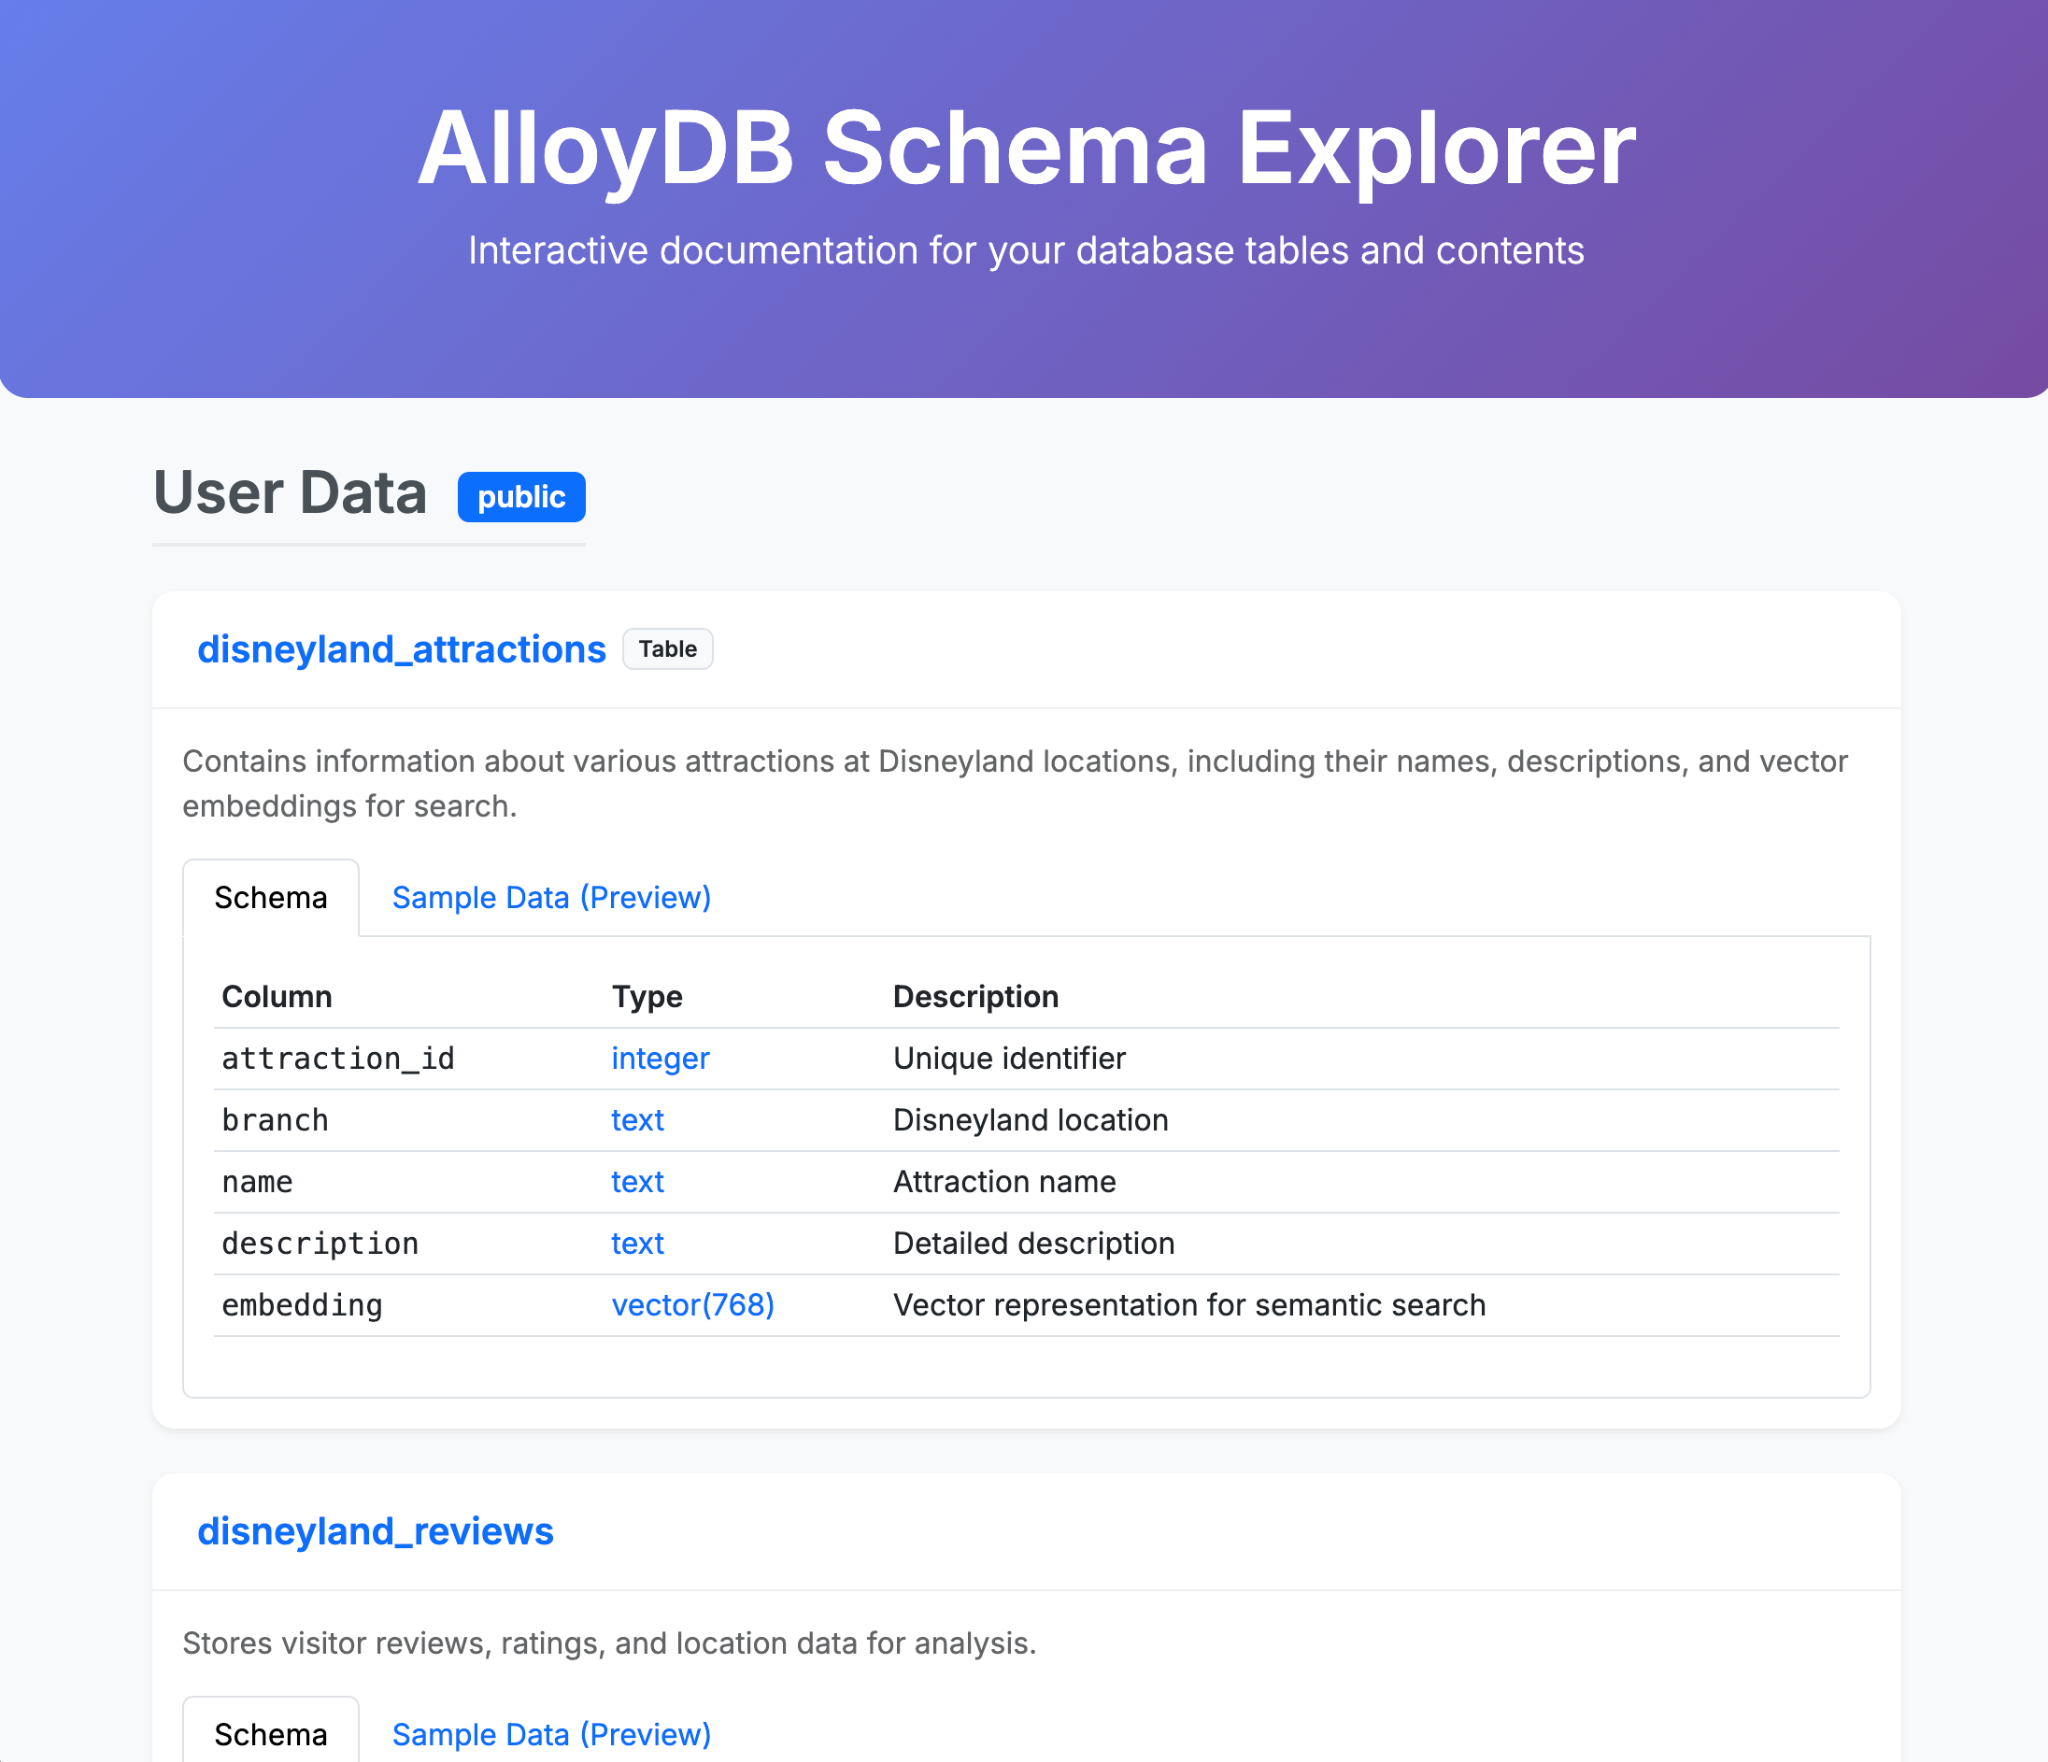
9. Task 6: Create an AI agent to interact with your data
In order to offer a brand new user experience to DisneyLand visitors, you will create an assistant that can help them during their trip. Your agent will be able to:
- List all the available attractions in the parc
- Recommend an attraction based on expectations
- Add reviews for an attraction
- Provide an estimation of the waiting time for an attraction in the next few hours
- Provide an overview of the reviews for a specific attraction
You will make sure that your assistant can only answer questions related to DisneyLand, and it keeps a friendly tone with the user. Tune your agent prompt to make sure the agent picks the right tools for the user's needs.
The steps you need to follow are:
- Deploy an MCP toolbox for databases server that use AlloyDB and BigQuery as sources
- Declare 5 different tools for your MCP server that query AlloyDB and BigQuery and map the agent actions listed earlier
- Use the MCP Toolbox UI to validate each of your tools
- Deploy an agent using Agent Development Kit that can use the tools exposed by your MCP toolbox server
- Connect to your ADK web interface and showcase a full discussion with your assistant, including all the available tools
Bonus step if you finish early:
Your agent is ready? Let's deploy it to Agent Engine !