
1. Introduction
Overview
In this lab, you will learn how to build and deploy a secure code generation agent on Google Kubernetes Engine (GKE). Code generation agents need to execute code that might be untrusted, requiring a secure sandbox environment. You will also learn how to configure the agent with a hybrid model strategy, allowing it to fall back from a self-hosted open model on GKE to Vertex AI's managed Gemini service for increased reliability. Additionally, you will learn how to optimize inference serving using GKE Inference Gateway and Dynamic Resource Allocation (DRA). Finally, you will learn how to leverage Google Cloud Observability to monitor your inference stack using Managed Prometheus.
Architecture
Here is the architecture of the system you will build:
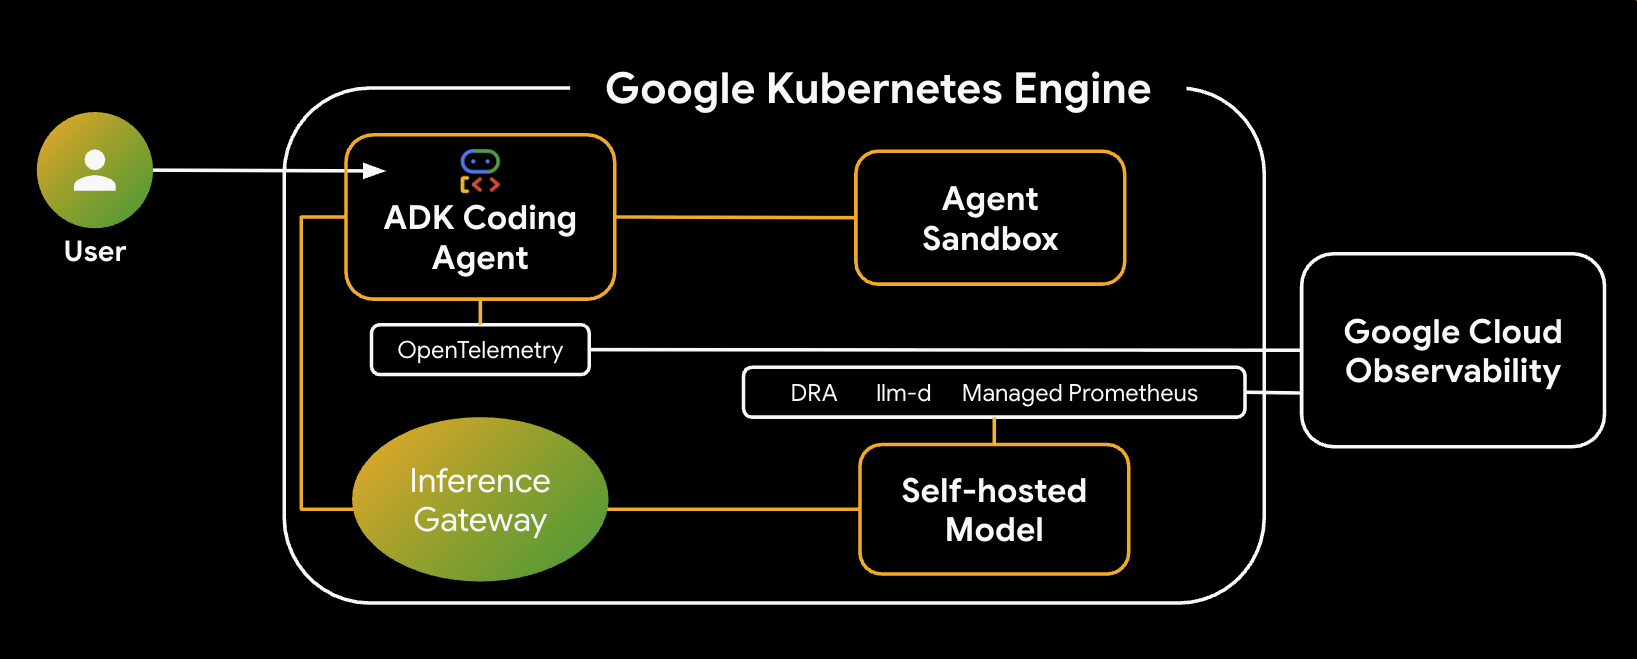
Key Components & Benefits
- Dynamic Resource Allocation (DRA): Used in this lab to dynamically claim and allocate specific GPU resources (NVIDIA L4s) for the model server Pods, ensuring precise hardware targeting for our inference workload. Learn about DRA on GKE.
- llm-d & vLLM: Provides the model serving framework and Helm charts to deploy the Qwen model. In this lab, it handles the inference requests and integrates with DRA for resource management (disaggregated serving is not enabled in this lab). Read the llm-d Guide and check out the llm-d GitHub Repository.
- GKE Inference Gateway: Moves AI-aware routing logic directly into the load balancer. In this lab, it routes requests to maximize prefix-cache hits, reducing Time to First Token (TTFT) latency. Explore Inference Gateway concepts.
- Agent Sandbox (gVisor): Provides secure isolation for executing the code generated by the AI agent. It uses gVisor to provide deep kernel isolation, protecting the host node from untrusted workloads. Learn about Agent Sandbox on GKE and GKE Sandbox Pods.
What you'll do
- Provision Infrastructure: Set up a GKE cluster with Dynamic Resource Allocation (DRA) for GPU management.
- Deploy Inference Stack: Deploy
llm-dand vLLM with intelligent inference scheduling. - Configure Intelligent Routing: Use GKE Inference Gateway for prefix-cache aware routing.
- Secure Code Execution: Deploy Agent Sandbox (gVisor) to safely run AI-generated code.
- Observe and Validate: Use Google Cloud Monitoring and Managed Prometheus to view model serving metrics.
What you'll learn
- How to configure and use Dynamic Resource Allocation (DRA) in GKE.
- How to use GKE Inference Gateway to optimize LLM serving performance.
- How to use Agent Sandbox to execute untrusted code securely on GKE.
- How to use Google Cloud Managed Service for Prometheus to monitor vLLM performance.
2. Setup and Requirements
Project Setup
Create a Google Cloud Project
- In the Google Cloud Console, on the project selector page, select or create a Google Cloud project.
- Make sure that billing is enabled for your Cloud project. Learn how to check if billing is enabled on a project.
Start Cloud Shell
Cloud Shell is a command-line environment running in Google Cloud that comes preloaded with necessary tools.
- Click Activate Cloud Shell at the top of the Google Cloud console.
- Once connected to Cloud Shell, verify your authentication:
gcloud auth list - Confirm your project is configured:
gcloud config get project - If your project is not set as expected, set it:
export PROJECT_ID=<YOUR_PROJECT_ID>
gcloud config set project $PROJECT_ID
3. Provision Infrastructure and Dynamic Resource Allocation (DRA)
In this first step, you will configure your GKE cluster to use modern accelerator allocation (DRA) instead of legacy device plugins. This allows you to flexibly share and allocate GPUs or TPUs for your code generation workloads.
Prerequisites: Your GKE Standard cluster must be running version 1.34 or later to support DRA.
Enable Google Cloud APIs
Enable the Google Cloud APIs required for this codelab, specifically the Compute Engine and Kubernetes Engine APIs.
gcloud services enable compute.googleapis.com container.googleapis.com networkservices.googleapis.com cloudbuild.googleapis.com artifactregistry.googleapis.com telemetry.googleapis.com cloudtrace.googleapis.com aiplatform.googleapis.com
Set Environment Variables
To make the setup easier, define your environment variables. You can adjust the region or naming conventions as needed.
export PROJECT_ID=$(gcloud config get-value project)
export ZONE=us-central1-a
export CLUSTER_NAME=ai-agent-cluster
export NODEPOOL_NAME=dra-accelerator-pool

gcloud config set project $PROJECT_ID
gcloud config set compute/region $ZONE
Create Working Directory
Create a dedicated working directory for this lab and navigate into it so your files stay organized:
mkdir -p ~/gke-ai-agent-lab
cd ~/gke-ai-agent-lab
Configure Permissions (Optional)
If you are running in a restricted project or shared environment, ensure your account has the necessary permissions to create clusters and run builds:
export MY_ACCOUNT=$(gcloud config get-value account)

# Grant Container Admin to create clusters and manage nodes if needed
gcloud projects add-iam-policy-binding $PROJECT_ID \
    --member="user:$MY_ACCOUNT" \
    --role="roles/container.admin"

# Grant Cloud Build Builder to run builds
gcloud projects add-iam-policy-binding $PROJECT_ID \
    --member="user:$MY_ACCOUNT" \
    --role="roles/cloudbuild.builds.builder"
Create the GKE Cluster
Your GKE Standard cluster must be running version 1.34 or later to support DRA. You also need to enable the Gateway API controllers to support intelligent inference scheduling.
You will create a new VPC network and subnets for this lab.
First, create the VPC network:
gcloud compute networks create ai-agent-network --subnet-mode=custom
Next, create a subnet for your GKE nodes:
gcloud compute networks subnets create ai-agent-subnet \
    --network=ai-agent-network \
    --range=10.0.0.0/20 \
    --region=us-central1
The Gateway API (gke-l7-regional-internal-managed) also requires a dedicated subnet to host the Envoy proxies. Create this proxy-only subnet in your new network:
gcloud compute networks subnets create proxy-only-subnet \
  --purpose=REGIONAL_MANAGED_PROXY \
  --role=ACTIVE \
  --region=us-central1 \
  --network=ai-agent-network \
  --range=192.168.10.0/24
Now, create the cluster using the new network and subnet:
gcloud beta container clusters create $CLUSTER_NAME \
    --zone $ZONE \
    --num-nodes 1 \
    --machine-type n2-standard-4 \
    --workload-pool=${PROJECT_ID}.svc.id.goog \
    --gateway-api=standard \
    --managed-otel-scope=COLLECTION_AND_INSTRUMENTATION_COMPONENTS \
    --network=ai-agent-network \
    --subnetwork=ai-agent-subnet
Create a Node Pool with Default Plugins Disabled
To hand over device management to DRA, you must create a node pool that explicitly disables the default GPU driver installation and the standard device plugin.
Run the following gcloud command to provision a GPU node pool (e.g., using NVIDIA L4s) with the necessary DRA labels:
gcloud container node-pools create $NODEPOOL_NAME \
    --cluster=$CLUSTER_NAME \
    --location=$ZONE \
    --machine-type=g2-standard-24 \
    --accelerator=type=nvidia-l4,count=2,gpu-driver-version=disabled \
    --node-labels=gke-no-default-nvidia-gpu-device-plugin=true,nvidia.com/gpu.present=true \
    --num-nodes 3
Install NVIDIA Drivers via DaemonSet
Manually install the required base NVIDIA device drivers onto your nodes using a preconfigured Google Cloud DaemonSet:
kubectl apply -f https://raw.githubusercontent.com/GoogleCloudPlatform/container-engine-accelerators/master/nvidia-driver-installer/cos/daemonset-preloaded.yaml
Install the DRA Driver
Next, install the specific DRA driver into your cluster. For NVIDIA GPUs, you can deploy this via Helm:
helm repo add nvidia https://helm.ngc.nvidia.com/nvidia
helm repo update
helm install nvidia-dra-driver-gpu nvidia/nvidia-dra-driver-gpu \
    --version="25.3.2" --create-namespace --namespace=nvidia-dra-driver-gpu \
    --set nvidiaDriverRoot="/home/kubernetes/bin/nvidia/" \
    --set gpuResourcesEnabledOverride=true \
    --set resources.computeDomains.enabled=false \
    --set kubeletPlugin.priorityClassName="" \
    --set 'kubeletPlugin.tolerations[0].key=nvidia.com/gpu' \
    --set 'kubeletPlugin.tolerations[0].operator=Exists' \
    --set 'kubeletPlugin.tolerations[0].effect=NoSchedule'
Understanding DeviceClasses
You do not need to manually write or apply a DeviceClass YAML. When you set up your GKE infrastructure for DRA and install the driver, the DRA drivers running on your nodes automatically create the DeviceClass objects in the cluster for you.
Configure the ResourceClaimTemplate
To allow your llm-d Pods to dynamically request these accelerators, you will create a ResourceClaimTemplate. This template defines the requested device configuration and tells Kubernetes to automatically create a unique, per-Pod ResourceClaim for your workloads.
Run the following command to create claim-template.yaml:
cat > claim-template.yaml <<EOF
apiVersion: resource.k8s.io/v1
kind: ResourceClaimTemplate
metadata:
  name: gpu-claim-template
spec:
  spec:
    devices:
      requests:
      - name: single-gpu
        exactly:
          deviceClassName: gpu.nvidia.com
          allocationMode: ExactCount
          count: 1
EOF
Apply the template to your cluster:
kubectl apply -f claim-template.yaml
4. Deploy Intelligent Inference Scheduling with llm-d and DRA
In this step, you will deploy your Large Language Model behind a smart Envoy load balancer enhanced with an inference scheduler. This configuration optimizes model serving by applying Prefix-Cache Aware Routing. GKE Inference Gateway recognizes shared context across microservices and intelligently routes requests to the same model replica, maximizing cache hits, reducing Time-to-First-Token, and driving superior performance-per-dollar.
Prepare the Environment
Set up your target namespace.
export NAMESPACE=ai-agents
kubectl create namespace $NAMESPACE
Securely store your Hugging Face token, which is required to pull the model weights.
# Replace with your actual Hugging Face token
kubectl create secret generic llm-d-hf-token \
  --from-literal=HF_TOKEN="your_hugging_face_token" \
  -n $NAMESPACE
Create the Helm Configuration Files
The configurations for the model service and the inference gateway extension are based on the official llm-d guides.
First, create the ms-values.yaml file for the model service:
cat <<EOF > ms-values.yaml
multinode: false

modelArtifacts:
  uri: "hf://Qwen/Qwen2.5-Coder-14B-Instruct"
  name: "Qwen/Qwen2.5-Coder-14B-Instruct"
  size: 50Gi   # Slightly larger than the default to accommodate weights
  authSecretName: "llm-d-hf-token"
  labels:
    llm-d.ai/inference-serving: "true"
    llm-d.ai/guide: "inference-scheduling"
    llm-d.ai/accelerator-variant: "gpu"
    llm-d.ai/accelerator-vendor: "nvidia"
    llm-d.ai/model: "qwen-2-5-coder-14b"

routing:
  proxy:
    enabled: false  # removes sidecar from deployment - no PD in inference scheduling
    targetPort: 8000  # controls vLLM port to matchup with sidecar if deployed

accelerator:
  dra: true
  type: "nvidia"
  resourceClaimTemplates:
    nvidia:
      class: "gpu.nvidia.com"
      match: "exactly"
      name: "gpu-claim-template"

decode:
  create: true
  tolerations:
    - key: "nvidia.com/gpu"
      operator: "Exists"
      effect: "NoSchedule"
  parallelism:
    tensor: 2
    data: 1
  replicas: 3
  monitoring:
    podmonitor:
      enabled: true
      portName: "vllm"
      path: "/metrics"
      interval: "30s"
  containers:
    - name: "vllm"
      image: ghcr.io/llm-d/llm-d-cuda:v0.5.1
      modelCommand: vllmServe
      args:
        - "--disable-uvicorn-access-log"
        - "--gpu-memory-utilization=0.85"
        - "--enable-auto-tool-choice"
        - "--tool-call-parser"
        - "hermes"
      ports:
        - containerPort: 8000
          name: vllm
          protocol: TCP
      resources:
        limits:
          cpu: '16'
          memory: 64Gi
        requests:
          cpu: '16'
          memory: 64Gi
      mountModelVolume: true
      volumeMounts:
        - name: metrics-volume
          mountPath: /.config
        - name: shm
          mountPath: /dev/shm
        - name: torch-compile-cache
          mountPath: /.cache
      startupProbe:
        httpGet:
          path: /v1/models
          port: vllm
        initialDelaySeconds: 15
        periodSeconds: 30
        timeoutSeconds: 5
        failureThreshold: 120
      livenessProbe:
        httpGet:
          path: /health
          port: vllm
        periodSeconds: 10
        timeoutSeconds: 5
        failureThreshold: 3
      readinessProbe:
        httpGet:
          path: /v1/models
          port: vllm
        periodSeconds: 5
        timeoutSeconds: 2
        failureThreshold: 3
  volumes:
    - name: metrics-volume
      emptyDir: {}
    - name: torch-compile-cache
      emptyDir: {}
    - name: shm
      emptyDir:
        medium: Memory
        sizeLimit: 20Gi
prefill:
  create: false
EOF
Next, create the gaie-values.yaml file for the GKE Inference Gateway Extension:
cat <<EOF > gaie-values.yaml
inferenceExtension:
  replicas: 1
  image:
    name: llm-d-inference-scheduler
    hub: ghcr.io/llm-d
    tag: v0.6.0
    pullPolicy: Always
  extProcPort: 9002
  pluginsConfigFile: "default-plugins.yaml"
  tracing:
    enabled: false
  monitoring:
    interval: "10s"
    prometheus:
      enabled: true
      auth:
        secretName: inference-scheduling-gateway-sa-metrics-reader-secret
inferencePool:
  targetPorts:
    - number: 8000
  modelServerType: vllm
  modelServers:
    matchLabels:
      llm-d.ai/inference-serving: "true"
      llm-d.ai/guide: "inference-scheduling"
EOF
Understanding the Configuration
This configuration sets up a high-performance inference stack with the following key features:
- Model Selection: It uses the Qwen 2.5 Coder 14B model (
modelArtifacts), which is optimized for code generation and tool use. - DRA Integration: The
acceleratorsection enables Dynamic Resource Allocation (dra: true), targeting thegpu.nvidia.comdevice class and our previously createdgpu-claim-template. - Performance Optimization:
parallelism.tensor: 2configures tensor parallelism across the GPUs.argsfor vLLM includes--enable-auto-tool-choiceto ensure our coding agent can use tools effectively.- Reduced
cpuandmemoryrequests fit theg2-standard-24machine type.
- Intelligent Routing: The Inference Gateway extension (
gaie-values.yaml) is configured to monitor thevllmmodel servers and route requests to maximize KV-cache hits.
Deploy the Inference Scheduling Stack via Helm
Now, add the llm-d Helm repositories and deploy the infrastructure, gateway extension, and model service individually.
First, add the required repositories:
helm repo add llm-d-infra https://llm-d-incubation.github.io/llm-d-infra/
helm repo add llm-d-modelservice https://llm-d-incubation.github.io/llm-d-modelservice/
helm repo update
Deploy the Infrastructure Prerequisites
This chart installs the baseline Gateway configurations required for the stack.
helm install infra-is llm-d-infra/llm-d-infra \
  --namespace $NAMESPACE \
  --set gateway.gatewayClassName=gke-l7-rilb \
  --set gateway.gatewayParameters.enabled=false \
  --set gateway.gatewayParameters.istio.accessLogging=false
Deploy the GKE Inference Gateway Extension
This step deploys the InferencePool and Endpoint Picker, which monitors the KV-cache of your models to make intelligent routing decisions.
helm install gaie-is oci://registry.k8s.io/gateway-api-inference-extension/charts/inferencepool \
  --version v1.3.1 \
  --namespace $NAMESPACE \
  -f gaie-values.yaml \
  --set provider.name=gke \
  --set inferenceExtension.monitoring.prometheus.enabled=true
Deploy the Model Service
Finally, deploy your LLM service, which will now use DRA to securely claim your L4 GPUs.
helm install ms-is llm-d-modelservice/llm-d-modelservice \
  --version v0.4.7 \
  --namespace $NAMESPACE \
  -f ms-values.yaml \
  --set decode.monitoring.podmonitor.enabled=false
Enable Google Cloud Observability for vLLM
Generic Helm charts often attempt to deploy standard Prometheus Operator PodMonitor resources (monitoring.coreos.com/v1), which can cause errors if you don't have those CRDs installed.
Instead of toggling Helm's built-in monitoring toggle, keep it false and manually apply a Google Cloud Managed Prometheus (GMP) PodMonitoring resource using the compatible monitoring.googleapis.com/v1 API group.
Run the following command to create podmonitoring.yaml:
cat > podmonitoring.yaml <<EOF
apiVersion: monitoring.googleapis.com/v1
kind: PodMonitoring
metadata:
  name: ms-vllm-metrics
spec:
  selector:
    matchLabels:
      llm-d.ai/model: "qwen-2-5-coder-14b" # Matches the label in values.yaml
  endpoints:
  - port: 8000 # vllm port
    interval: 30s
    path: /metrics
EOF
Apply the PodMonitoring resource to your cluster:
kubectl apply -f podmonitoring.yaml -n $NAMESPACE
Verify the Installation
Verify that the components have been installed successfully. You should see all three Helm releases active in your namespace and the corresponding pods initializing.
helm ls -n $NAMESPACE
kubectl get pods -n $NAMESPACE
The ms-is pods can take about 5-10 minutes to come up. When they do, output should look something like:
NAME            NAMESPACE       REVISION        UPDATED                                 STATUS          CHART                           APP VERSION
gaie-is         ai-agents       1               2026-03-28 16:51:41.055881618 +0000 UTC deployed        inferencepool-v1.3.1            v1.3.1
infra-is        ai-agents       1               2026-03-28 16:51:03.71042542 +0000 UTC  deployed        llm-d-infra-v1.4.0              v0.4.0
ms-is           ai-agents       1               2026-03-28 17:30:00.341918958 +0000 UTC deployed        llm-d-modelservice-v0.4.7       v0.4.0
NAME                                               READY   STATUS    RESTARTS   AGE
gaie-is-epp-848965cb4-78ktp                        1/1     Running   0          10m
ms-is-llm-d-modelservice-decode-67548d5f8c-f25f4   1/1     Running   0          6m2s
ms-is-llm-d-modelservice-decode-67548d5f8c-rblvs   1/1     Running   0          6m2s
ms-is-llm-d-modelservice-decode-67548d5f8c-w6fcd   1/1     Running   0          6m2s
5. Configure Intelligent Routing with GKE Inference Gateway
In Step 4, deploying the llm-d Helm charts automatically provisioned your Gateway and InferencePool objects. The InferencePool groups your vllm model serving Pods that share the same base model and compute configuration.
Now, you need to configure an InferenceObjective to set the priority of your coding agent requests and an HTTPRoute to instruct the Gateway on how to route incoming traffic, leveraging the Endpoint Picker to maximize KV-cache hits.
Verify Auto-Generated Resources
First, verify that the llm-d Helm charts successfully created the Gateway and InferencePool resources.
kubectl get gateway,inferencepool -n $NAMESPACE
You should see a Gateway named infra-is-inference-gateway and an InferencePool named gaie-is. Similar to this:
NAME                                                           CLASS                              ADDRESS        PROGRAMMED   AGE
gateway.gateway.networking.k8s.io/infra-is-inference-gateway   gke-l7-regional-internal-managed   10.128.0.5   True         13m

NAME                                                AGE
inferencepool.inference.networking.k8s.io/gaie-is   12m
Create the HTTPRoute
The HTTPRoute resource maps your Gateway to the backend InferencePool. This tells the GKE Inference Gateway to analyze incoming request bodies and route them dynamically to maximize Prefix-Cache hits based on shared context.
Run the following command to create httproute.yaml:
cat > httproute.yaml <<EOF
apiVersion: gateway.networking.k8s.io/v1
kind: HTTPRoute
metadata:
  name: agent-route
spec:
  parentRefs:
  - group: gateway.networking.k8s.io
    kind: Gateway
    name: infra-is-inference-gateway
  rules:
  - backendRefs:
    - group: inference.networking.k8s.io
      kind: InferencePool
      name: gaie-is
      weight: 1
    matches:
    - path:
        type: PathPrefix
        value: /
EOF
Apply the route to your cluster:
kubectl apply -f httproute.yaml -n $NAMESPACE
6. Secure Code Execution with Agent Sandbox
Now that our high-performance inference backend is running, let's prepare the secure environment where the AI-generated code will actually execute safely isolated from our cluster using an Agent Sandbox.
Deploy the Agent Sandbox Controller
When an AI agent generates and executes code, it is essentially running an untrusted workload on your infrastructure. If the agent generates malicious code, it could attempt to scan your internal network or exploit the underlying host node.
GKE Agent Sandbox utilizes gVisor, an open-source container runtime that provides a specialized guest kernel for each container. This prevents untrusted code from making direct system calls to the host node.
Deploy the Agent Sandbox controller and its required components by applying the official release manifests:
kubectl apply \
  -f https://github.com/kubernetes-sigs/agent-sandbox/releases/download/v0.1.0/manifest.yaml \
  -f https://github.com/kubernetes-sigs/agent-sandbox/releases/download/v0.1.0/extensions.yaml
Configure the Sandbox Template and Warm Pool
Next, we establish a SandboxTemplate acting as a reusable blueprint for our Python analysis environments, explicitly targeting the gvisor runtime class. To simplify deployment without managing manual node pools on Standard clusters, we can leverage any standard autopilot
ComputeClass to dynamically provision managed compute nodes that natively support gVisor workloads on demand!
Because initializing a secure kernel can add latency, we also deploy a SandboxWarmPool. This ensures a specified number of pre-initialized sandboxes are kept ready so the Code Generation Agent can claim them and begin executing code in under a second.
First, create a new namespace for the agent sandbox runtimes:
kubectl create namespace agent-sandbox
Save the following as sandbox-template-and-pool.yaml:
cat > sandbox-template-and-pool.yaml <<EOF
apiVersion: extensions.agents.x-k8s.io/v1alpha1
kind: SandboxTemplate
metadata:
  name: python-runtime-template
  namespace: agent-sandbox
spec:
  podTemplate:
    metadata:
      labels:
        sandbox: python-sandbox-example
    spec:
      runtimeClassName: gvisor
      nodeSelector:
        cloud.google.com/compute-class: autopilot
      containers:
      - name: python-runtime
        image: registry.k8s.io/agent-sandbox/python-runtime-sandbox:v0.1.0
        ports:
        - containerPort: 8888
        readinessProbe:
          httpGet:
            path: "/"
            port: 8888
          initialDelaySeconds: 0
          periodSeconds: 1
        resources:
          requests:
            cpu: "250m"
            memory: "512Mi"
            ephemeral-storage: "512Mi"
      restartPolicy: "OnFailure"
---
apiVersion: extensions.agents.x-k8s.io/v1alpha1
kind: SandboxWarmPool
metadata:
  name: python-sandbox-warmpool
  namespace: agent-sandbox
spec:
  replicas: 2
  sandboxTemplateRef:
    name: python-runtime-template
EOF
Apply the configuration:
kubectl apply -f sandbox-template-and-pool.yaml
Wait up to 2-3 minutes for the warmpool pods to initialize. You can check that they successfully transition from Pending (while the underlying compute scales up) to Running using:
kubectl get pods -n agent-sandbox -w
Once you see two python-sandbox-warmpool-*** pods listed as Running and 1/1 Ready, your safe execution environments are pre-warmed and ready to claim!
Deploy the Sandbox Router
Our Code Generation Agent relies on a Sandbox Router to securely dispatch execution commands to the isolated pods.
Run the following command to create sandbox-router.yaml:
cat > sandbox-router.yaml <<EOF
apiVersion: v1
kind: Service
metadata:
  name: sandbox-router-svc
  namespace: agent-sandbox
spec:
  type: ClusterIP
  selector:
    app: sandbox-router
  ports:
  - name: http
    protocol: TCP
    port: 8080
    targetPort: 8080
---
apiVersion: apps/v1
kind: Deployment
metadata:
  name: sandbox-router-deployment
  namespace: agent-sandbox
spec:
  replicas: 2
  selector:
    matchLabels:
      app: sandbox-router
  template:
    metadata:
      labels:
        app: sandbox-router
    spec:
      topologySpreadConstraints:
        - maxSkew: 1
          topologyKey: topology.kubernetes.io/zone
          whenUnsatisfiable: ScheduleAnyway
          labelSelector:
            matchLabels:
              app: sandbox-router
      containers:
      - name: router
        image: us-central1-docker.pkg.dev/k8s-staging-images/agent-sandbox/sandbox-router:v20260225-v0.1.1.post3-10-ga5bcb57
        ports:
        - containerPort: 8080
        readinessProbe:
          httpGet:
            path: /healthz
            port: 8080
          initialDelaySeconds: 5
          periodSeconds: 5
        livenessProbe:
          httpGet:
            path: /healthz
            port: 8080
          initialDelaySeconds: 10
          periodSeconds: 10
        resources:
          requests:
            cpu: "250m"
            memory: "512Mi"
          limits:
            cpu: "1000m"
            memory: "1Gi"
      securityContext:
        runAsUser: 1000
        runAsGroup: 1000
EOF
Apply the configuration:
kubectl apply -f sandbox-router.yaml
Implement Network Isolation
To further lock down the execution environment and prevent any unauthorized lateral movement, apply a Network Policy. This "air-gaps" the sandbox so it cannot reach the Google Cloud Metadata Server or other sensitive internal networks.
Save the following as sandbox-policy.yaml:
cat > sandbox-policy.yaml <<EOF
apiVersion: networking.k8s.io/v1
kind: NetworkPolicy
metadata:
  name: restrict-sandbox-egress
  namespace: agent-sandbox
spec:
  podSelector:
    matchLabels:
      sandbox: python-sandbox-example
  policyTypes:
  - Egress
  egress:
  - to:
    - ipBlock:
        cidr: 0.0.0.0/0
        except:
        - 169.254.169.254/32 # Block metadata server
EOF
Apply the policy:
kubectl apply -f sandbox-policy.yaml
Verify Components
To ensure your isolated code sandbox cluster layer is fully configured, execute the following state validation commands:
First, Verify sandbox pods and routers are Running and Ready
kubectl get pods -n agent-sandbox
The output should look something like:
NAME                                         READY   STATUS    RESTARTS   AGE
python-sandbox-warmpool-7zlkv                1/1     Running   0          3m25s
python-sandbox-warmpool-cxln2                1/1     Running   0          3m25s
sandbox-router-deployment-668dfbbbb6-g9mpd   1/1     Running   0          42s
sandbox-router-deployment-668dfbbbb6-ppllz   1/1     Running   0          42s
Verify Sandbox Router Load balancer / IP exposure
kubectl get service sandbox-router-svc -n agent-sandbox
Output should look like:
NAME                 TYPE        CLUSTER-IP       EXTERNAL-IP   PORT(S)    AGE
sandbox-router-svc   ClusterIP   34.118.237.244   <none>        8080/TCP   114s
Verify that the egress network policy rule exists
kubectl get networkpolicy restrict-sandbox-egress -n agent-sandbox
Output should look like:
NAME                      POD-SELECTOR                     AGE
restrict-sandbox-egress   sandbox=python-sandbox-example   113s
Make sure that:
- The
python-sandbox-warmpool-***pods areRunningand1/1Ready. - The
sandbox-router-deployment-***replicas areRunningand1/1Ready. - The
sandbox-router-svcis accessible, and therestrict-sandbox-egresspolicy is successfully protecting any matching sandbox labels.
With our safe execution environment secured and initialized, we are ready to deploy the actual brain of our operation: the Code Generation Agent!
7. Build and Deploy the Code Generation Agent (ADK)
With our safe execution sandbox and our high-performance LLM backend both configured, we can now build the "brain" of our system: a Code Generation Agent using the Agent Development Kit (ADK).
This agent is designed to act as an expert Python developer. Unlike a standard chatbot that only produces text, this agent is equipped with a code execution tool that allows it to interactively solve problems. It follows a loop of:
- Writing Python code based on your requests.
- Executing the code securely inside the GKE Agent Sandbox we set up in Step 6.
- Verifying the output or reading any errors that arise during execution.
- Delivering a tested, working solution with confidence.
By giving the agent access to a secure sandbox execution environment, we enable it to verify its own logic and debug failures automatically, making it substantially more capable of software development tasks!
Develop the ADK Reasoning Agent
First, we write the Python logic that defines the agent's behavior and equips it with the Sandbox tool we created in Step 6. In this section, we also configure a hybrid model strategy: the agent will prioritize a self-hosted Qwen model running on your GKE cluster, but will automatically fall back to Gemini 2.5 Flash on Vertex AI if the local model is slow or unavailable, ensuring high reliability.
Create a new directory for the agent code:
mkdir -p ~/gke-ai-agent-lab/root_agent
cd ~/gke-ai-agent-lab
Create a file named root_agent/agent.py with the following content:
cat <<'EOF' > root_agent/agent.py
import os
from google.adk.agents import Agent
from google.adk.models.lite_llm import LiteLlm
from k8s_agent_sandbox import SandboxClient
import requests

# Instantiate the client globally to track sandboxes
sandbox_client = SandboxClient()

def run_python_code(code: str) -> str:
    """
    Executes Python code safely in the GKE Agent Sandbox.
    Use this tool whenever you need to execute code to solve a problem.
    """
    sandbox = sandbox_client.create_sandbox(template="python-runtime-template", namespace="agent-sandbox")
    try:
        command = f"python3 -c \"{code}\""
        result = sandbox.commands.run(command)
        if result.stderr:
            return f"Error: {result.stderr}"
        return result.stdout
    finally:
        # Ensure the sandbox is deleted after use to avoid leaking resources
        sandbox_client.delete_sandbox(sandbox.claim_name, namespace="agent-sandbox")

# Define the ADK Agent with a fallback mechanism.
# It prioritizes the Qwen 2.5 Coder model running on our Inference Gateway.
# If the local model is unavailable, it falls back to Gemini 2.5 Flash on Vertex AI.
root_agent = Agent(
    name="CodeGenerationAgent",
    model=LiteLlm(
        model="openai/Qwen/Qwen2.5-Coder-14B-Instruct",
        fallbacks=["vertex_ai/gemini-2.5-flash"],
        timeout=10
    ),
    instruction="""
    You are an expert Python developer.
    1. Write Python code to solve the user's problem.
    2. Execute the code using the `run_python_code` tool to verify it works.
    3. Return the exact output and a brief explanation of the code.
    """,
    tools=[run_python_code]
)
EOF
Create an __init__.py file so ADK recognizes the module:
echo "from . import agent" > ~/gke-ai-agent-lab/root_agent/__init__.py
Set the environment variables. The ADK application needs the IP address of your Gateway to route the LLM requests successfully. Because ADK supports standard Open-AI compatible endpoints (which vLLM provides via our Gateway), we can override the default API base URL!
export GATEWAY_IP=$(kubectl get gateway infra-is-inference-gateway -n $NAMESPACE -o jsonpath='{.status.addresses[0].value}')

cat <<EOF > ~/gke-ai-agent-lab/root_agent/.env
OPENAI_API_BASE=http://${GATEWAY_IP}/v1
OPENAI_API_KEY=no-key-required
# Vertex AI settings for fallback (Authentication is handled by Workload Identity)
VERTEXAI_PROJECT=$PROJECT_ID
VERTEXAI_LOCATION=${ZONE%-[a-z]}
EOF
Containerize the Agent Application
We need to package the agent so it can run securely inside GKE.
Create a Dockerfile in ~/gke-ai-agent-lab that installs kubectl, the ADK library, and the Agent Sandbox client:
cat <<'EOF' > ~/gke-ai-agent-lab/Dockerfile
FROM python:3.11-slim

ENV PYTHONDONTWRITEBYTECODE=1
ENV PYTHONUNBUFFERED=1

WORKDIR /app

RUN apt-get update && apt-get install -y git curl \
    && curl -LO "https://dl.k8s.io/release/$(curl -L -s https://dl.k8s.io/release/stable.txt)/bin/linux/amd64/kubectl" \
    && install -o root -g root -m 0755 kubectl /usr/local/bin/kubectl \
    && rm kubectl && apt-get clean && rm -rf /var/lib/apt/lists/*

RUN pip install --no-cache-dir "google-adk[extensions,otel-gcp]>=1.27.4" litellm pandas "git+https://github.com/kubernetes-sigs/agent-sandbox.git@main#subdirectory=clients/python/agentic-sandbox-client" \
    "opentelemetry-instrumentation-google-genai>=0.4b0" \
    "opentelemetry-exporter-otlp" \
    "opentelemetry-instrumentation-vertexai>=2.0b0"

COPY ./root_agent /app/root_agent

EXPOSE 8080

ENTRYPOINT ["adk", "web", "--host", "0.0.0.0", "--port", "8080", "--otel_to_cloud"]
EOF
Create an Artifact Registry repository to store the container image.
gcloud artifacts repositories create agent-repo \
    --repository-format=docker \
    --location=us-central1
Use Cloud Build to build and push the container image.
gcloud builds submit --tag us-central1-docker.pkg.dev/$PROJECT_ID/agent-repo/code-agent:v1 ~/gke-ai-agent-lab/
Deploy to GKE with RBAC
Finally, deploy the agent to your cluster. The deployment includes a Role and RoleBinding granting the agent permission to claim instances from the SandboxWarmPool.
This deployment will use a Kubernetes ServiceAccount to enable your agent to talk to the Sandbox claim API. It does not require a Google IAM ServiceAccount since it is accessing local cluster resources and a local vLLM gateway endpoint.
Why a standard Deployment in gVisor?
In Step 6, we used SandboxTemplate and SandboxClaim APIs to create ephemeral, throwaway sandboxes for the generated python code (the Tool execution).
For the Agent Web UI (the Brain) itself, we are using standard Kubernetes Deployment specs with runtimeClassName: gvisor.
- The distinction: Standard
SandboxClaimsare ephemeral and zero-to-one (ideal for untrusted scripts). A standardDeploymentis long-running and persistent—perfect for web UIs that need a stable KubernetesServiceand Load Balancer! By usingruntimeClassName: gvisordirectly on a standard Deployment, you get the isolation of the gVisor kernel while retaining standardDeploymentfeatures.
Save the following as deployment.yaml:
cat <<EOF > ~/gke-ai-agent-lab/deployment.yaml
apiVersion: apps/v1
kind: Deployment
metadata:
  name: code-agent
  labels:
    app: code-agent
spec:
  replicas: 1
  selector:
    matchLabels:
      app: code-agent
  template:
    metadata:
      labels:
        app: code-agent
    spec:
      serviceAccount: adk-agent-sa
      runtimeClassName: gvisor
      nodeSelector:
        cloud.google.com/compute-class: autopilot
      containers:
      - name: code-agent
        image: us-central1-docker.pkg.dev/YOUR_PROJECT_ID/agent-repo/code-agent:v1
        imagePullPolicy: Always
        env:
        - name: OPENAI_API_KEY
          value: "no-key-required"
        - name: OPENAI_API_BASE
          value: "http://YOUR_GATEWAY_IP/v1"
        - name: VERTEXAI_PROJECT
          value: "YOUR_PROJECT_ID"
        - name: VERTEXAI_LOCATION
          value: "YOUR_REGION"
        - name: OTEL_SERVICE_NAME
          value: "code-agent"
        - name: GOOGLE_CLOUD_AGENT_ENGINE_ENABLE_TELEMETRY
          value: "true"
        - name: OTEL_INSTRUMENTATION_GENAI_CAPTURE_MESSAGE_CONTENT
          value: "true"
        ports:
        - containerPort: 8080
---
apiVersion: v1
kind: Service
metadata:
  name: code-agent-service
spec:
  selector:
    app: code-agent
  ports:
    - protocol: TCP
      port: 80
      targetPort: 8080
  type: LoadBalancer
---
apiVersion: rbac.authorization.k8s.io/v1
kind: Role
metadata:
  namespace: agent-sandbox
  name: sandbox-creator-role
rules:
- apiGroups: [""]
  resources: ["services", "pods", "pods/portforward"]
  verbs: ["get", "list", "watch", "create"]
- apiGroups: ["extensions.agents.x-k8s.io"]
  resources: ["sandboxclaims"]
  verbs: ["create", "get", "list", "watch", "delete"]
- apiGroups: ["agents.x-k8s.io"]
  resources: ["sandboxes"]
  verbs: ["get", "list", "watch"]
---
apiVersion: rbac.authorization.k8s.io/v1
kind: RoleBinding
metadata:
  name: adk-agent-binding
  namespace: agent-sandbox
subjects:
- kind: ServiceAccount
  name: adk-agent-sa
  namespace: default
roleRef:
  kind: Role
  name: sandbox-creator-role
  apiGroup: rbac.authorization.k8s.io
---
apiVersion: v1
kind: ServiceAccount
metadata:
  name: adk-agent-sa
EOF
Grant IAM Permissions for Observability
To enable the agent to send telemetry data (logs and traces) to Google Cloud, you need to grant the required permissions to the Kubernetes Service Account adk-agent-sa using Workload Identity.
Run the following commands in your Cloud Shell:
PROJECT_NUMBER=$(gcloud projects describe $PROJECT_ID --format="value(projectNumber)")

# Grant permission to write logs
gcloud projects add-iam-policy-binding $PROJECT_ID \
    --role=roles/logging.logWriter \
    --member=principal://iam.googleapis.com/projects/${PROJECT_NUMBER}/locations/global/workloadIdentityPools/${PROJECT_ID}.svc.id.goog/subject/ns/default/sa/adk-agent-sa

# Grant permission to write traces
gcloud projects add-iam-policy-binding $PROJECT_ID \
    --role=roles/cloudtrace.agent \
    --member=principal://iam.googleapis.com/projects/${PROJECT_NUMBER}/locations/global/workloadIdentityPools/${PROJECT_ID}.svc.id.goog/subject/ns/default/sa/adk-agent-sa

# Grant permission to use Vertex AI
gcloud projects add-iam-policy-binding $PROJECT_ID \
    --role=roles/aiplatform.user \
    --member=principal://iam.googleapis.com/projects/${PROJECT_NUMBER}/locations/global/workloadIdentityPools/${PROJECT_ID}.svc.id.goog/subject/ns/default/sa/adk-agent-sa
Run the following command to automatically replace YOUR_PROJECT_ID with your actual project ID and apply the configuration!
sed -i "s/YOUR_PROJECT_ID/$PROJECT_ID/g" ~/gke-ai-agent-lab/deployment.yaml
sed -i "s/YOUR_GATEWAY_IP/$GATEWAY_IP/g" ~/gke-ai-agent-lab/deployment.yaml
sed -i "s/YOUR_REGION/$ZONE/g" ~/gke-ai-agent-lab/deployment.yaml
kubectl apply -f ~/gke-ai-agent-lab/deployment.yaml
8. Observe and Validate
It's time to test the fully integrated system.
Test the Code Generation Agent in the UI
Find the External IP of your ADK Web UI:
kubectl get services code-agent-service
The output should look something like:
NAME                 TYPE           CLUSTER-IP       EXTERNAL-IP    PORT(S)        AGE
code-agent-service   LoadBalancer   34.118.230.182   34.31.250.60   80:32471/TCP   2m14s
- Open a browser and navigate to
http://[EXTERNAL-IP]. - In the ADK web interface, ensure the "root_agent" is selected from the drop-down menu on the upper right. Then, prompt the agent:
Write a python script that prints 'Hello from the isolated sandbox'.
To observe how the agent utilizes the inference backend and sandbox, proceed to the Explore Model Statistics via Cloud Observability and Explore Agent Observability via GKE UI sections below to view the dashboards.
Explore Agent Observability via GKE UI
Now that you have run some prompts, let's look at the telemetry data. This helps you understand how the Inference Scheduler and vLLM are performing.
Access the Agent Dashboards
- Navigate to the Kubernetes Engine > Workloads page.
- Click on the code-agent deployment to open the Deployment Details page.
- Click on the Observability tab.
- In the left navigation panel of the observability dashboard, you will see a new Agent section with sub-tabs.
What to Explore
Explore the following sub-tabs to see the behavior of your agent application:
- Overview: View scorecards for sessions, average turns, and invocations.
- Models: See the number of model calls, error rates, and latency categorized by the models your agent used.
- Tools: Monitor tool calls and execution duration to see how effectively your agent is using its sandbox execution tool.
- Usage: Track token usage and standard container resource allocation (CPU and Memory).
- Agent traces: Switch to this tab to see a list of execution sessions or raw trace spans. Clicking a row opens a flyout with details of the selected trace!
By combining model-level metrics from vLLM with app-level telemetry from ADK, you now have full-stack observability for your generative AI agent on GKE!
Explore vLLM Model Statistics via Cloud Observability
Now that you have run some prompts, let's look at the telemetry data. This helps you understand how the Inference Scheduler and vLLM are performing.
Access the Dashboards
- Navigate to the Google Cloud Console.
- Go to Monitoring > Dashboards.
- Search for and select the vLLM Prometheus Overview dashboard.
Interesting Metrics to Observe
While viewing the dashboard, pay attention to these key metrics to see the impact of GKE Inference Gateway and prefix-caching:
- KV Cache Utilization (
vllm:gpu_cache_usage):- Why it matters: This shows how much of the GPU memory is being used to cache context. If this is high, it means the system is holding onto context to speed up future requests. If you run the same prompt multiple times, you should see this utilization rise and then stabilize.
- Running vs Waiting Requests (
vllm:num_requests_runningvsvllm:num_requests_waiting):- Why it matters: This indicates load. If waiting requests are high, it means your nodes are overloaded.
- Token Throughput (
vllm:request_prompt_tokens_totandvllm:request_generation_tokens_tot):- Why it matters: Track the volume of input and output tokens processed by the cluster.
- Time To First Token (TTFT):
- Why it matters: This is the critical metric for interactive agents. By using GKE Inference Gateway with Prefix-Cache Aware Routing, requests sharing common contexts (like system prompts or large context windows) are routed to the same replica, minimizing TTFT by reusing existing cache hits!
Experiments to Try
Try these scenarios to see the metrics shift in real-time and validate proper scheduling!
Experiment 1: The "Speed of Repetition" (Prefix Cache Hit)
- Send a complex prompt to the agent (e.g., "Write a python script to parse a 100MB CSV file and calculate statistics.").
- Once it responds, send the exact same prompt again immediately.
- Observe the Prefix Cache Hit Rate and Time To First Token (TTFT).
- What you should see: The Prefix Cache Hit Rate should climb to 100% and the TTFT should drop dramatically!
- What it means: The GKE Inference Gateway recognized the shared context and routed it to the exact same replica which reused its evaluated context cache!
Experiment 2: Falling back to the Cloud (Model Reliability)
- To simulate a failure of your local Qwen model, you can either stop the inference service or simply provide a bogus
OPENAI_API_BASEin the deployment. - Update the
OPENAI_API_BASEin yourdeployment.yamlto a non-existent IP or port and apply the changes:sed -i "s|value: \"http://$GATEWAY_IP/v1\"|value: \"http://10.0.0.1:8080/v1\"|g" ~/gke-ai-agent-lab/deployment.yaml kubectl apply -f ~/gke-ai-agent-lab/deployment.yaml - Wait for the pod to restart, then send a prompt to the agent in the UI.
- What you should see: The agent still responds successfully!
- What it means: Because of the
fallbacksconfiguration, ADK recognized the failure of the local Qwen endpoint and seamlessly routed the request to Gemini 2.5 Flash on Vertex AI. Note that because these fallback calls to Vertex AI bypass your local vLLM Inference Gateway, they will not appear in the Agent Observability > Models dashboard, which only tracks traffic going through vLLM.
Understanding the Power of Dynamic Resource Allocation (DRA)
While the vLLM and Inference Gateway optimize how requests are routed and served, Dynamic Resource Allocation (DRA) is what made it possible to attach the precisely right hardware to your workload in the first place.
DRA elevates your ability to granularly manage hardware across your cluster by allowing you to define flexible hardware resources using ResourceClaimTemplate and DeviceClasses.
Why DRA is a Game-Changer for AI Workloads:
- Fine-Grained Hardware Requests: With DRA, you aren't just ensuring workloads are scheduled on machines with the right accelerator, you can also place a claim on those resources to ensure they are used exclusively by the workload associated with the ResourceClaim.
- Decoupled Lifecycle: Device claims are managed independently of Pod lifecycles. If a Pod crashes, the GPU claim can persist, so that the overarching deployment or other workload object can be restarted without having to wait for the GPU to be released and re-acquired.
- Multi-Vendor Standardization: DRA provides a unified Kubernetes API for both NVIDIA GPUs and Google TPUs. You use the exact same schema whether you are deploying for one or the other, making your workload YAML manifests highly portable!
In this codelab, you saw this in action when you configured your Helm values to bind to the gpu-claim-template seamlessly, without having hanging device plugin configurations blocking your rollouts.
Understanding the Role of llm-d
While vLLM evaluates neural weights and the GKE Gateway routes queries, llm-d acts as the configuration layer and the "Glue" that binds them all together.
Without llm-d, you would have to write raw Kubernetes manifests to declare your vLLM deployment, your service ports, volume mounts, and your DRA resource claims from scratch.
Why Use llm-d in Your Deployment?
- Unified Configuration (One-line overrides):
llm-dHelm charts bundle complex, low-level Kubernetes resources into clean, high-level toggles (like settingaccelerator.dra: true). - Pre-Vetted "Well-Lit-Paths": The
llm-drepository contains configurations that are already benchmarked and tested by experts. When you deployllm-d-modelservice, you receive optimized defaults for GPU memory utilization, recommended probe timings (liveness/readiness), and correct exposures for metrics scraping. - Seamless Observability Mapping: Out-of-the-box,
llm-densures standard container ports and scrape paths (/metrics) are exposed correctly, making it easy to wire your deployment into Google Cloud Monitoring without manual debugging.
In short, llm-d provides the reusable architecture blueprints so developers don't have to reinvent the wheel every time they deploy an inference stack on GKE.
Deep Dive: The GKE Inference Gateway
Standard Layer 7 load balancers operate by looking at HTTP headers like paths (/v1/completions) or cookies. The GKE Inference Gateway goes much deeper—it is designed specifically for generative AI traffic.
How It Drives Performance and Efficiency:
- Content-Aware Routing (Prompt Hashing): The GKE Inference Gateway intercepts the JSON request body. It calculates a hash of the prompt and tracks which backend replica is already holding those tokens in its GPU memory (the KV Cache).
- Maximizing Cache Hits: In your testing, when you repeated a prompt, the Gateway sent it to the exact same replica. Evaluating a prompt takes heavy compute. By reusing the cache, you avoid "re-reading" the prompt, saving money and GPU time.
- Slashing Time-to-First-Token (TTFT): TTFT is the critical usability metric for human-facing agents. By hitting the cache, the model can start generating tokens in milliseconds rather than seconds.
- Intelligent Load Distribution: If one replica's VRAM is completely full of cache hits, the Gateway can dynamically route a fresh prompt to a different replica that has room, balancing efficiency with availability.
How Agent Sandbox Reduces Risk
In this lab, we demonstrated how Agent Sandbox protects your infrastructure from the risks associated with AI agents by providing two layers of isolation:
- Isolating the Execution Tool: The agent executes the code it generates in an ephemeral sandbox. This ensures that untrusted code generated by the LLM runs in a secure, isolated environment, protecting the agent and the cluster.
- Fast Startup: By using a WarmPool, new sandboxes start up in under a second, ready to execute code.
- Isolating the Agent itself: We also ran the agent application itself in a gVisor-enabled node (via
runtimeClassName: gvisor) to provide defense-in-depth against supply chain vulnerabilities in the agent's dependencies.
Here is why this creates such a hardened security boundary:
- System Call Interception: gVisor intercepts system calls before they reach the host Linux kernel. This blocks exploits that try to break out of the container to access the host node.
- Restricted Lateral Movement: Combined with Network Policies, even if an environment is compromised, it cannot scan your internal Metadata servers or pivot to other sensitive services in your cluster.
Running Full Agents in Sandboxes
In this lab, we used sandboxes as tools for a persistent agent application. However, for maximum security—especially when handling sensitive data or serving multiple untrusted users—you can run the entire agent application inside a dedicated sandbox for each session or user. This ensures complete isolation of the agent's memory, state, and execution environment, which is destroyed immediately after the session completes.
9. Cleanup
To avoid incurring charges to your Google Cloud account for the resources used in this codelab, follow these steps to delete them.
Delete Individual Resources
- Delete the GKE Cluster:
gcloud container clusters delete $CLUSTER_NAME --zone $ZONE --quiet
- Delete the Artifact Registry repository:
gcloud artifacts repositories delete agent-repo --location=us-central1 --quiet
- Delete the VPC Network:
gcloud compute networks delete ai-agent-network --quiet
Delete the Project
If you don't need the project anymore, you can delete it after removing the resources:
gcloud projects delete $PROJECT_ID
10. Summary
Congratulations! You have successfully built and deployed a secure, high-performance code generation agent on GKE.
What you learned
- How to configure and use Dynamic Resource Allocation (DRA) in GKE to manage GPU resources.
- How to use GKE Inference Gateway to optimize LLM serving performance via prefix-cache aware routing.
- How to use Agent Sandbox (gVisor) to execute untrusted code securely on GKE.
- How to use Google Cloud Managed Service for Prometheus to monitor vLLM performance.
- How to configure and view Agent Observability using ADK and GKE Managed OpenTelemetry.
Next Steps & References
- Agent Sandbox: Learn about Agent Sandbox on GKE and GKE Sandbox Pods.
- llm-d: Read the llm-d Guide and check out the llm-d GitHub Repository.
- Dynamic Resource Allocation: Learn about DRA on GKE.
- GKE Inference Gateway: Explore Inference Gateway concepts.
- More Codelabs: Find more tutorials at Google Cloud Codelabs.