
1. Introduction
In today's fast-paced data landscape, empowering business users with self-service Business Intelligence (BI) is crucial. Looker, combined with the power of Gemini, offers innovative features that enable users to upload, explore, and visualize their data. This codelab will guide you through Looker's self-service BI capabilities, demonstrating how you can quickly derive insights and make data-driven decisions without deep technical expertise.
What you'll do
In this codelab, you will learn how to leverage Looker's self-service BI features. You will upload data, use the Expression Assistant to create a new dimension, and explore data using the new Looker Explore interface, including "Browse quick starts," "Ask Insight Assistant," and "Explore from scratch." You will also see how Looker's AI capabilities can help you quickly generate insights and visualizations.
What you'll need
- A Looker instance with self-service Explores enabled.
- (Optional) Admin access to clean up the codelab generate explore.
Audience: LookML Developers, Data Engineers, and Business Analysts.
2. Upload your data to your Looker Instance
- Right-click the sameple data link and select Save Link As to download the file. Ensure the filename ends in
.csvbefore clicking save. - In your Looker instance, from the homepage, click Create > Data Upload.
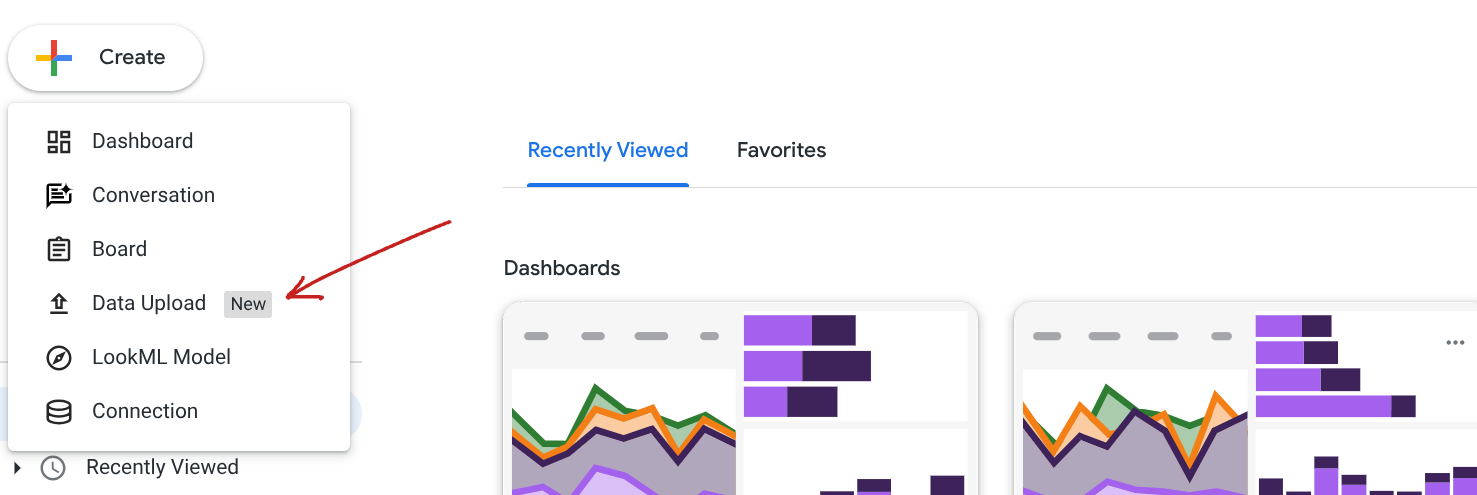
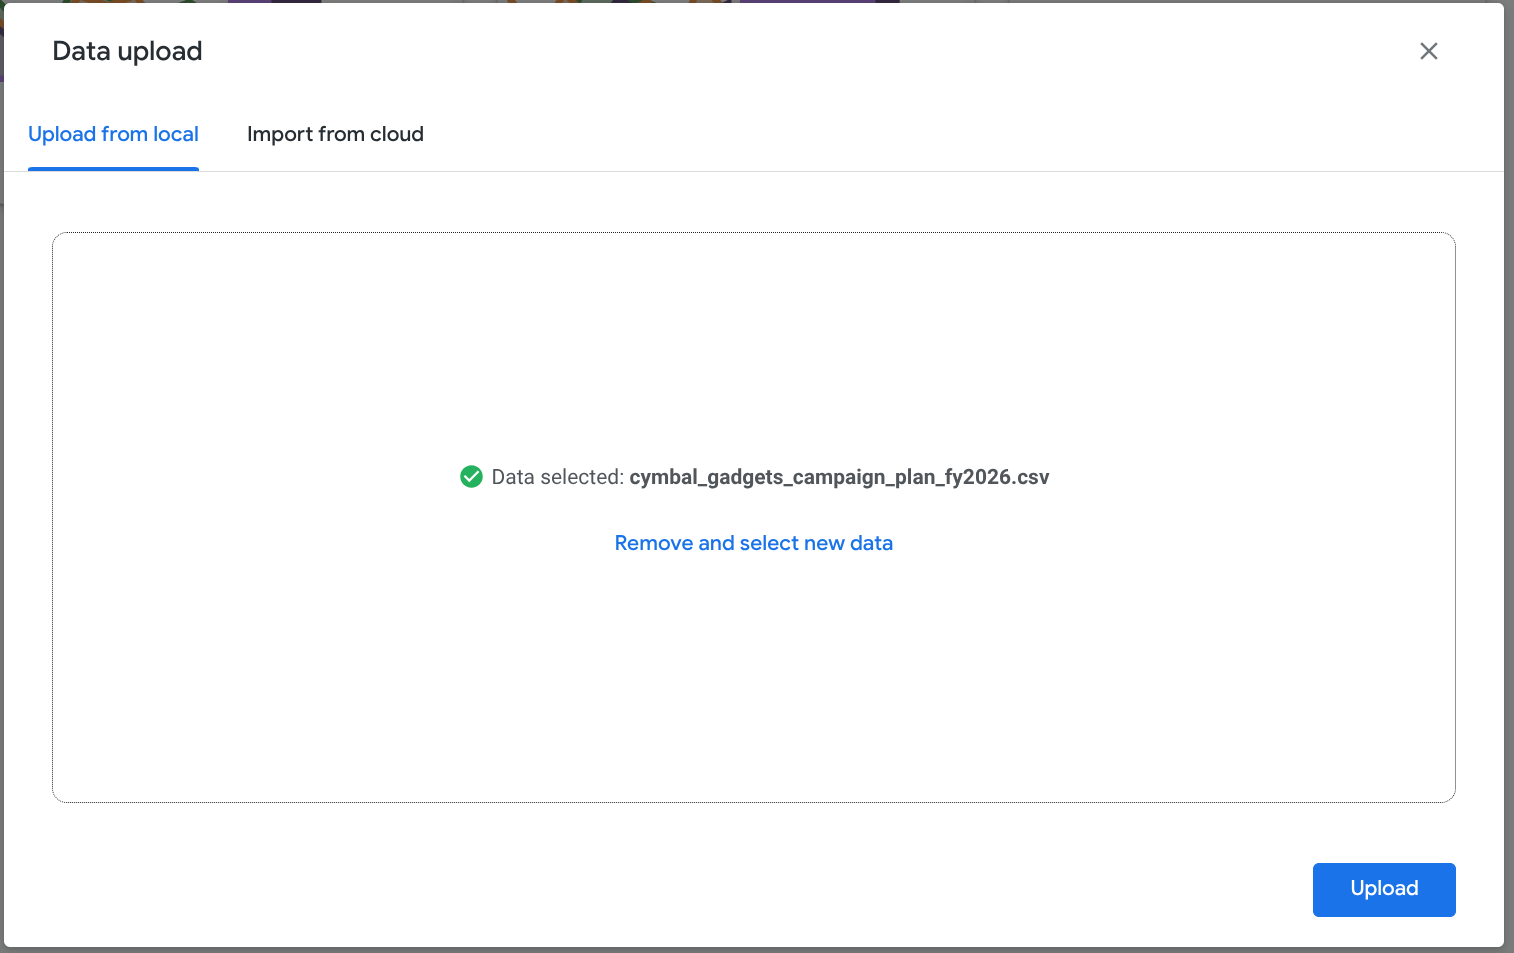
- You will see the following Data Upload screen. You can upload CSV or xls files from your local computer. Or you can choose Import from cloud to import from a Google Sheet. For this codelab, you will use the CSV file you downloaded. Click Choose data and select the CSV file.
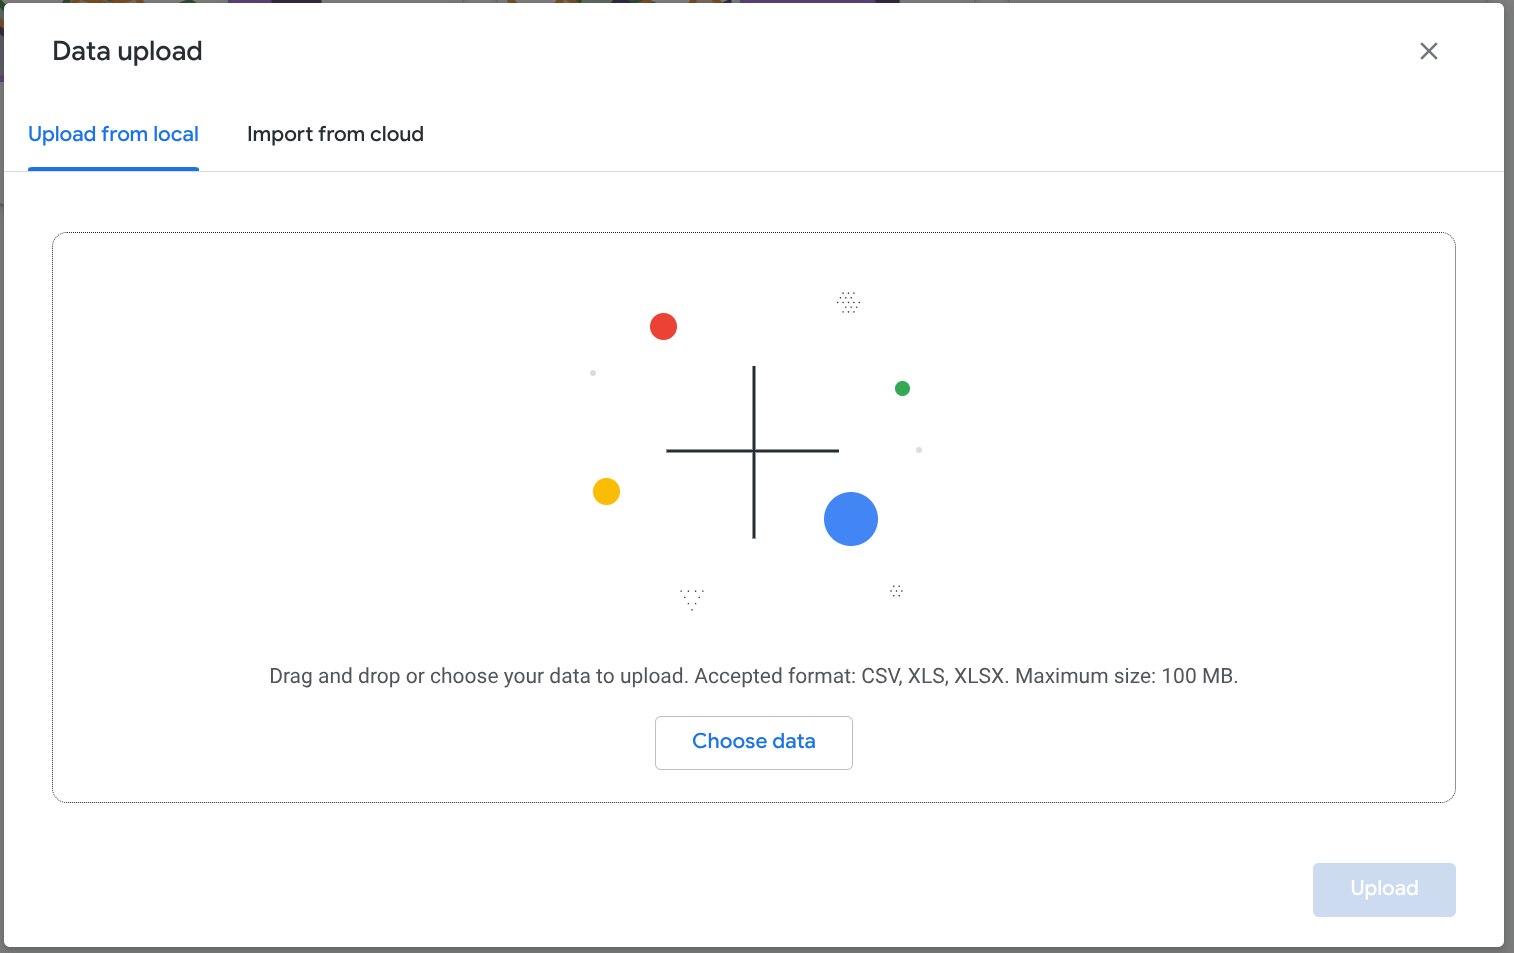
- Click Upload.
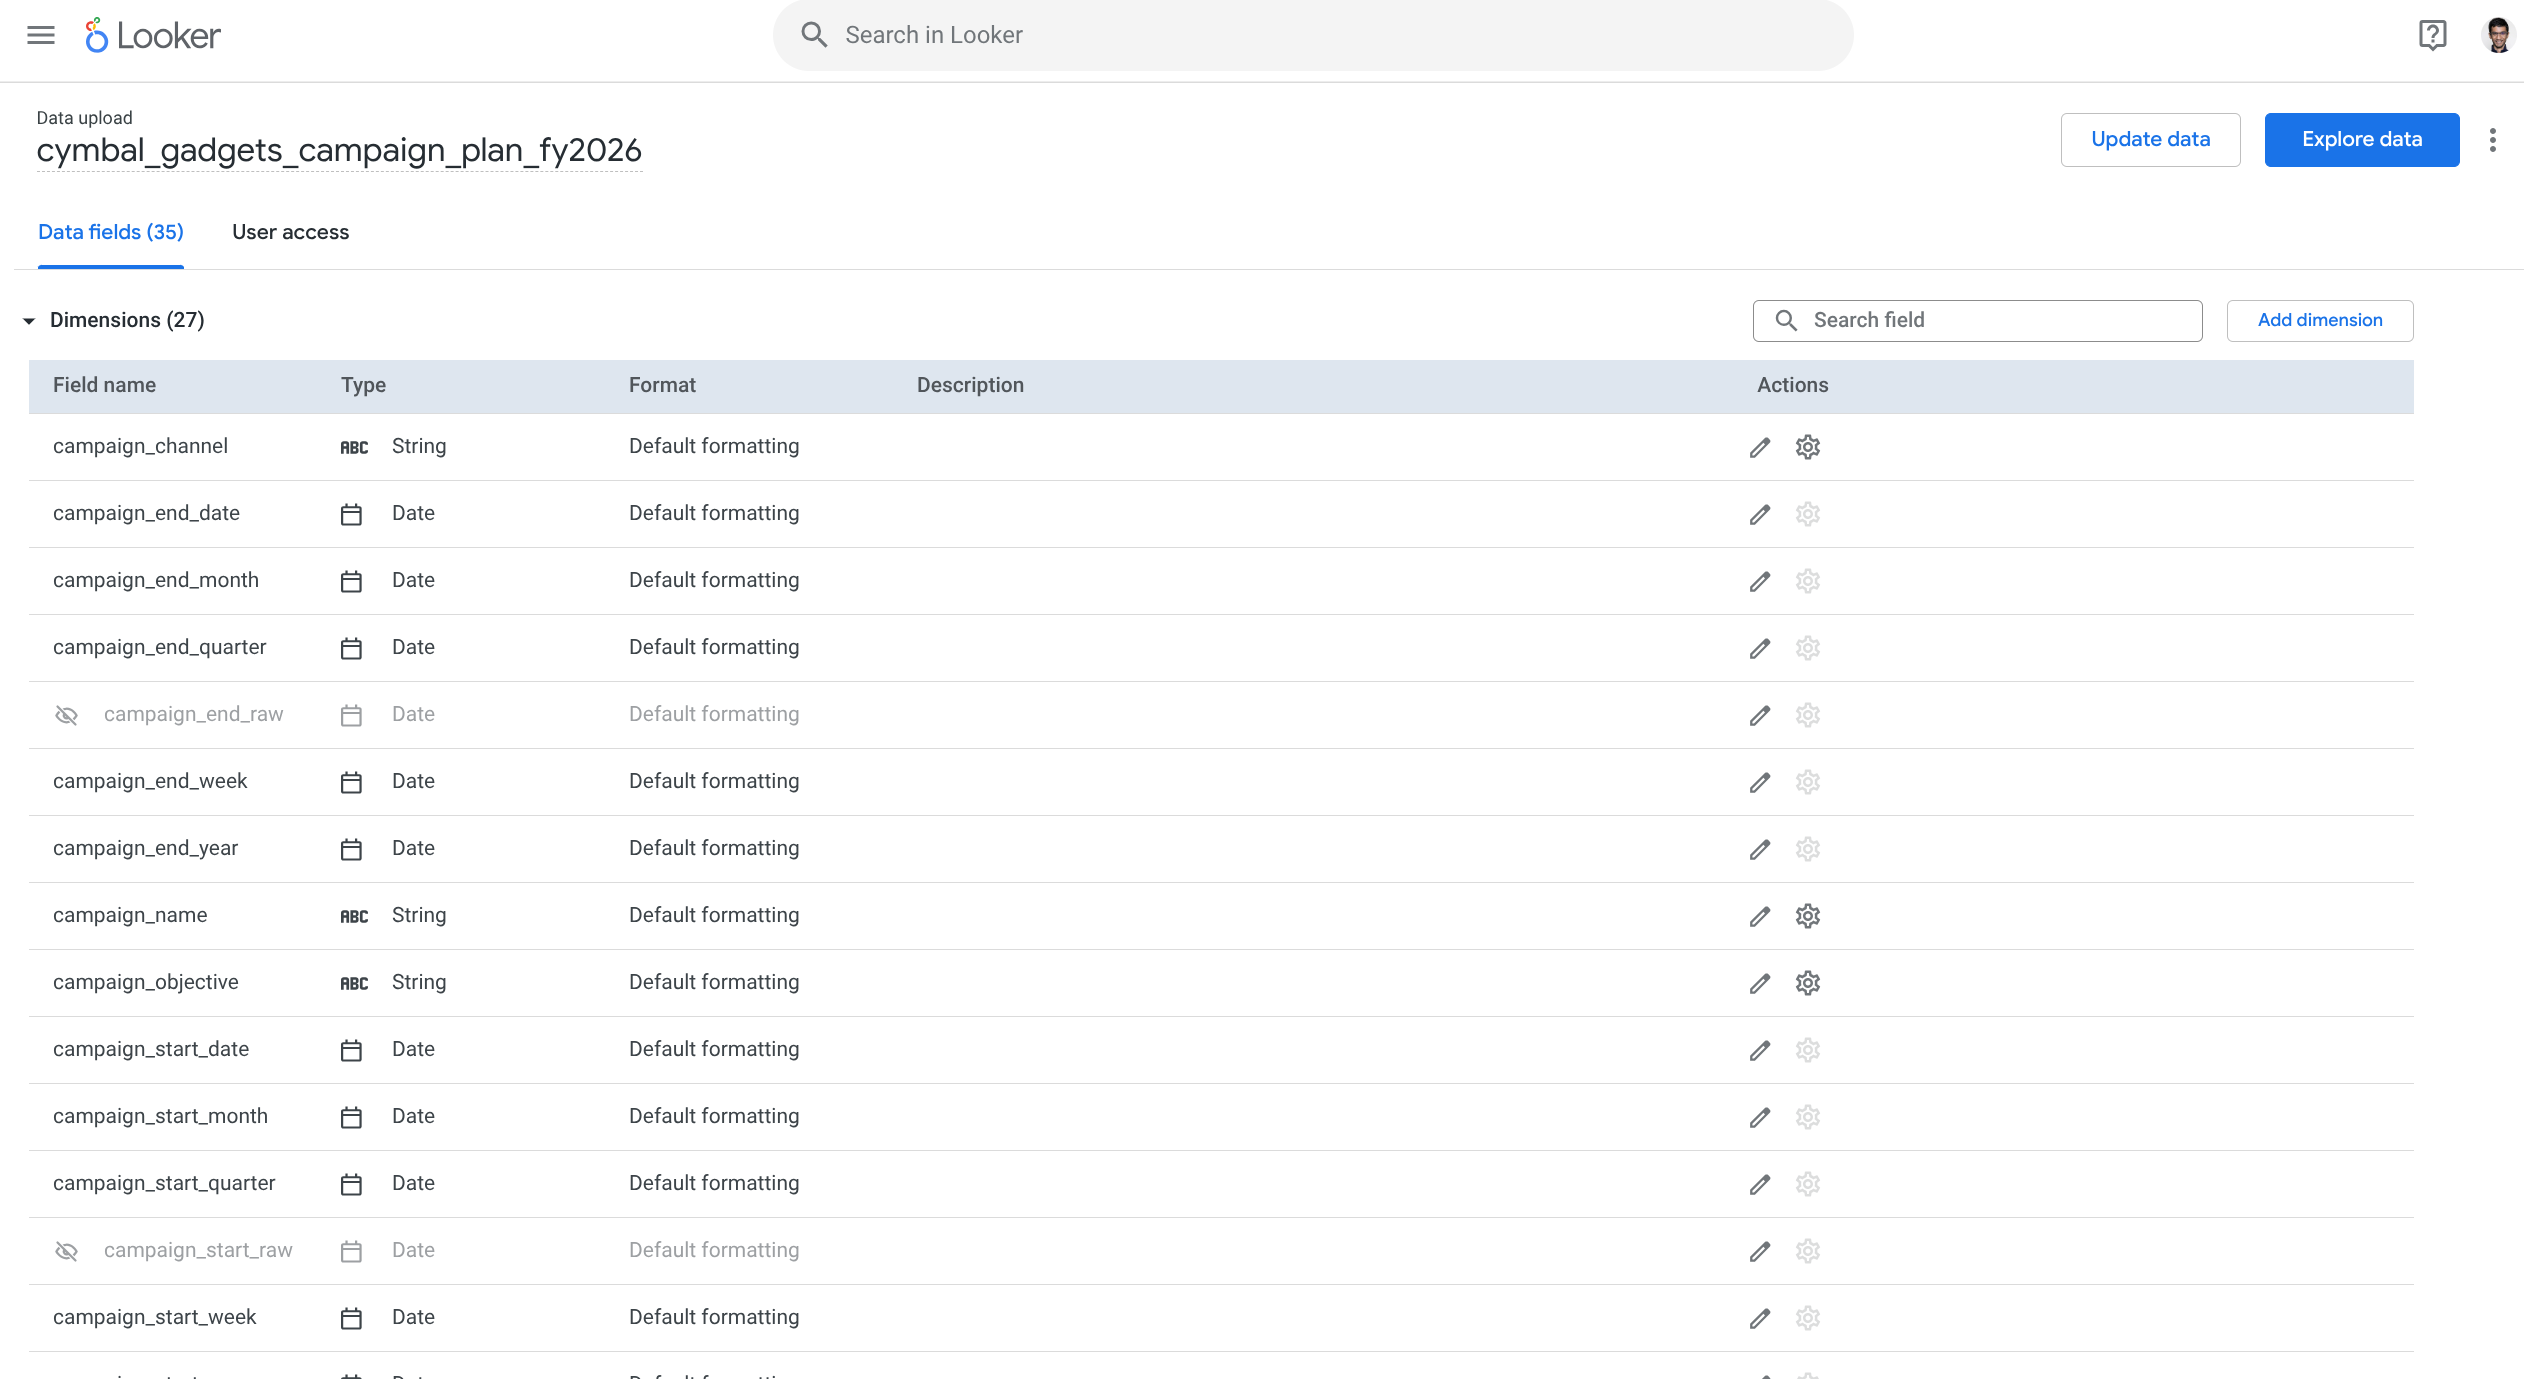
- You should now see the Data Fields interface with all dimensions and measures.
3. Use Expression Assistant to generate a dimension
- You want to create a new dimension that bins campaigns into tiers. Click Add dimension. You will see the Create dimension interface.
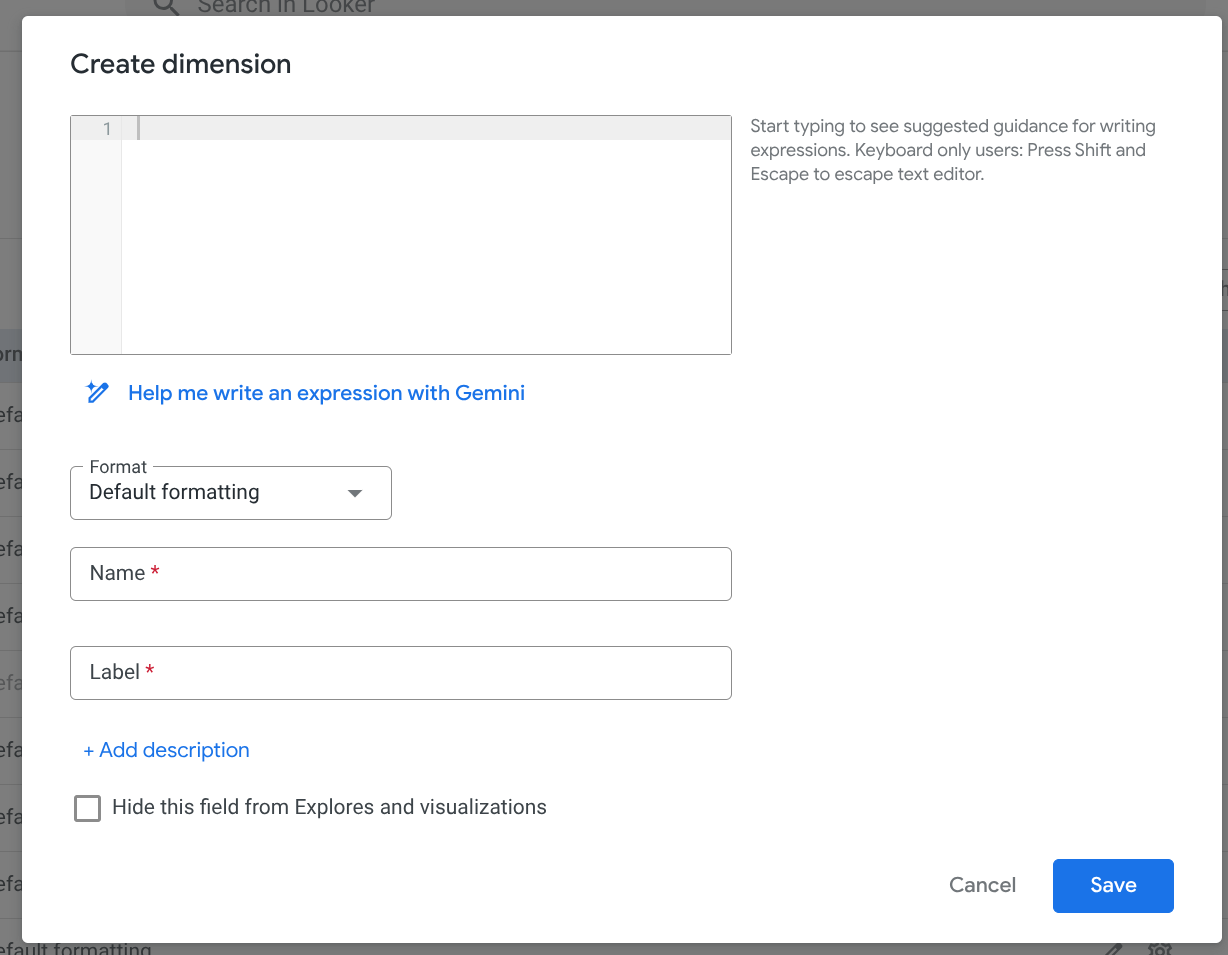
- You will use Gemini to generate the expression for the dimension.
- Click Help me write an expression with Gemini.
- In the Describe your expression field, enter the prompt
campaign binning into short, medium, and long based on duration. - Click Create.
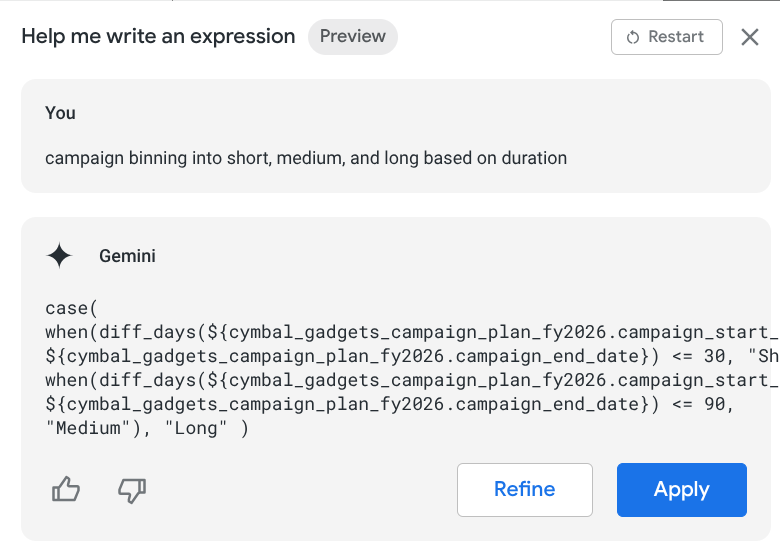
- Click Apply. Looker now has added the expression in the Create dimension interface.
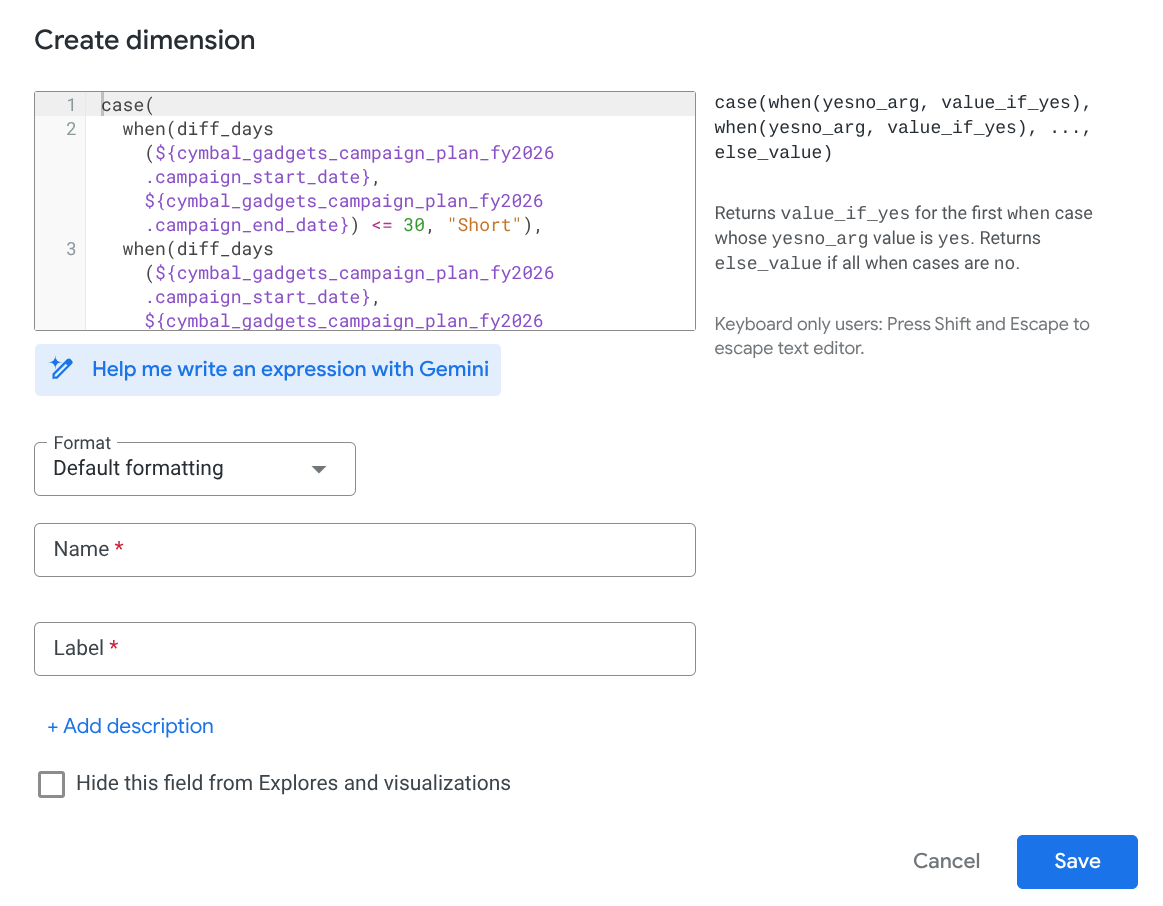
- Add this info in the interface: Name:
campaign_tier, Label:Campaign Tier. Then click Save. - You have created the
campaign_tiermeasure.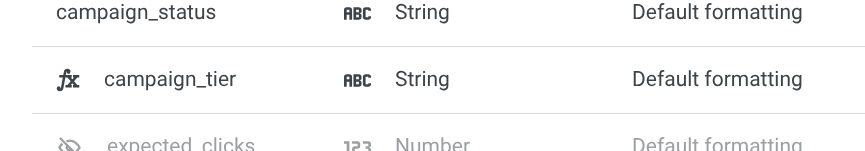
- Click Explore data in the top right to start exploring the data.
4. Use the new Explore interface
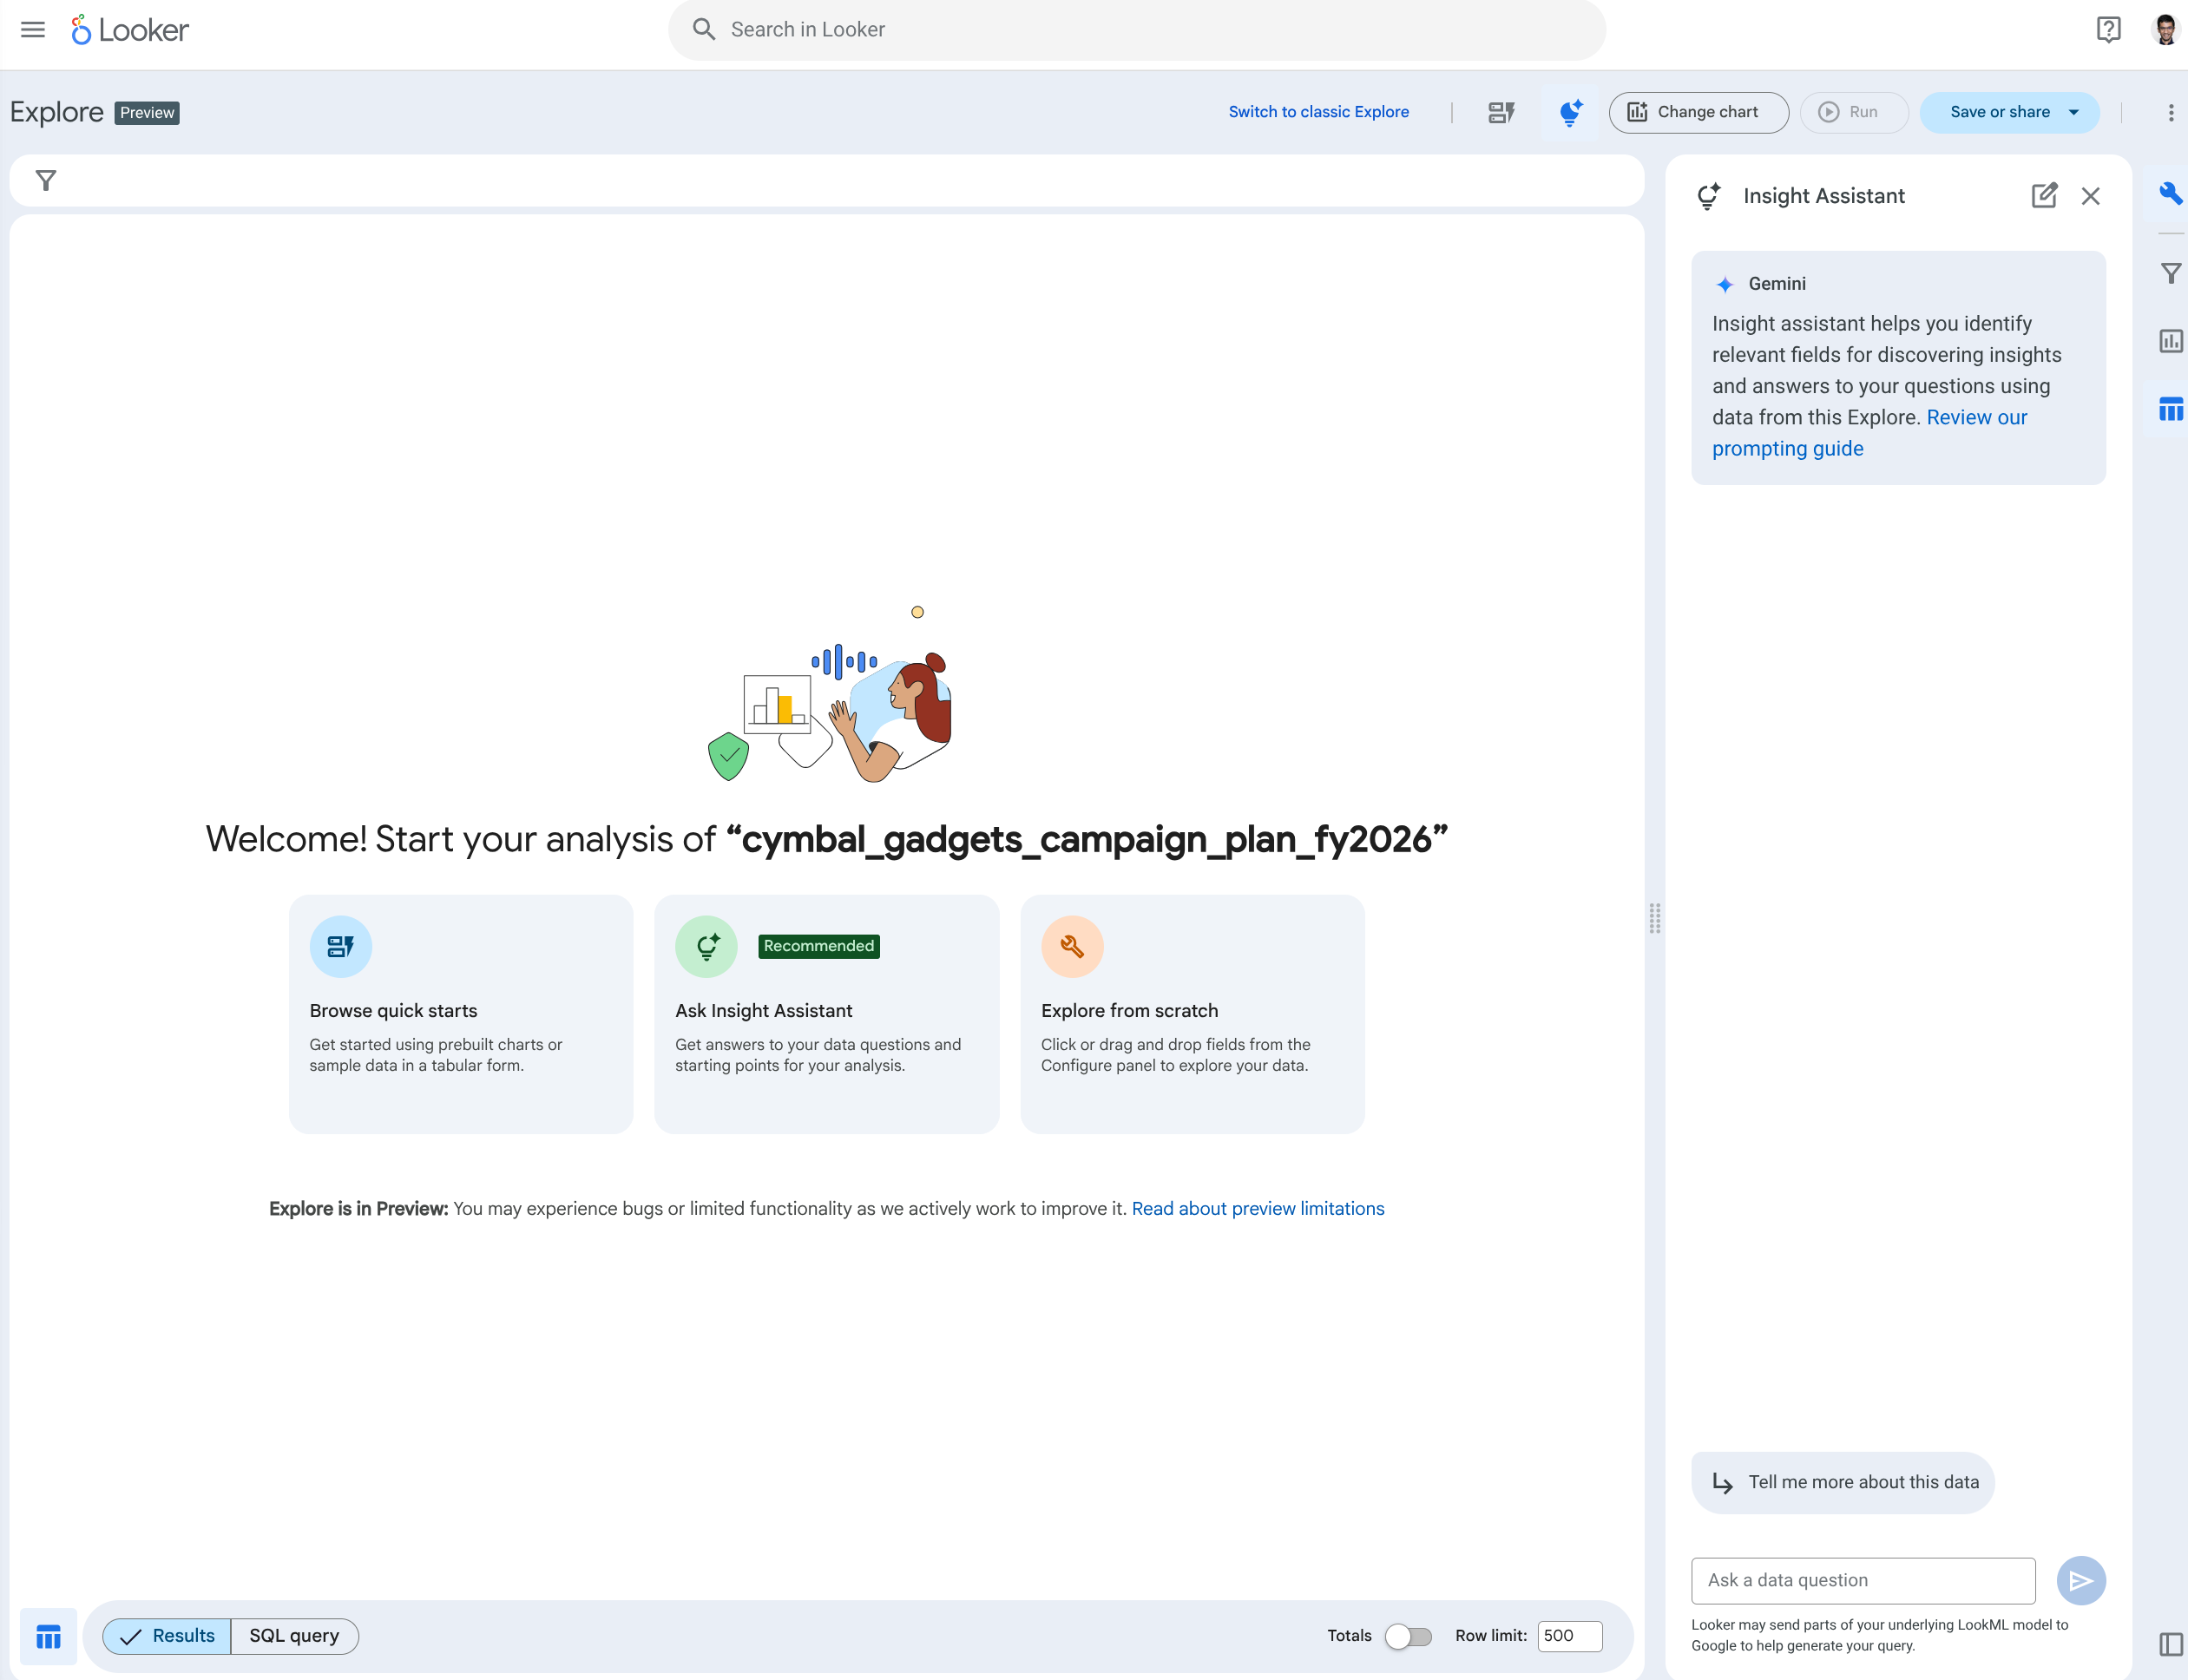
Now you will use the new Explore interface in Looker. If your interface looks like the following image, your instance is using the classic Explore interface.
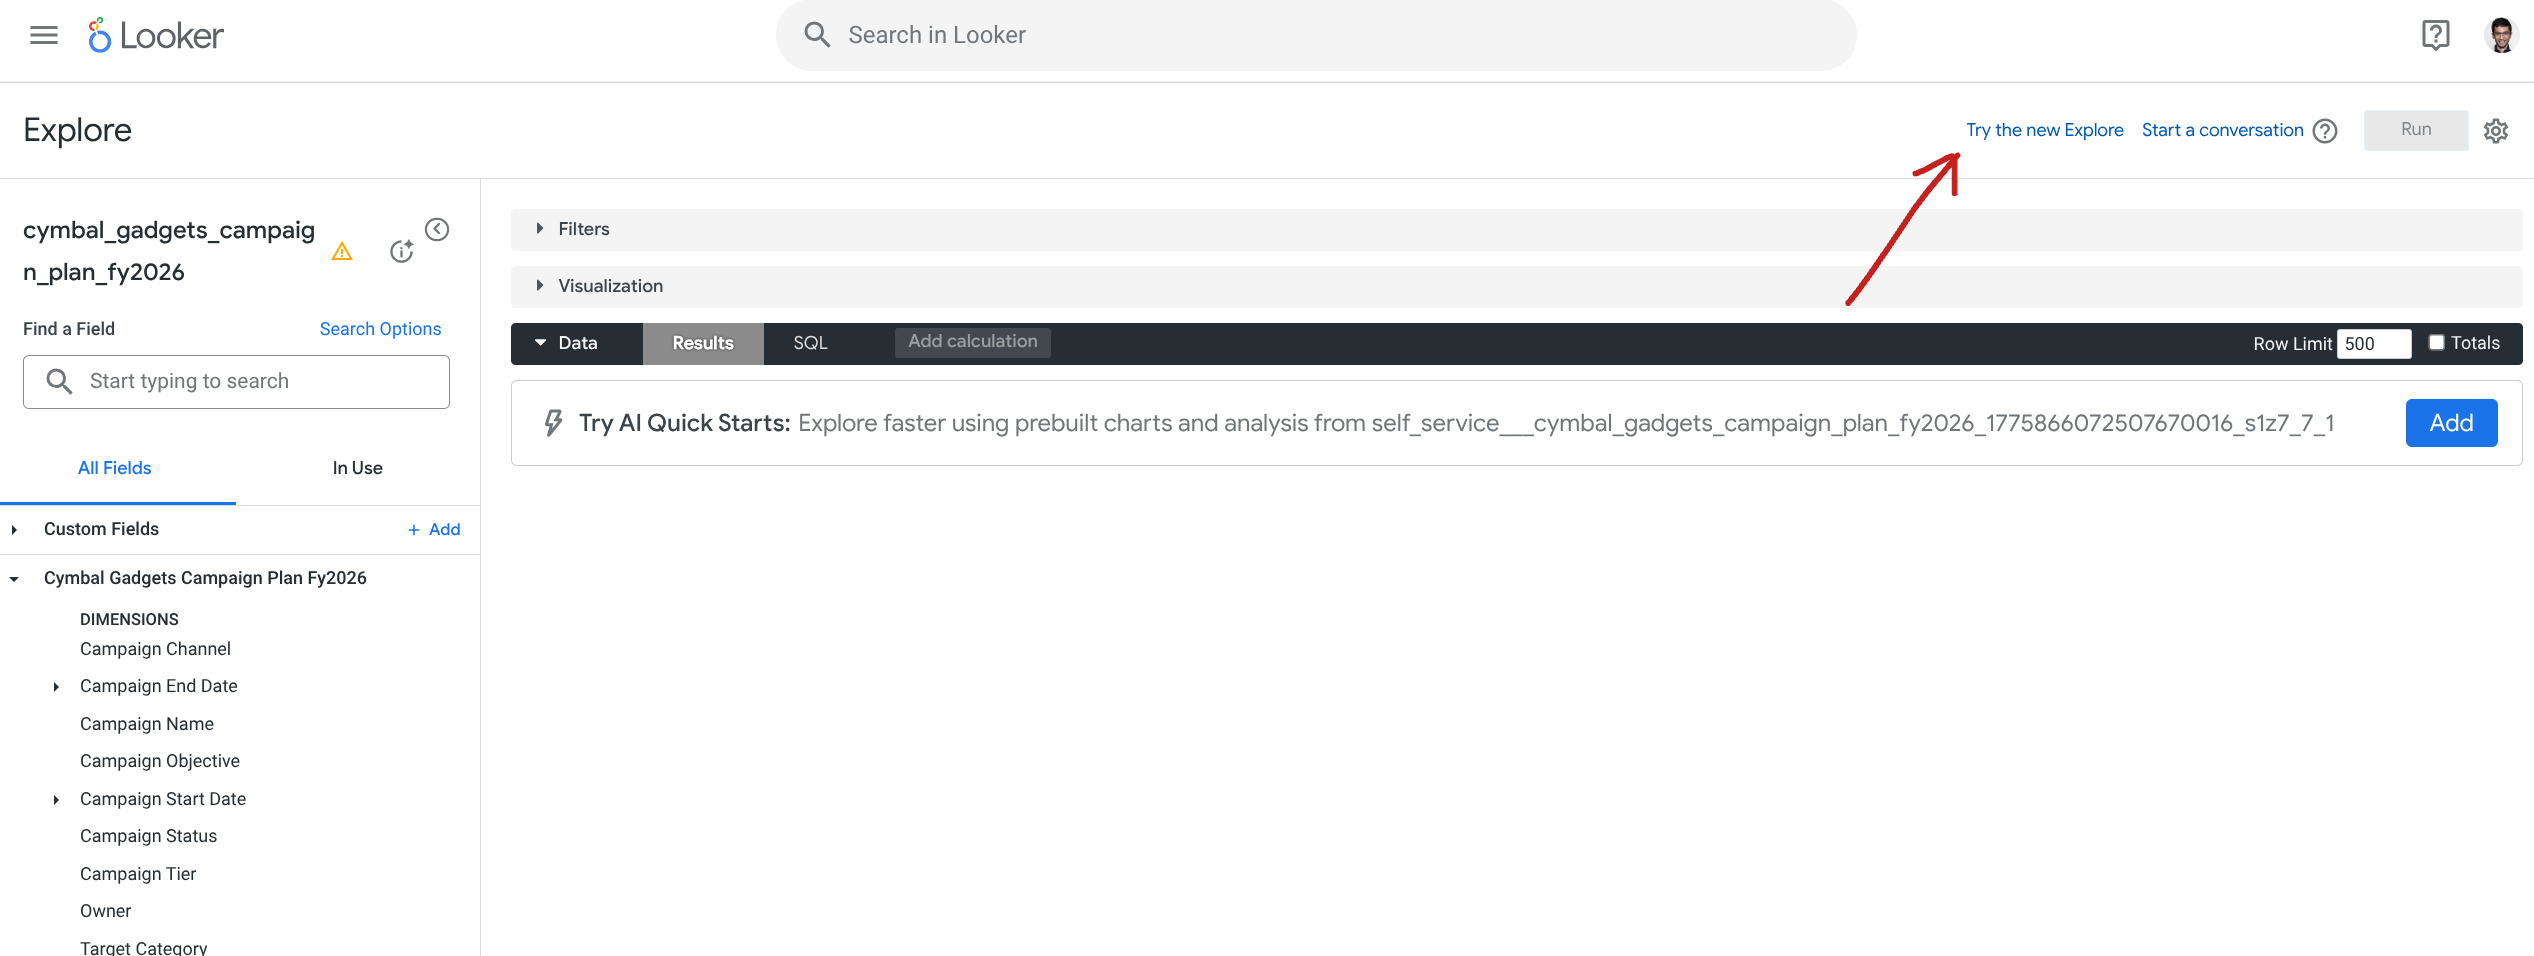
If your instance is using the classic Explore interface, click Try the new Explore. In either case, now you should see the new Explore interface.
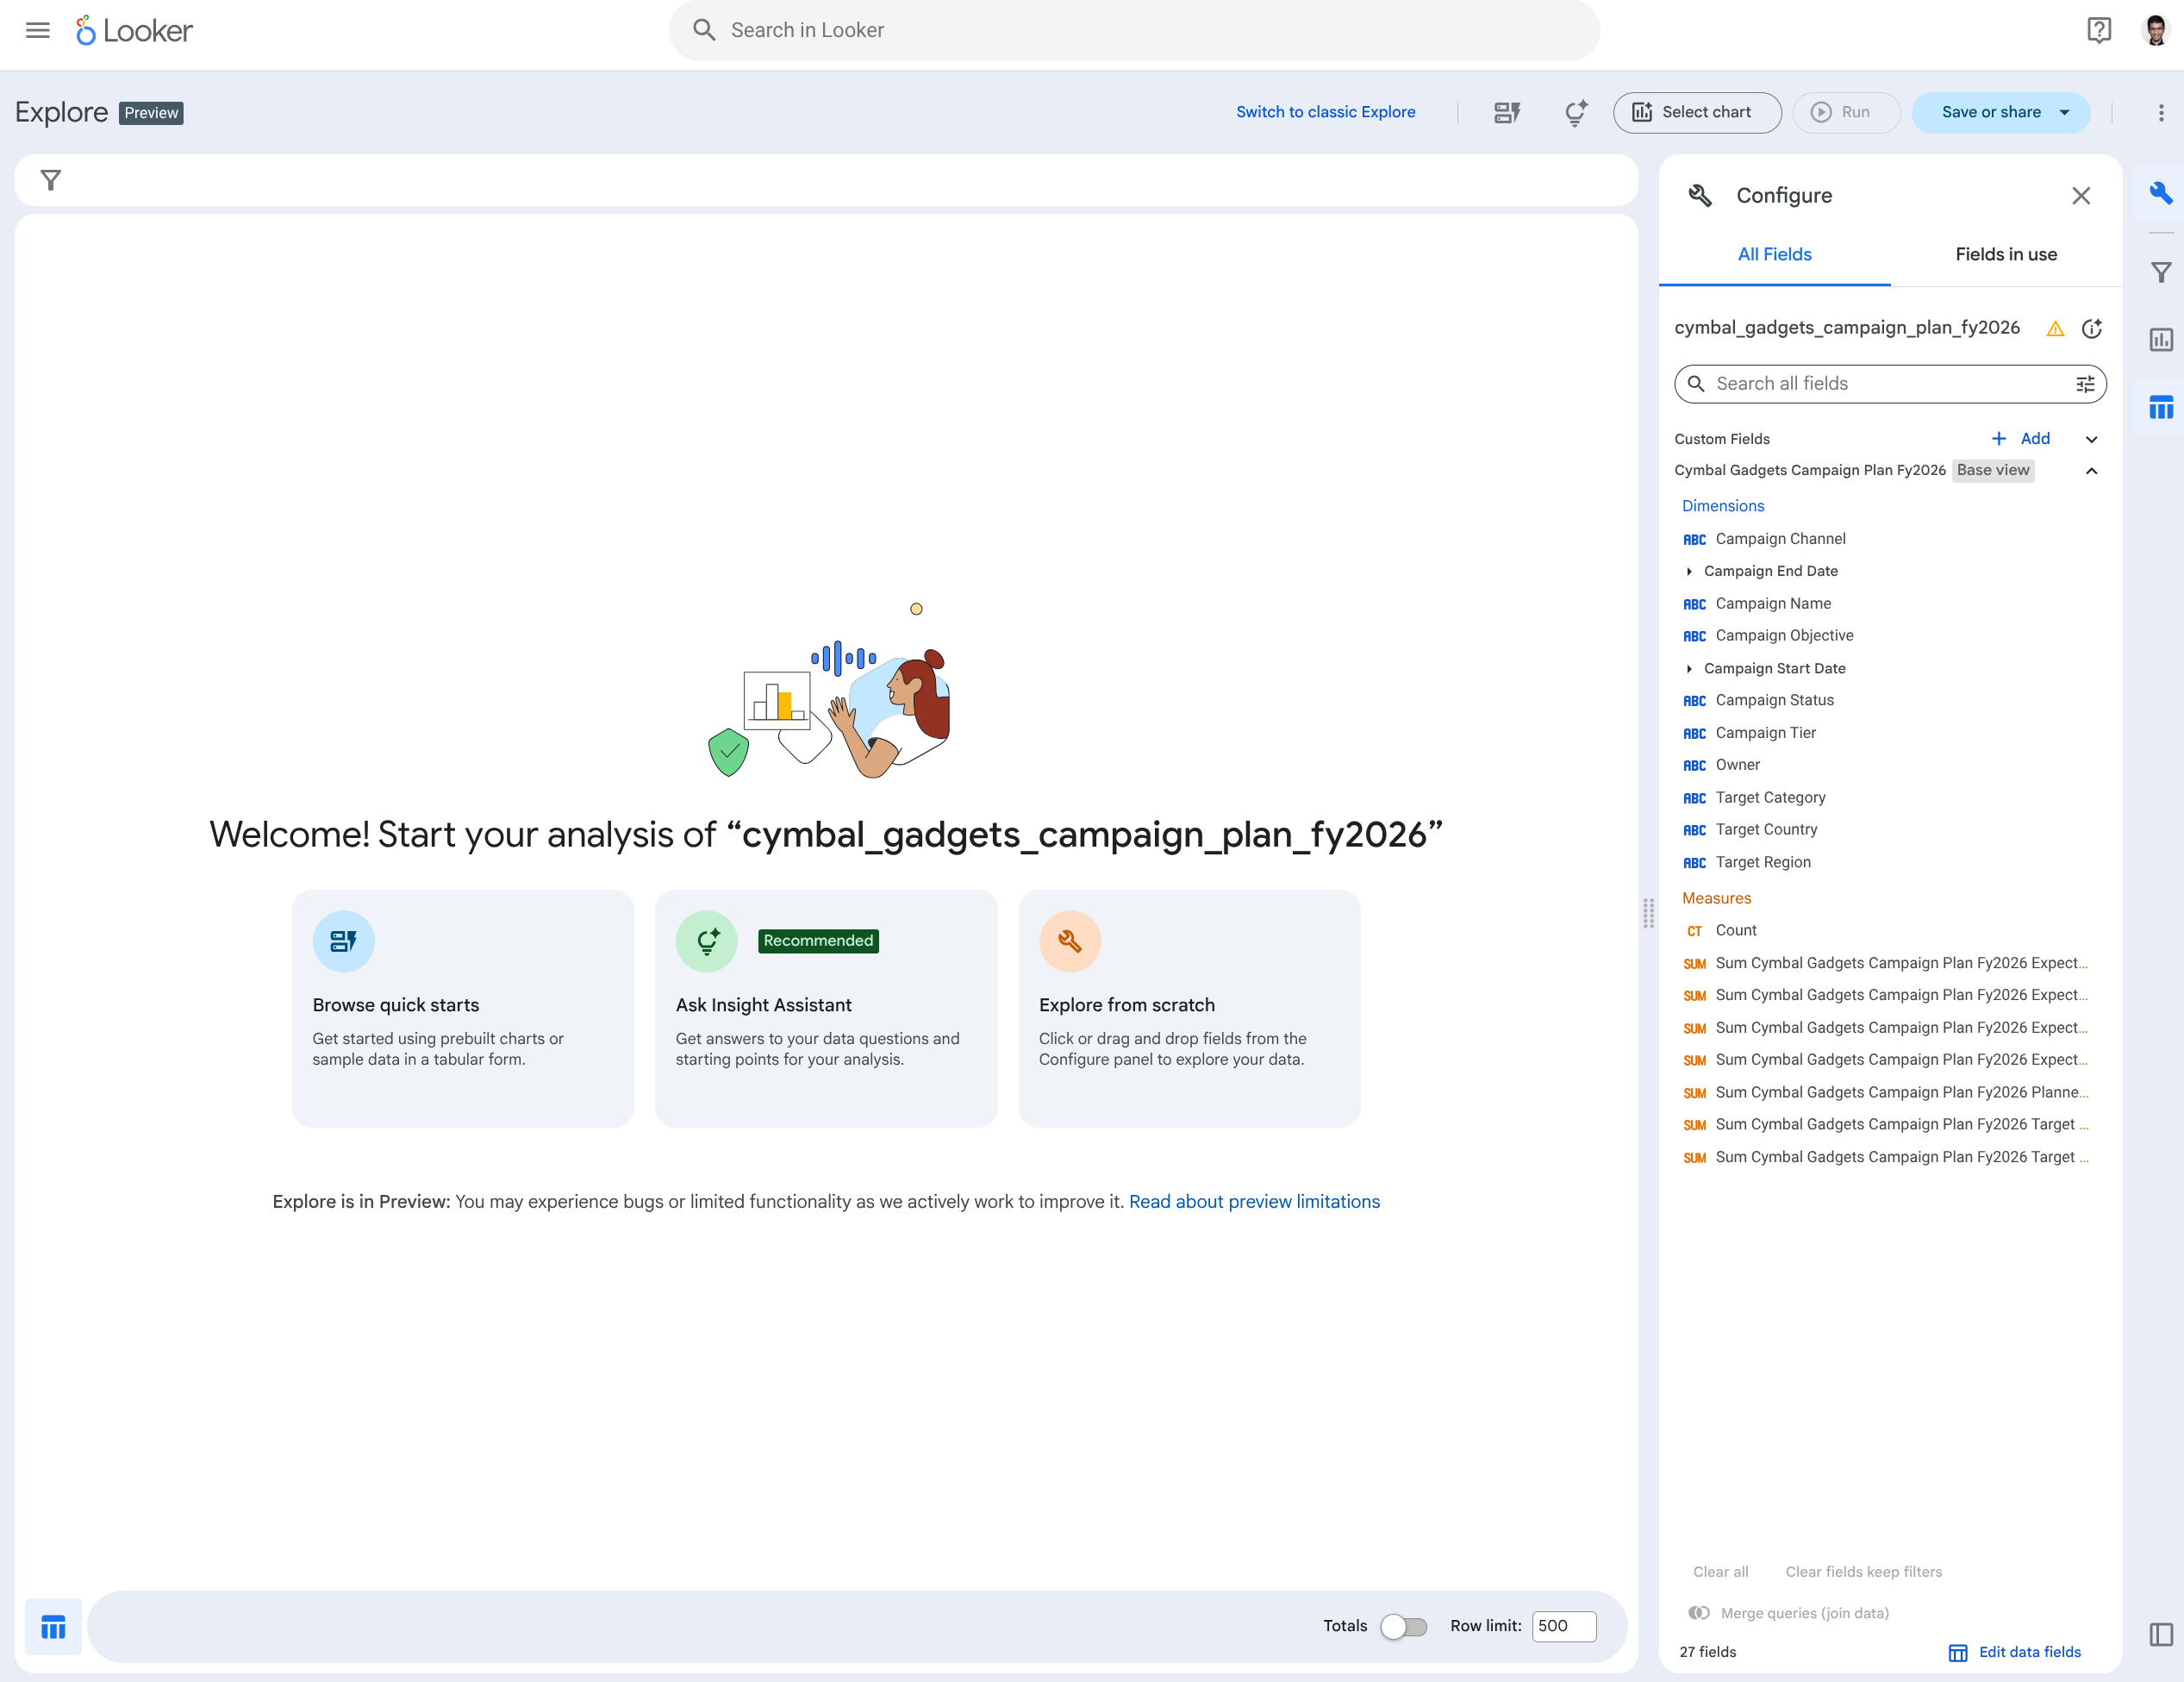
The interface provides 3 options to start exploring your data:
- Browse Quick Starts
- Ask Insight Assistant
- Explore from scratch
We will go through each one starting with Browse Quick Starts.
5. Browse Quick Starts
- Click Browse Quick Starts.
- Looker will review the model and generate three separate explore options for you to choose from. Since this is not deterministic, your results may vary. Pick any one of the options that you find interesting.
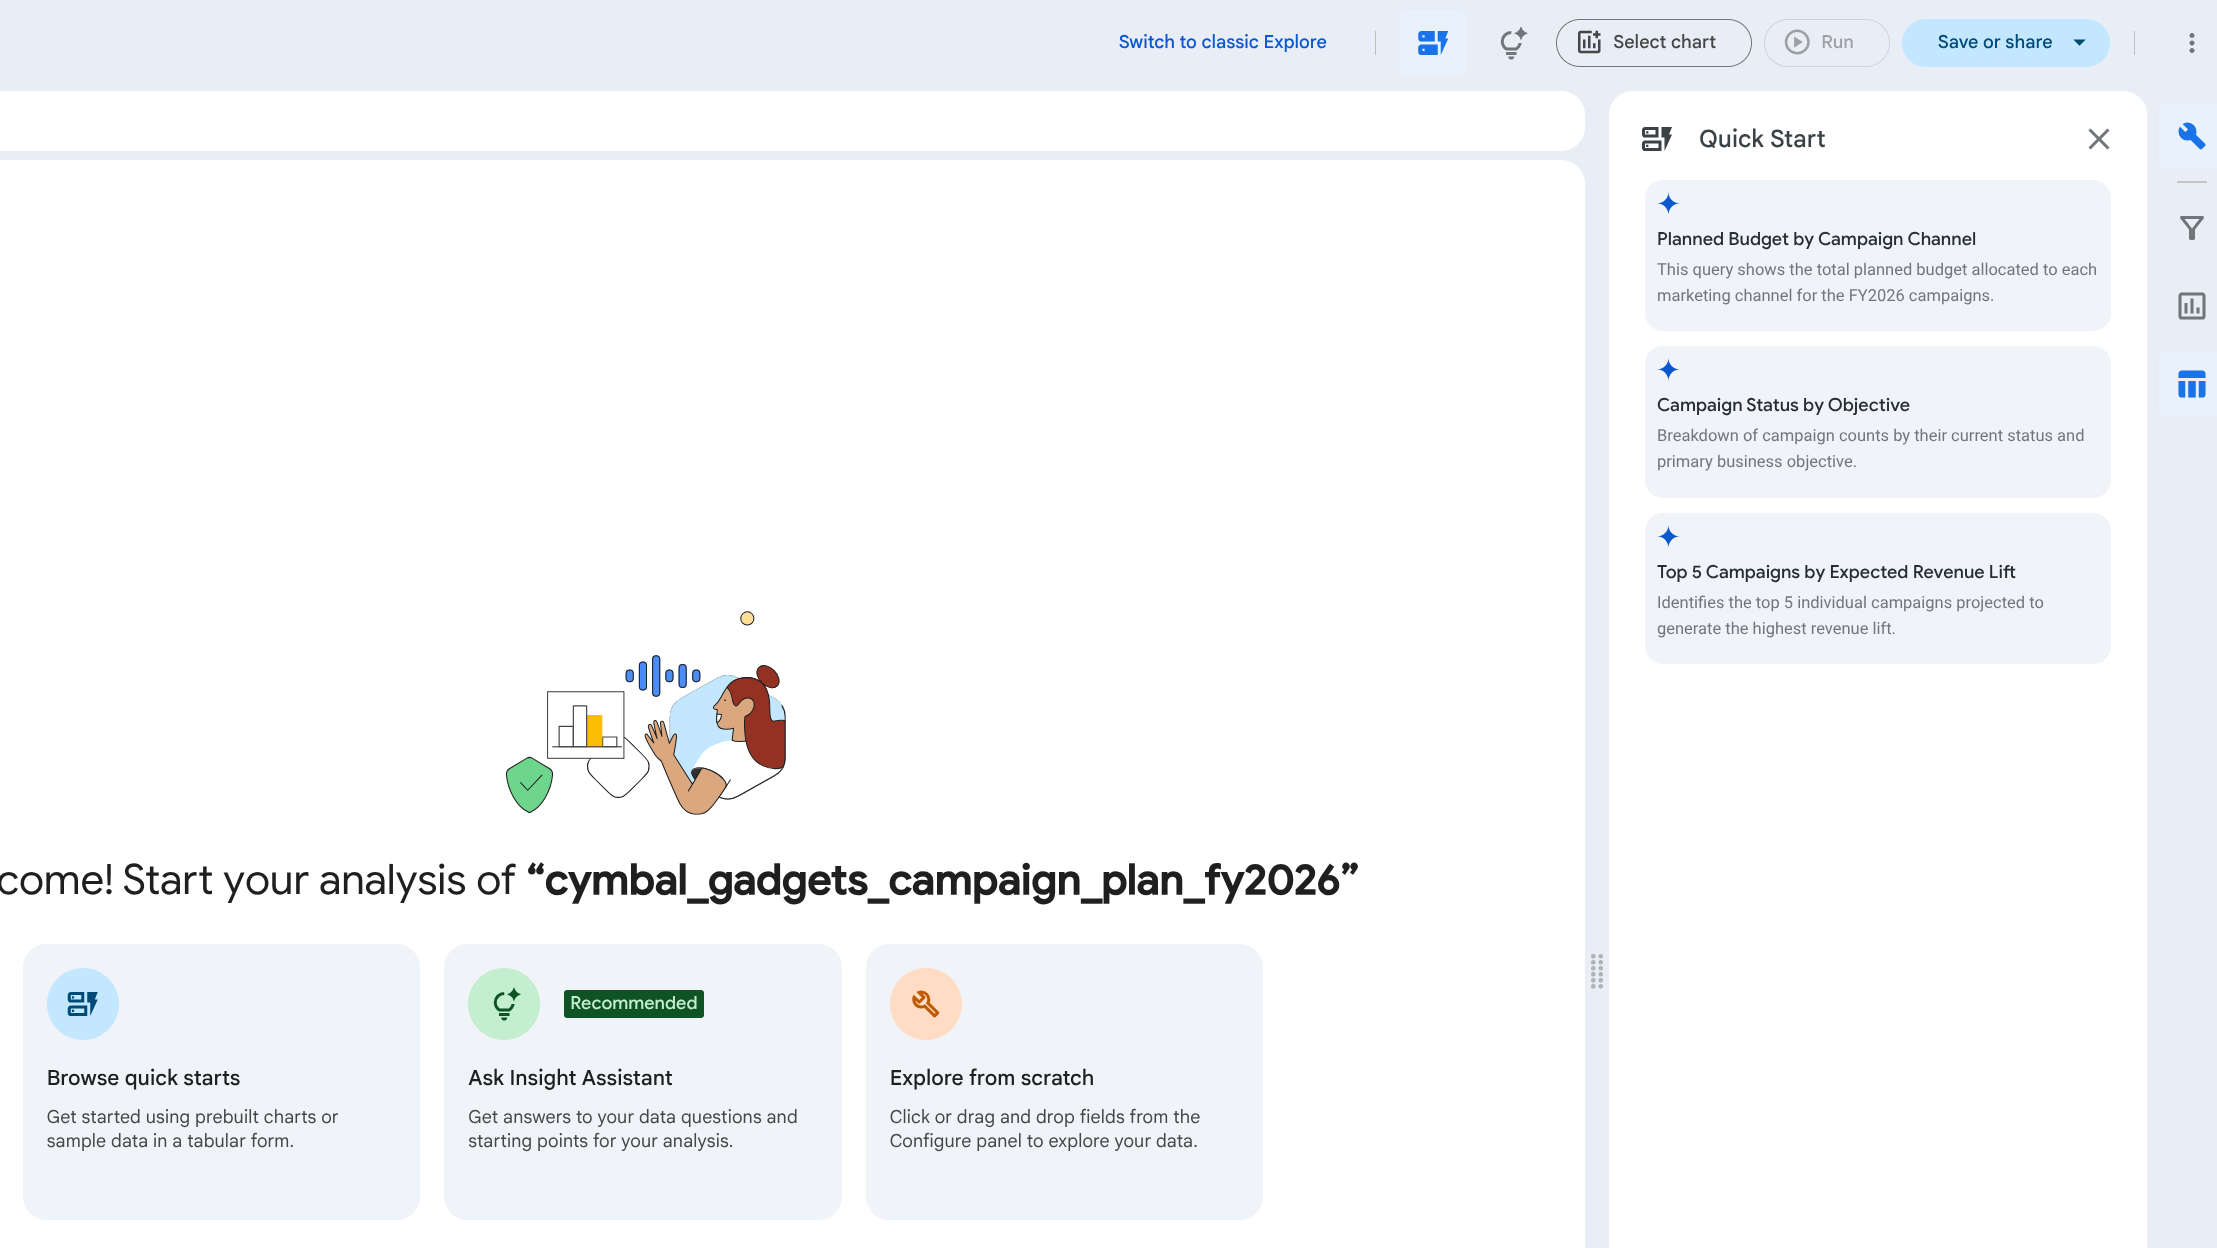
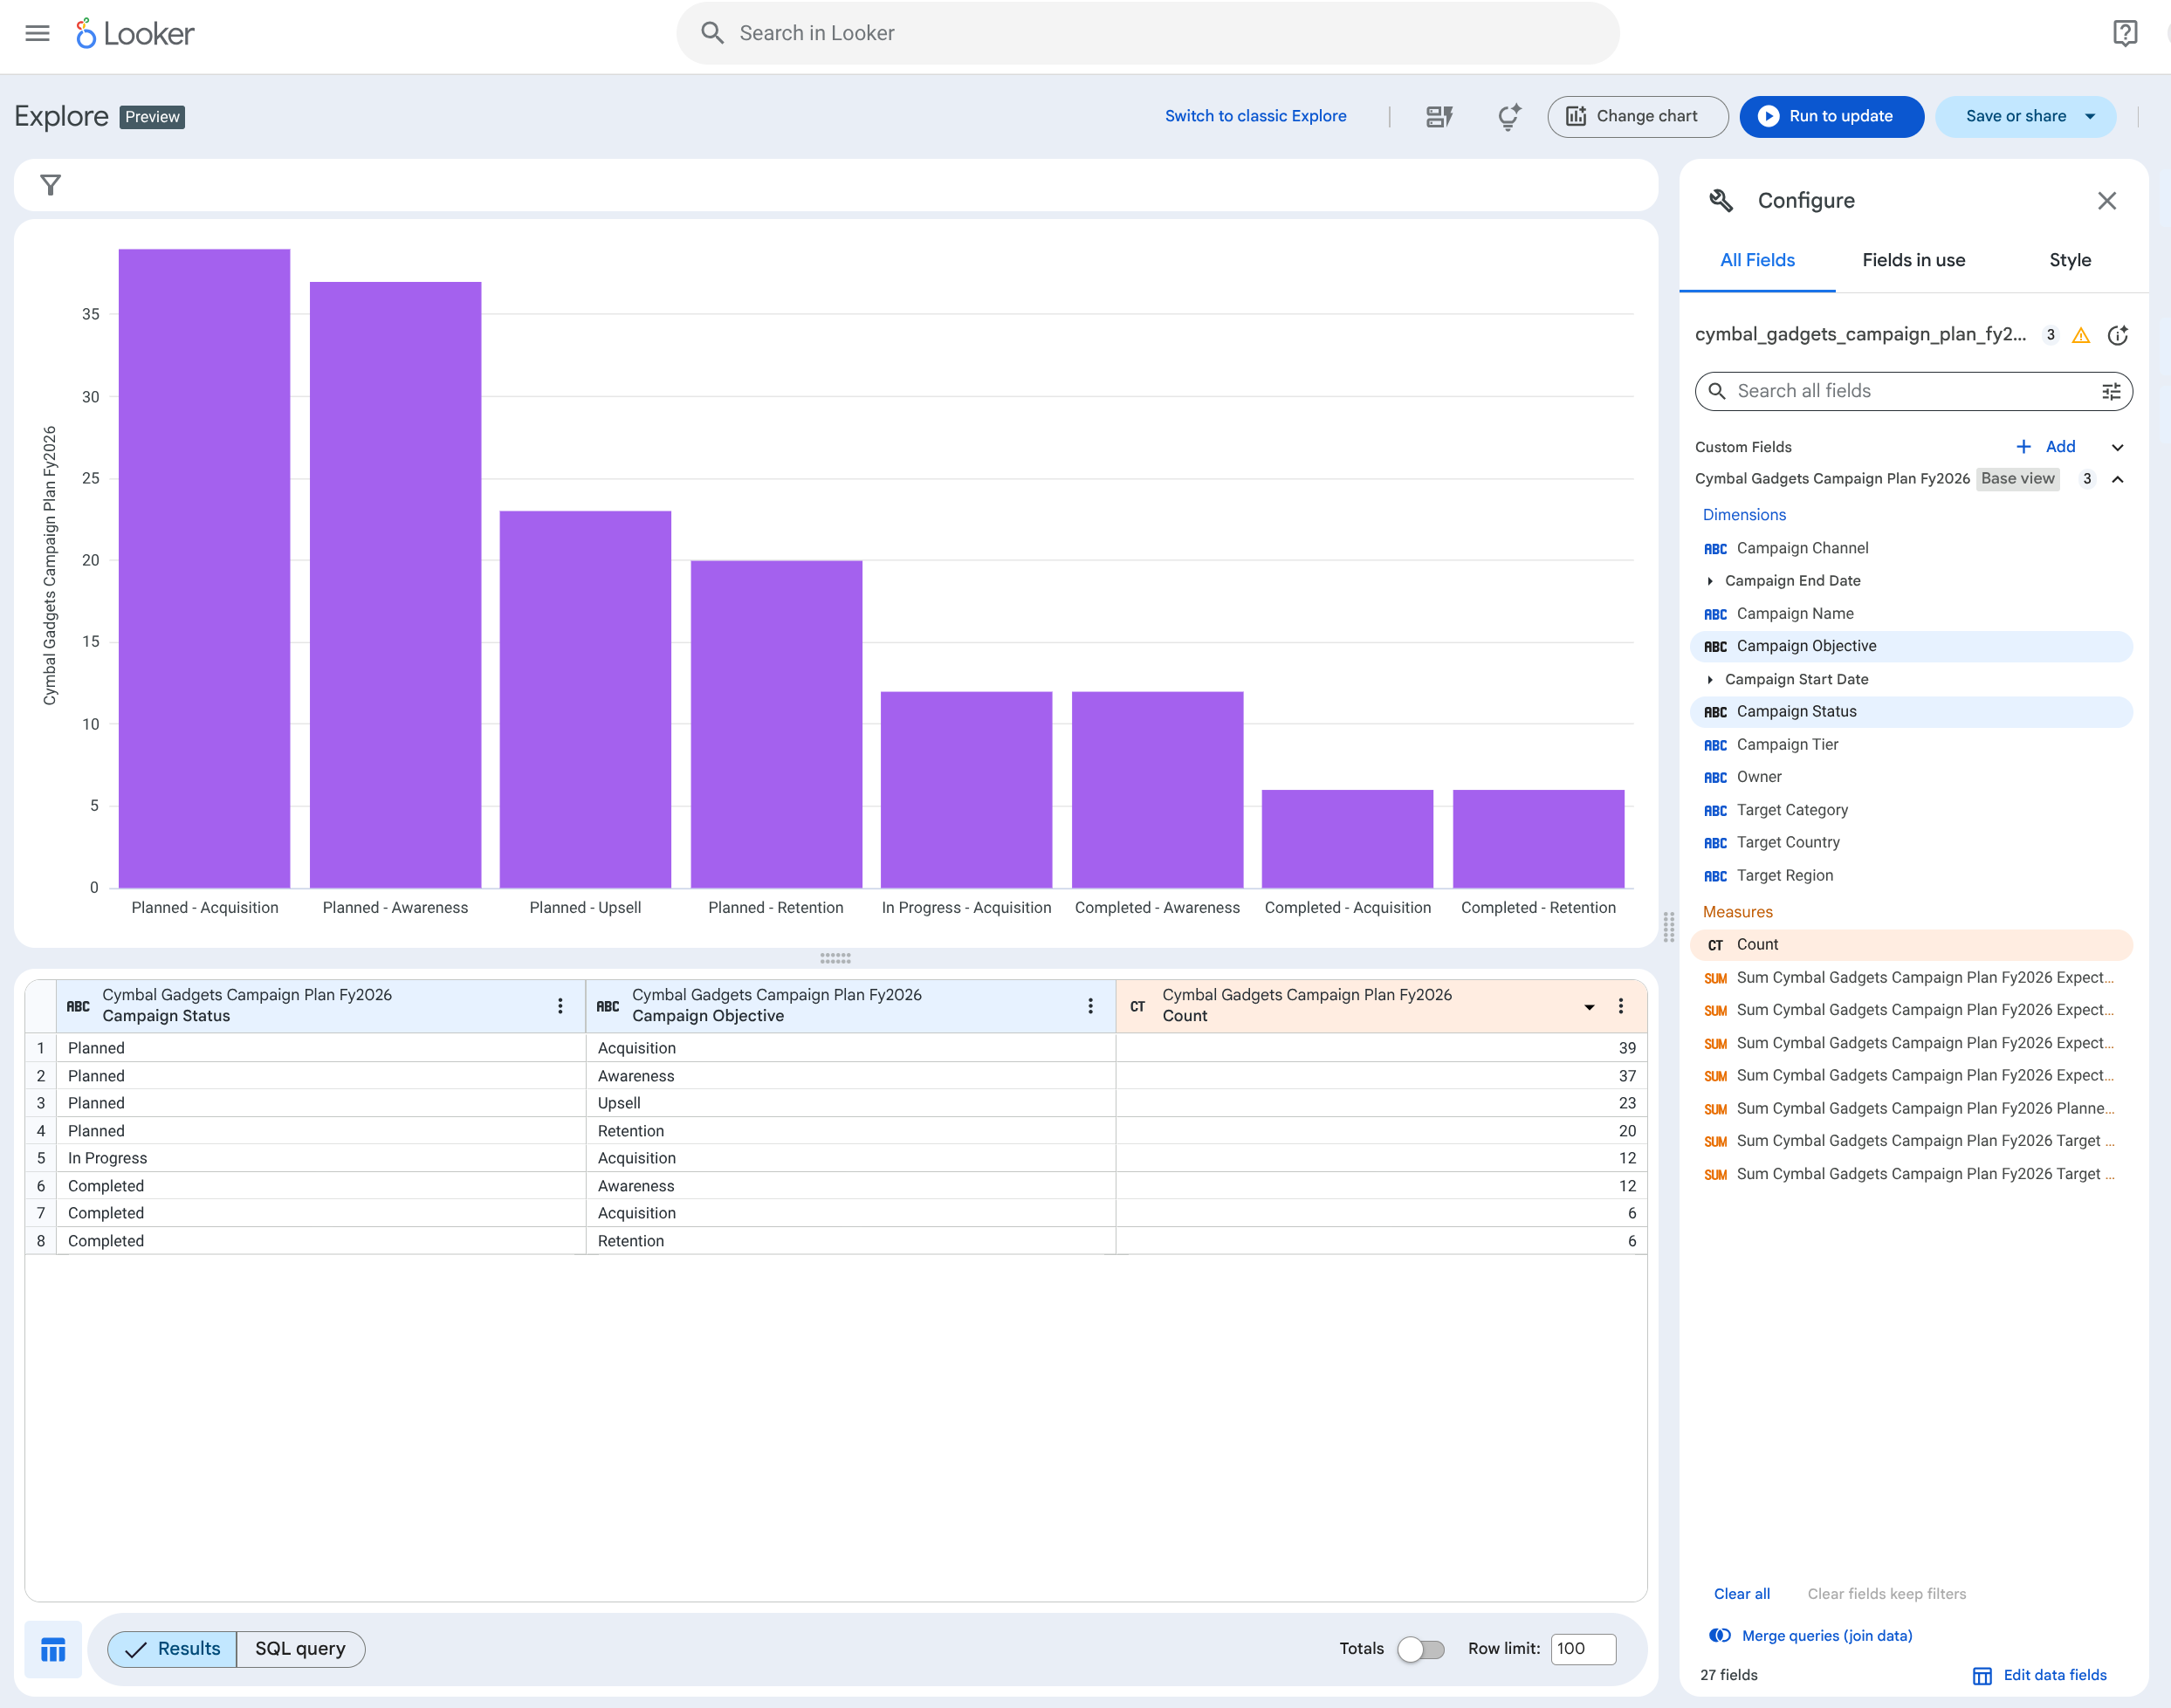
- You will see an updated Explore similar to the following.
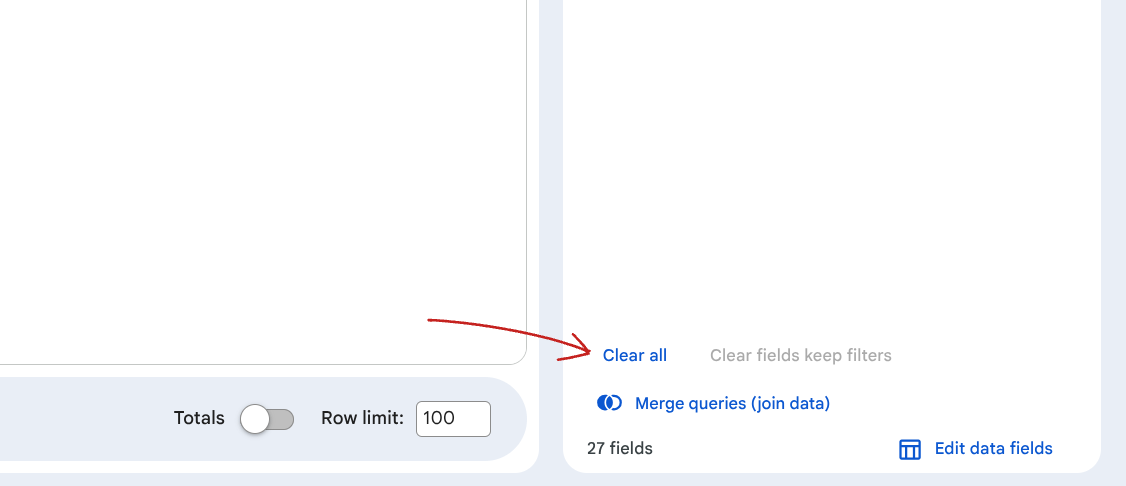
- Click Clear all in the bottom right to clear the Explore.
6. Ask Insight Assistant
Insight Assistant lets you use natural language to generate the Explore for you. It helps you identify relevant fields for discovering insights and answers to your questions using data from this Explore.
- Click Ask Insight Assistant. In the Insight Assistant sidebar, you'll find the prompt area where you can ask specific questions about your data.
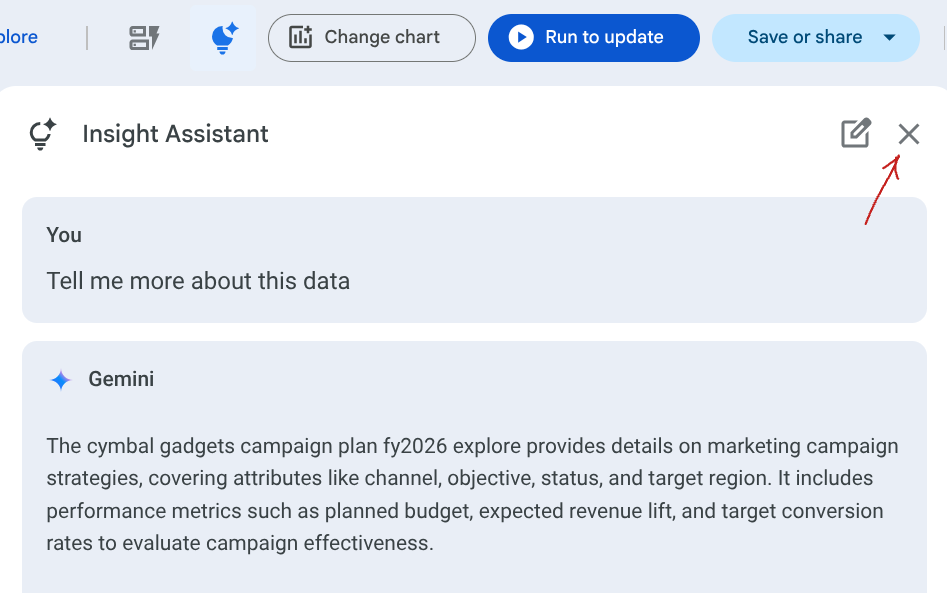
- Click Tell me more about this data.
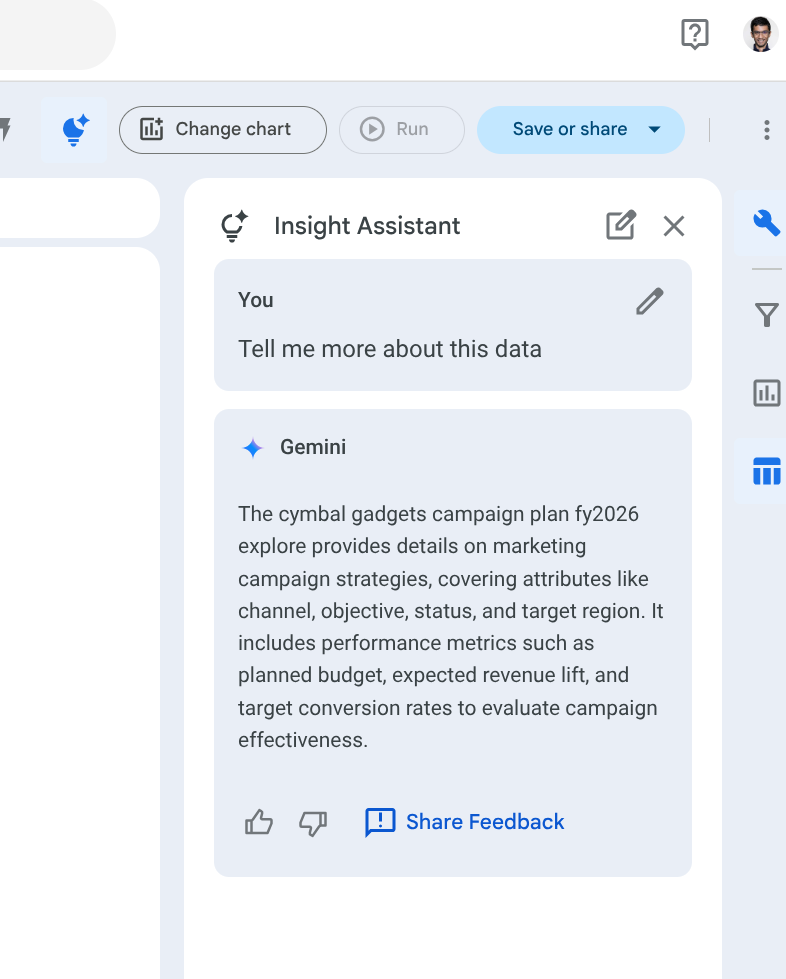
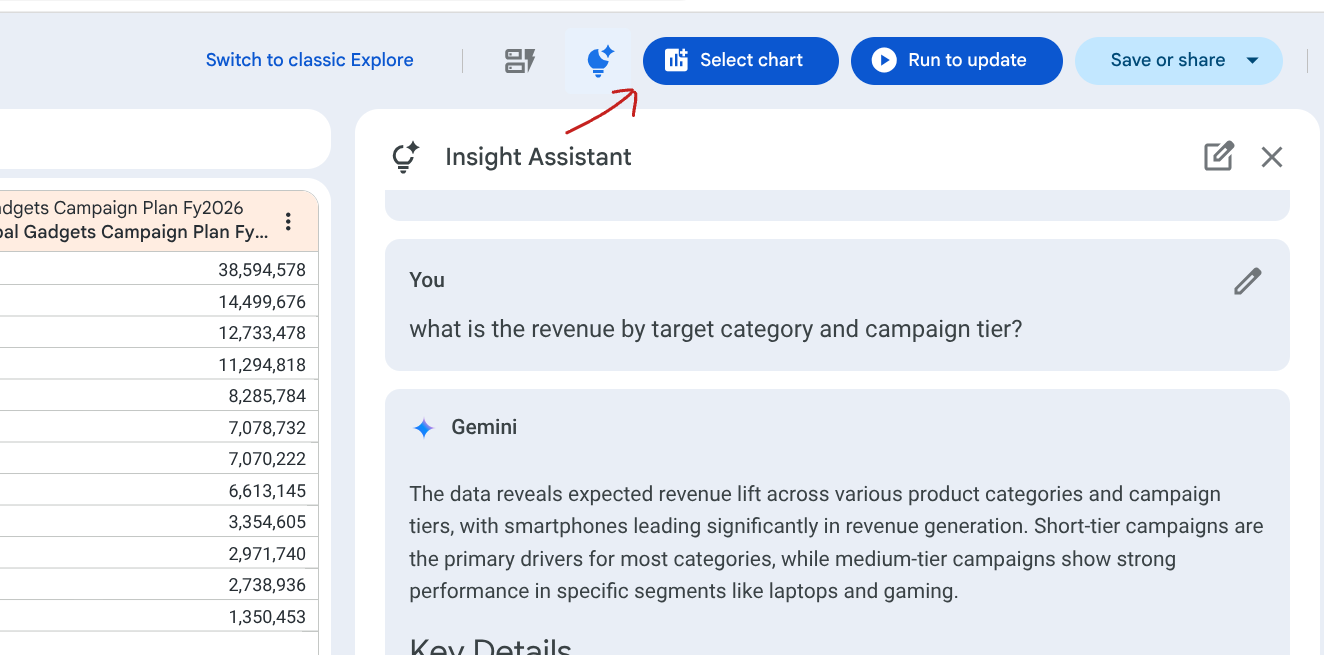
- In the Ask a data question, put in the prompt
what is the revenue by campaign tier?. The Insight Assistant will return the answer to your question, showing key details in your data that it used to generate the response, and a list of fields from your Explore that it used. It should look like this: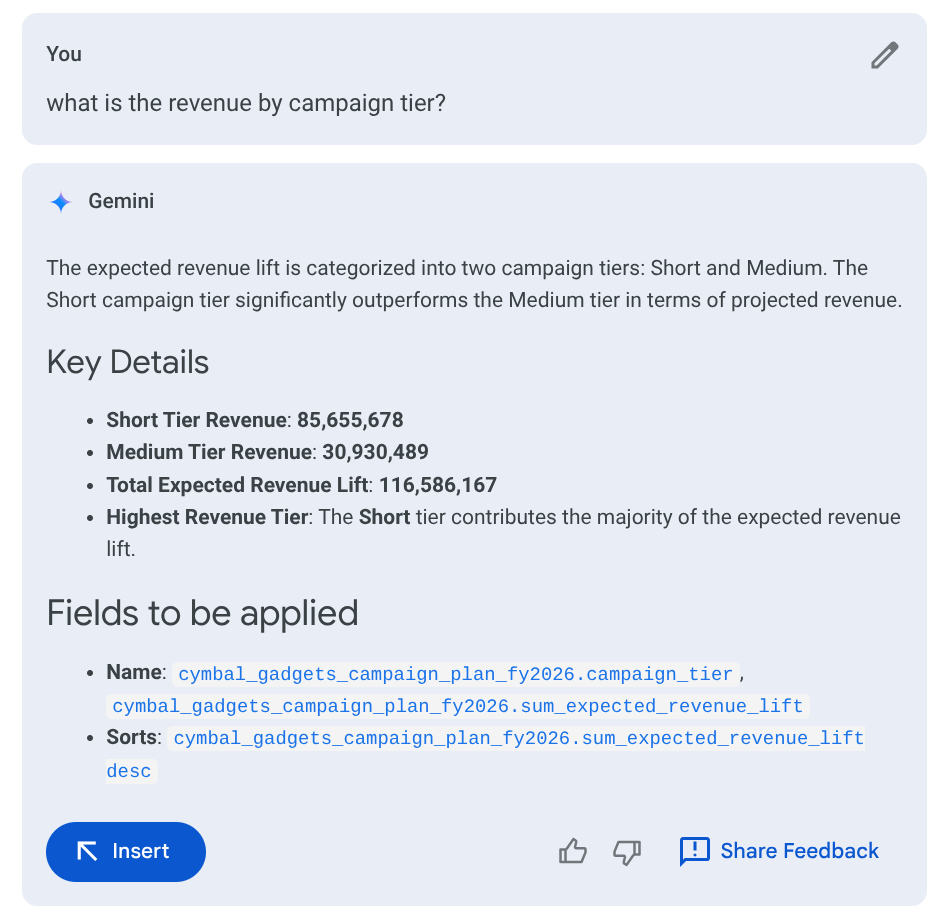
- Click Insert to generate an Explore based on the identified fields. You should see your data table.
- Now click Select chart and click Bar. You will see a bar chart based on the Explore data.
- Click the X icon to close the Insight Assistant.
- Click Clear all in the bottom right again to clear the Explore.
7. Explore from scratch
- Click Explore from scratch. The current state of the interface is similar to the classic manual Explore. To build your analysis from scratch, use the Configure panel to drag the specific fields you need.
- Select Campaign Channel from Dimensions.
- Select Planned Budget from Measures.
- Click Run to update. You will see the updated data table.
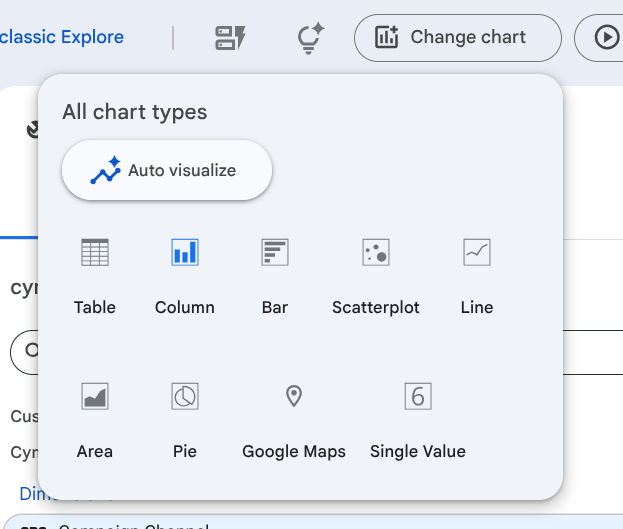
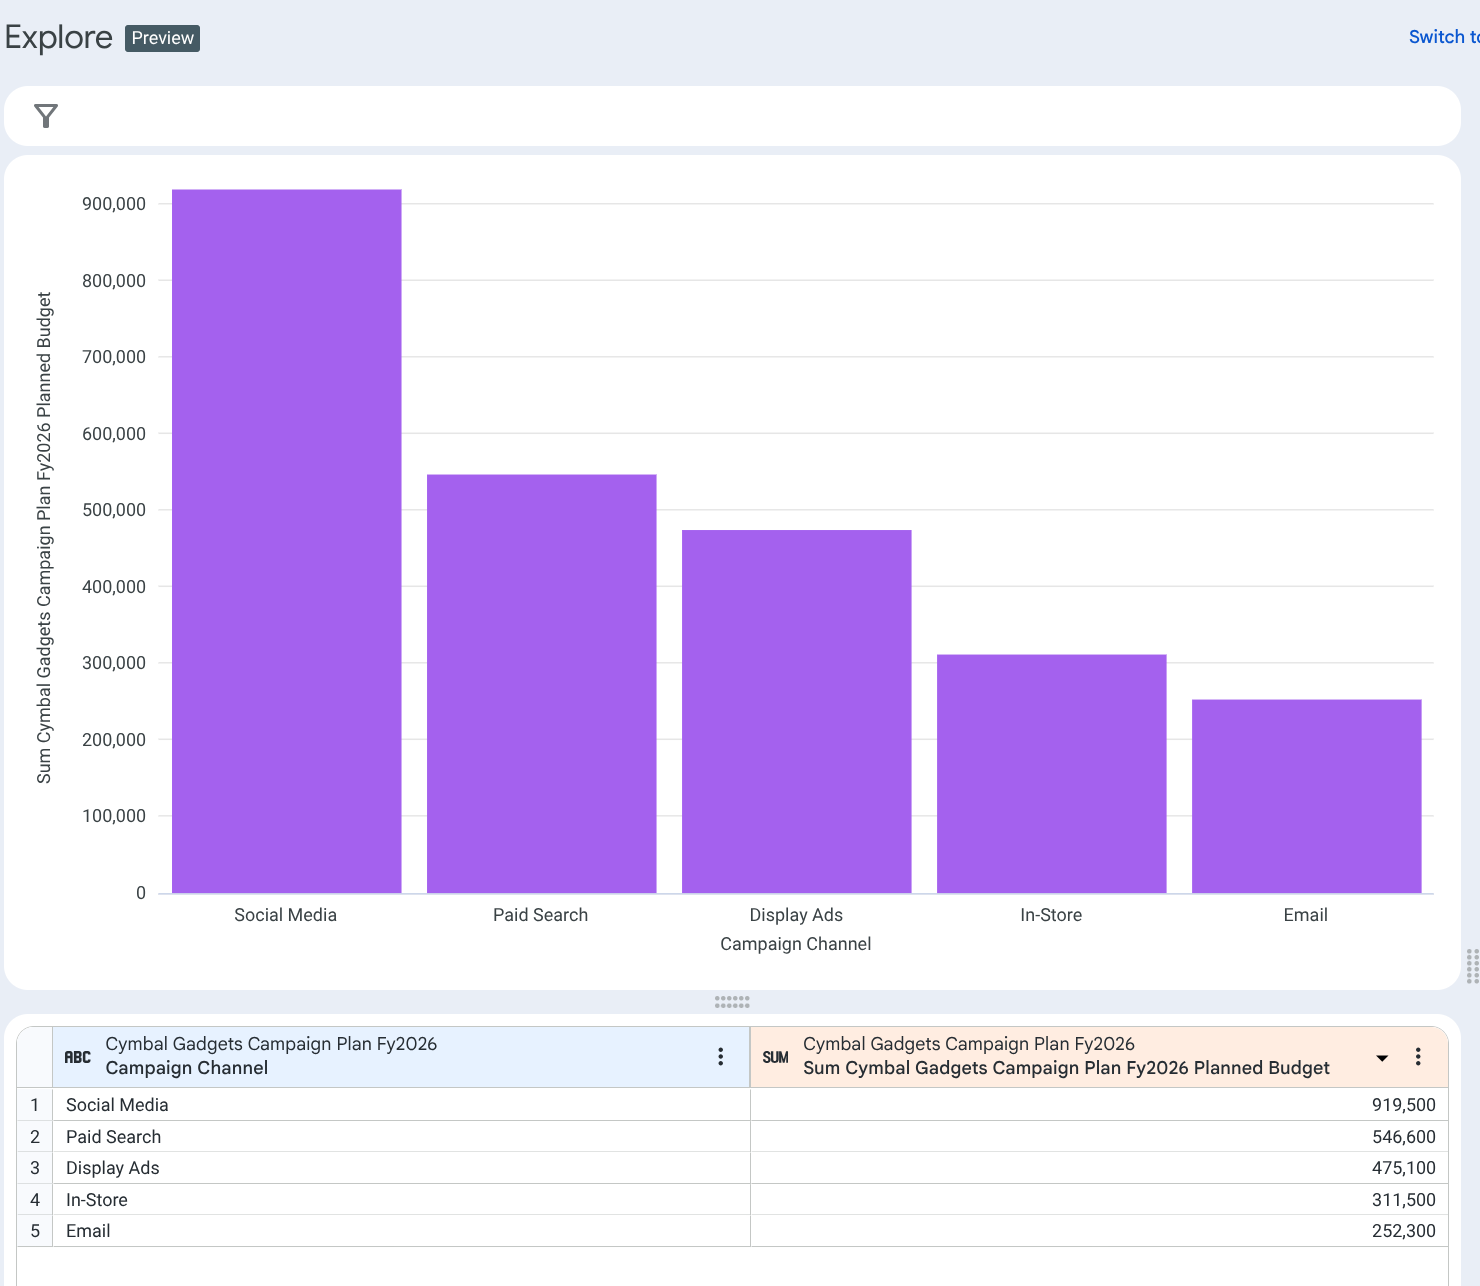
- Click Change Chart > Auto visualize. Looker will use Gemini to automatically pick a chart for you.
- You should see a chart similar to this:
8. Clean-up instructions (Optional)
You will need Admin access on the Looker instance to complete these steps.
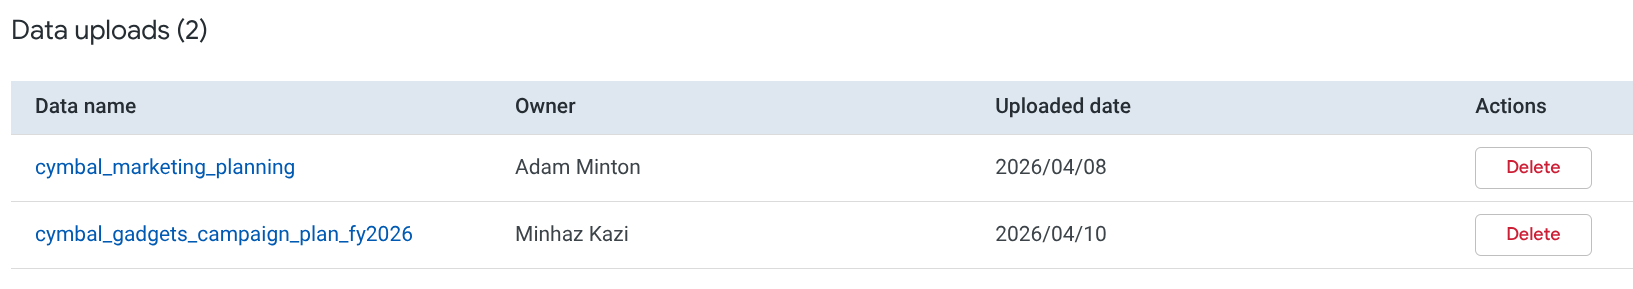
- Click the Admin menu in the Looker Homepage left panel and click Self-service Explores.
- Click the Delete button next to the dataset you just uploaded. Click Delete again to confirm.
9. Congratulations
Congratulations for completing the codelab.
What we've covered
- Uploaded data to a Looker instance using the self-service Data Upload feature.
- Used Expression Assistant to create a new dimension.
- Explored data using the new Looker Explore interface, including "Browse quick starts", "Ask Insight Assistant", and "Explore from scratch".
- Leveraged Looker's AI capabilities (Insight Assistant and Auto visualize) to quickly generate insights and charts.
Things to try
- Try the features with a Google Sheet.
- Try different options in quick starts
- Try different prompts in Insight Assistant