
1. Before you begin
Dynamic World is a global land-use land-cover (LULC) dataset that's updated nearly in real time. It provides a 10-meter resolution because it uses the Sentinel-2 constellation by the European Space Agency (ESA) and the Copernicus program, which generates an updated global picture of the Earth's surface every 2-to-5 days. It's produced with a deep learning model, Vertex AI, and Earth Engine, which is a geospatial-analysis platform. It helps scientists, researchers, and developers detect changes, map trends, and quantify differences on the Earth's surface.
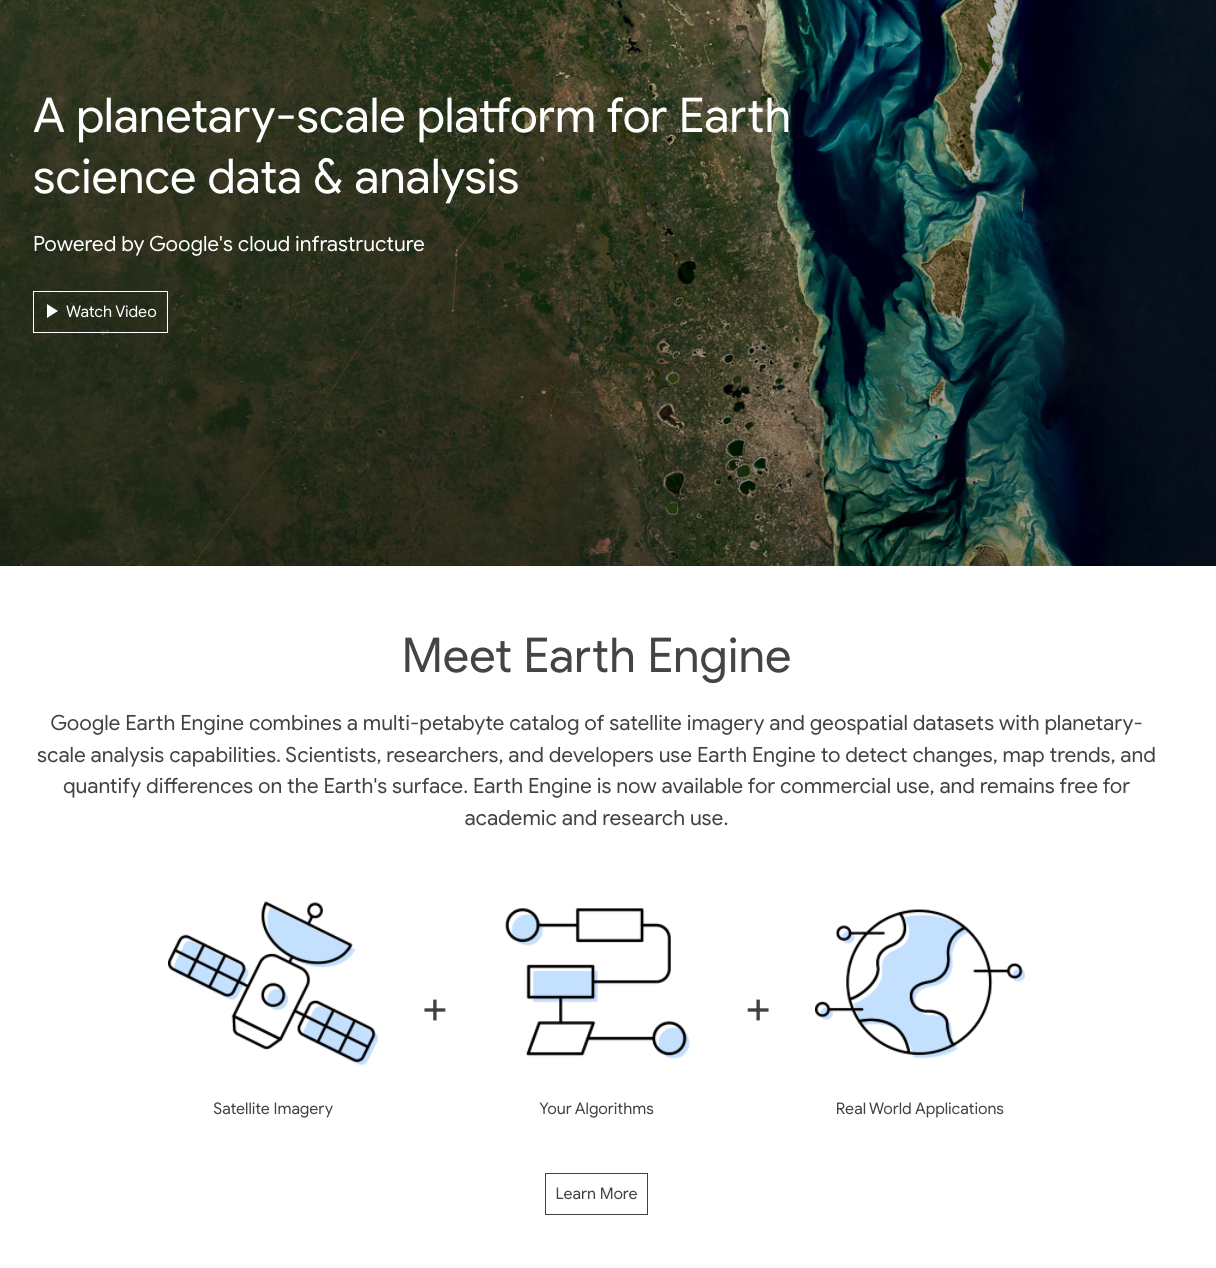
Earth Engine is a tool that seeks to advance scientific knowledge of planetary processes to further environmental and social benefit. Its commercial use, in preview with Google Cloud, states that its primary purpose is to understand and tackle critical sustainability and climate issues, such as deforestation, water management, and sustainable land use.
In this codelab, you apply responsible practices in the generation of machine learning-derived datasets, such as Dynamic World.
What you'll learn
- How to apply responsible AI practices in remote-sensing apps.
- How to visually interpret Dynamic World predictions over space and time.
- How to reflect on ethical implications and downstream societal implications.
What you'll need
- Familiarity with how to navigate the Earth Engine Apps.
- Google Chrome, which works best with the Earth Engine Apps.
2. Open the Dynamic World Earth Engine app
The Dynamic World dataset contains per-pixel predictions of nine LULC classes as described in this table. Land use describes how humans use the land, whereas land cover describes the physical material on the surface of the Earth.
LULC type | Description |
Water | Permanent and seasonal water bodies |
Trees | Primary and secondary forests, and large-scale plantations |
Grass | Natural grasslands, livestock pastures, and parks |
Flooded vegetation | Mangroves and other inundated ecosystems |
Crops | Row crops and paddy crops |
Shrub and scrub | Sparse-to-dense open vegetation that consists of shrubs |
Built area | Low- and high-density buildings, roads, and urban open space |
Bare ground | Deserts and exposed rock |
Snow and ice | Permanent and seasonal snow cover |
Images in this dataset include 10 bands: nine bands with estimated probabilities for each of the nine LULC classes and a class label band that indicates the class with the largest estimated probability. These distinct properties let users do multitemporal analysis and create custom products suited to their needs.
To open the Dynamic World Earth Engine App:
- Open another tab in your browser,
- Navigate to Dynamic World.
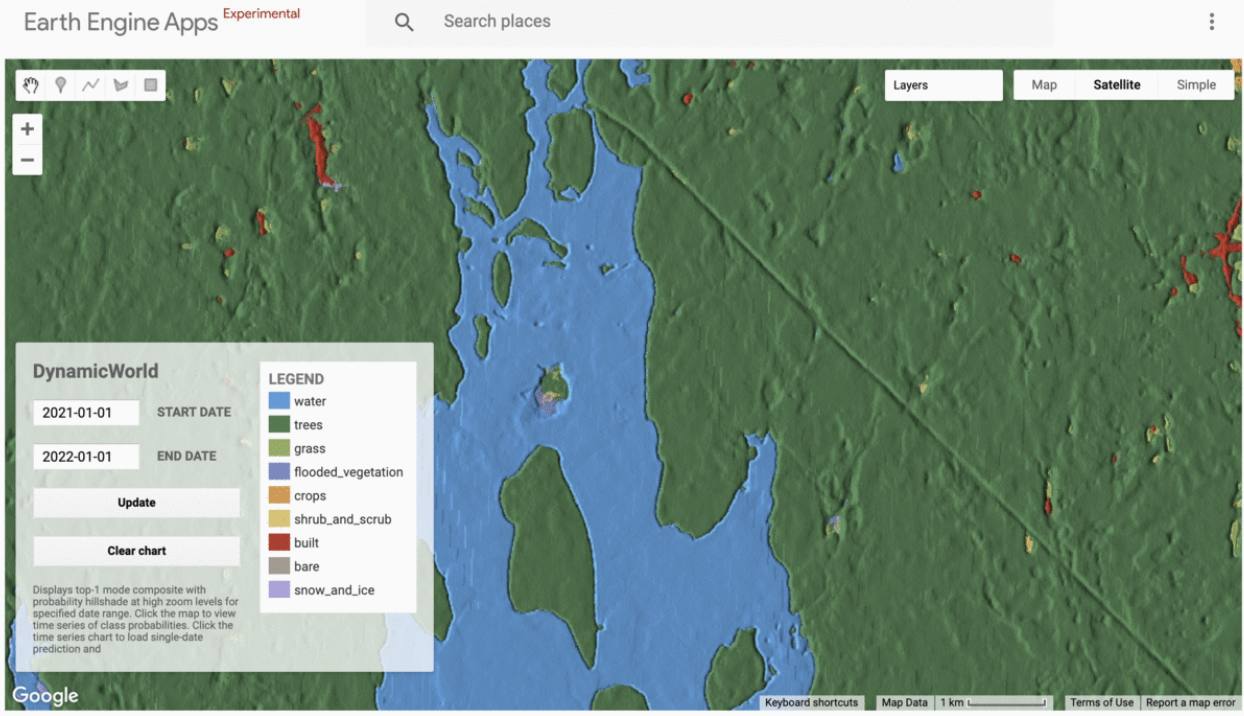
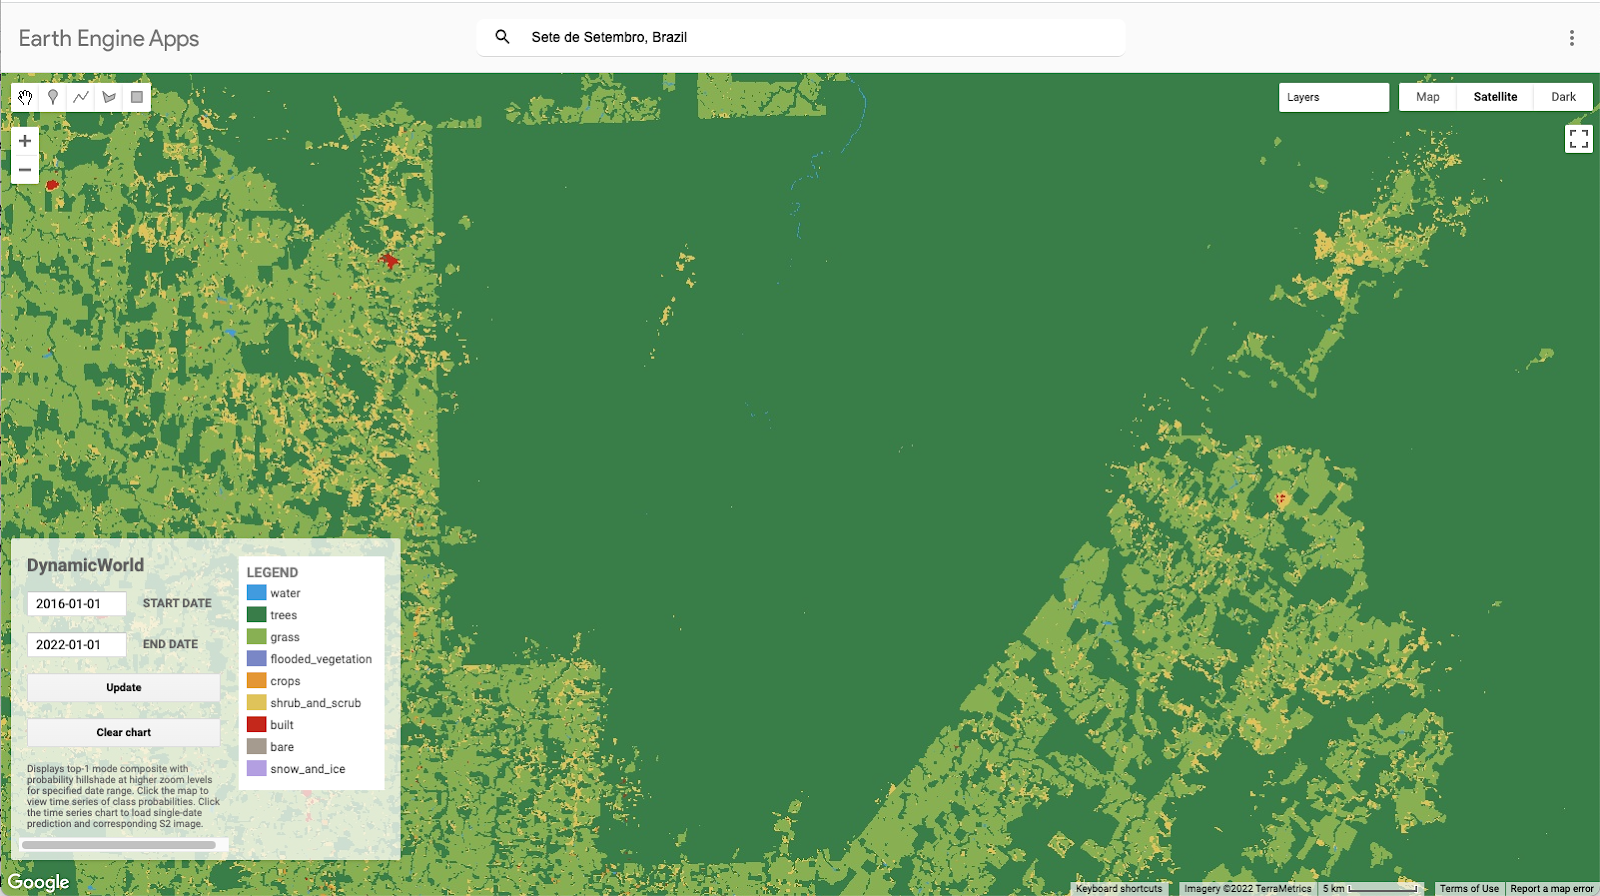
The map displays Top1 mode mosaic with hillshade at high zoom levels.
- Click the map to view a chart that displays class probabilities over time.
- Click a datapoint on the chart to load a specific prediction and its Sentinel-2 image.
- In the Layers pane, adjust the layers and visibility.
3. Explore Dynamic World predictions in Brazil
Dynamic World includes predictions across all nine LULC classes and displays a single Top1 label for each pixel. The real world is a mix of many LULC classes at any spatial resolution. In this section, you visually interpret predictions over space and time.
To explore Dynamic World predictions in Brazil:
- In your browser, navigate to the Dynamic World EE app.
- In the Search places field, enter
Sete de Setembro, Brazil.
You should see Dynamic World compute data for the indigenous territory of the Paiter Surui people, who live in the Sete de Setembro region of Rondônia, Brazil.
- In the Dynamic World pane, enter
2016-01-01in the Start date field and2022-01-01in the End date field, and then click Update.
The map may take a few minutes to load because it computes in real time.
- Click anywhere on the map to generate a chart in real time.
You can zoom further in for a faster response.
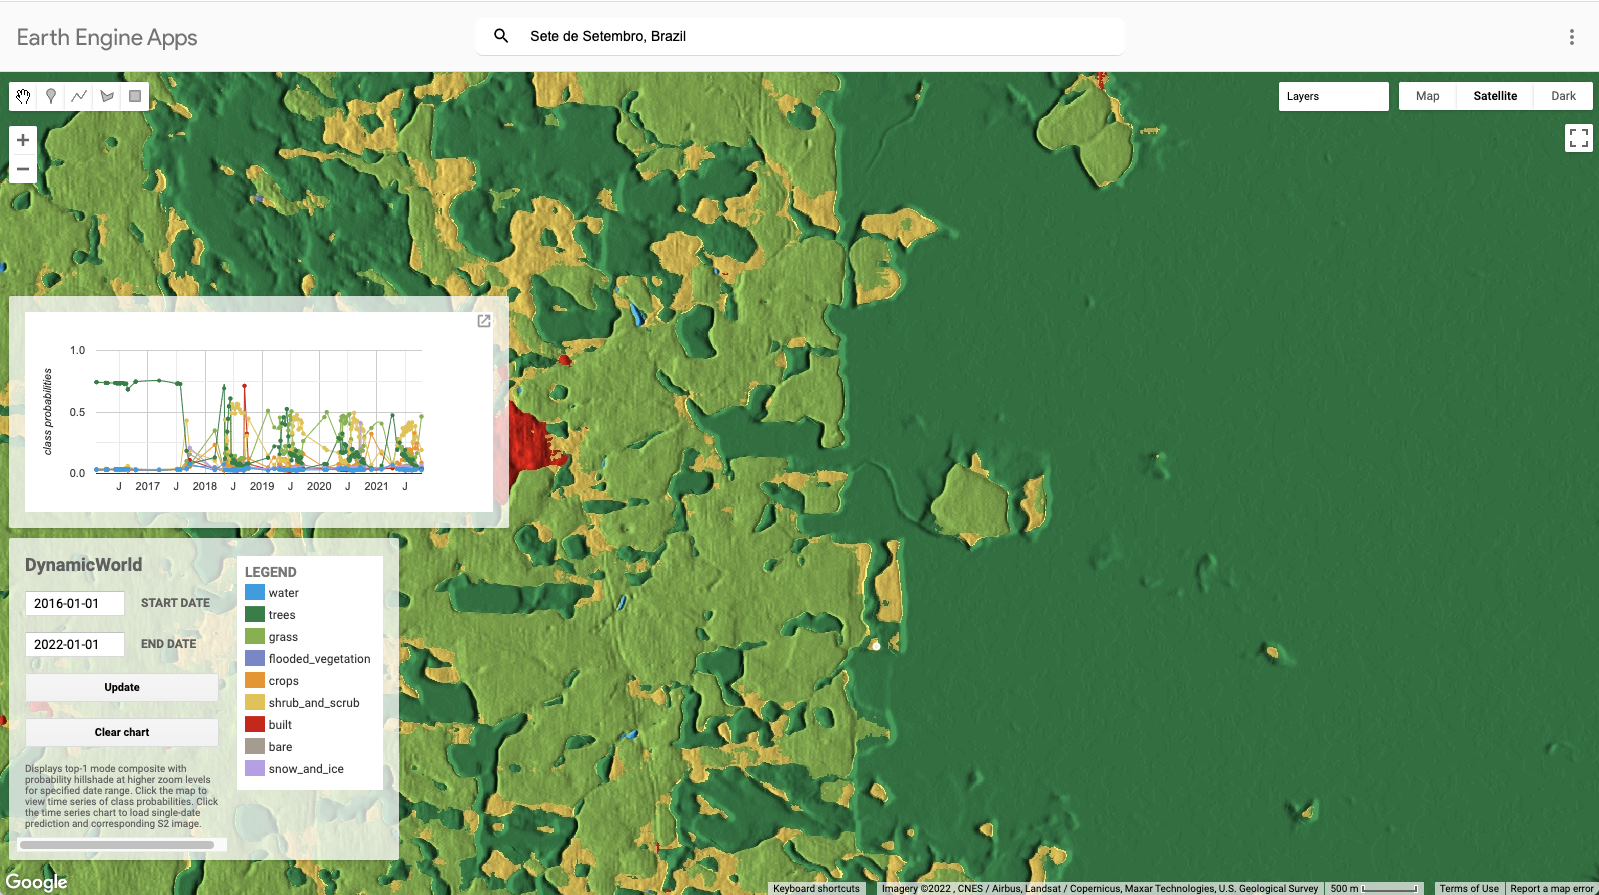
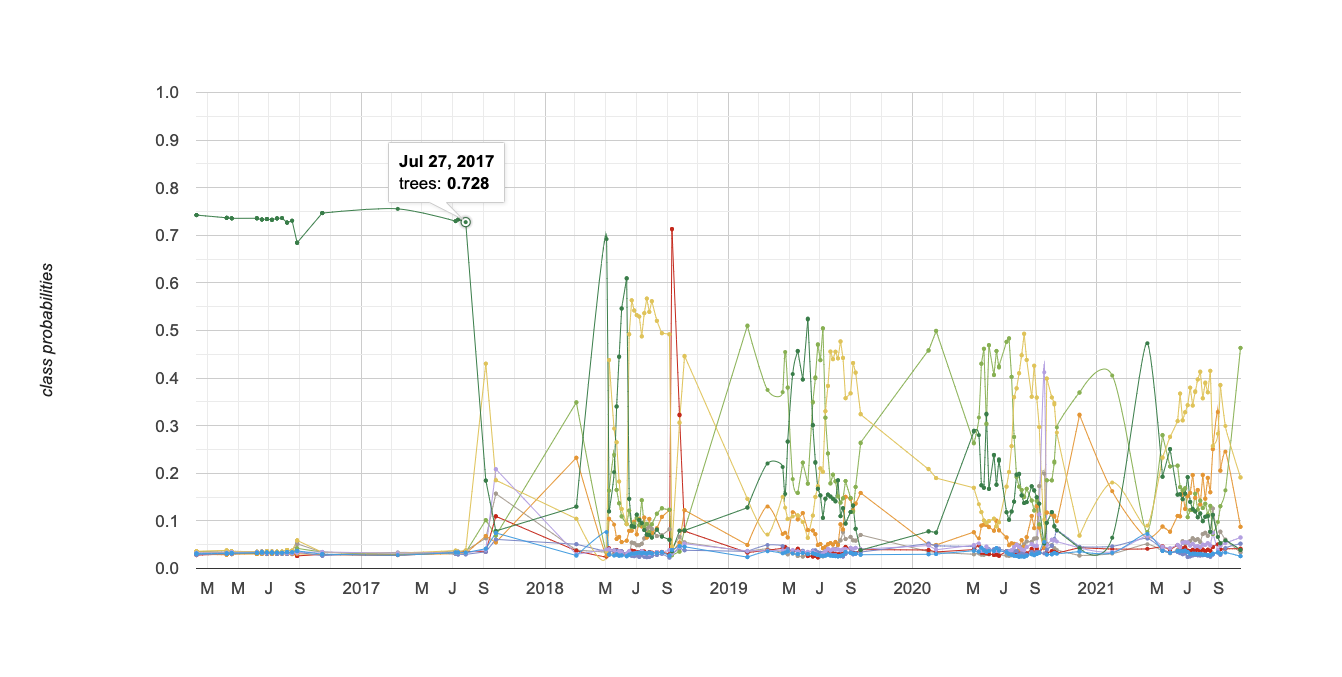
- Examine the chart in which class probabilities are on the y axis and time is on the x axis.
In this example, the Top1 class prediction from Jan 1, 2016 to July 27, 2017 is trees, which varies from a probability of 0.684 to 0.755. By the time the next Sentinel-2 scene is captured on Sept. 5, 2017, the prediction is no longer trees and the signal becomes much noisier.
- Click
 to enlarge the chart.
4. Congratulations
You learned how to apply responsible AI principles in the generation of ML-derived datasets, such as Dynamic World.