
1. Introduction
Last Updated: 2022-9-22
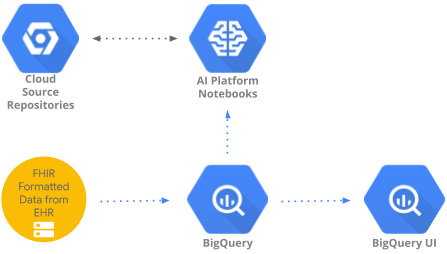
This codelab implements a pattern to access and analyze healthcare data aggregated in BigQuery using BigQueryUI and AI Platform Notebooks. It illustrates data exploration of large healthcare datasets using familiar tools like Pandas, Matplotlib, etc. in a HIPPA compliant AI Platform Notebooks. The "trick" is to do the first part of your aggregation in BigQuery, get back a Pandas dataset and then work with the smaller Pandas dataset locally. AI Platform Notebooks provides a managed Jupyter experience and so you don't need to run notebook servers yourself. AI Platform Notebooks is well integrated with other GCP services like Big Query and Cloud Storage which makes it quick and simple to start your Data Analytics and ML journey on Google Cloud Platform.
In this code lab you will learn to:
- Develop and test SQL queries using BigQuery UI.
- Create and launch an AI Platform Notebooks instance in GCP.
- Execute SQL queries from the notebook and store query results in Pandas DataFrame.
- Create charts and graphs using Matplotlib.
- Commit and push the notebook to a Cloud Source Repository in GCP.
What do you need to run this codelab?
- You need access to a GCP Project.
- You need to be assigned an Owner role for the GCP Project.
- You need a healthcare dataset in BigQuery.
If you don't have a GCP Project, follow these steps to create a new GCP Project.
2. Project setup
For this codelab, we will use an existing dataset in BigQuery (hcls-testing-data.fhir_20k_patients_analytics). This dataset is pre-populated with synthetic healthcare data.
Get access to the synthetic dataset
- From the email address you are using to login to Cloud Console, send an email to hcls-solutions-external+subscribe@google.com requesting to join.
- You will receive an email with instructions on how to confirm the action.
- Use the option to respond to the email to join the group. DO NOT click the
 button.
 - Once you receive the confirmation email, you can proceed to the next step in the codelab.
Pin the project
- In GCP Console, select your project, then navigate to BigQuery.
- Click the +ADD DATA dropdown, and select "Pin a project" > "Enter project name" .
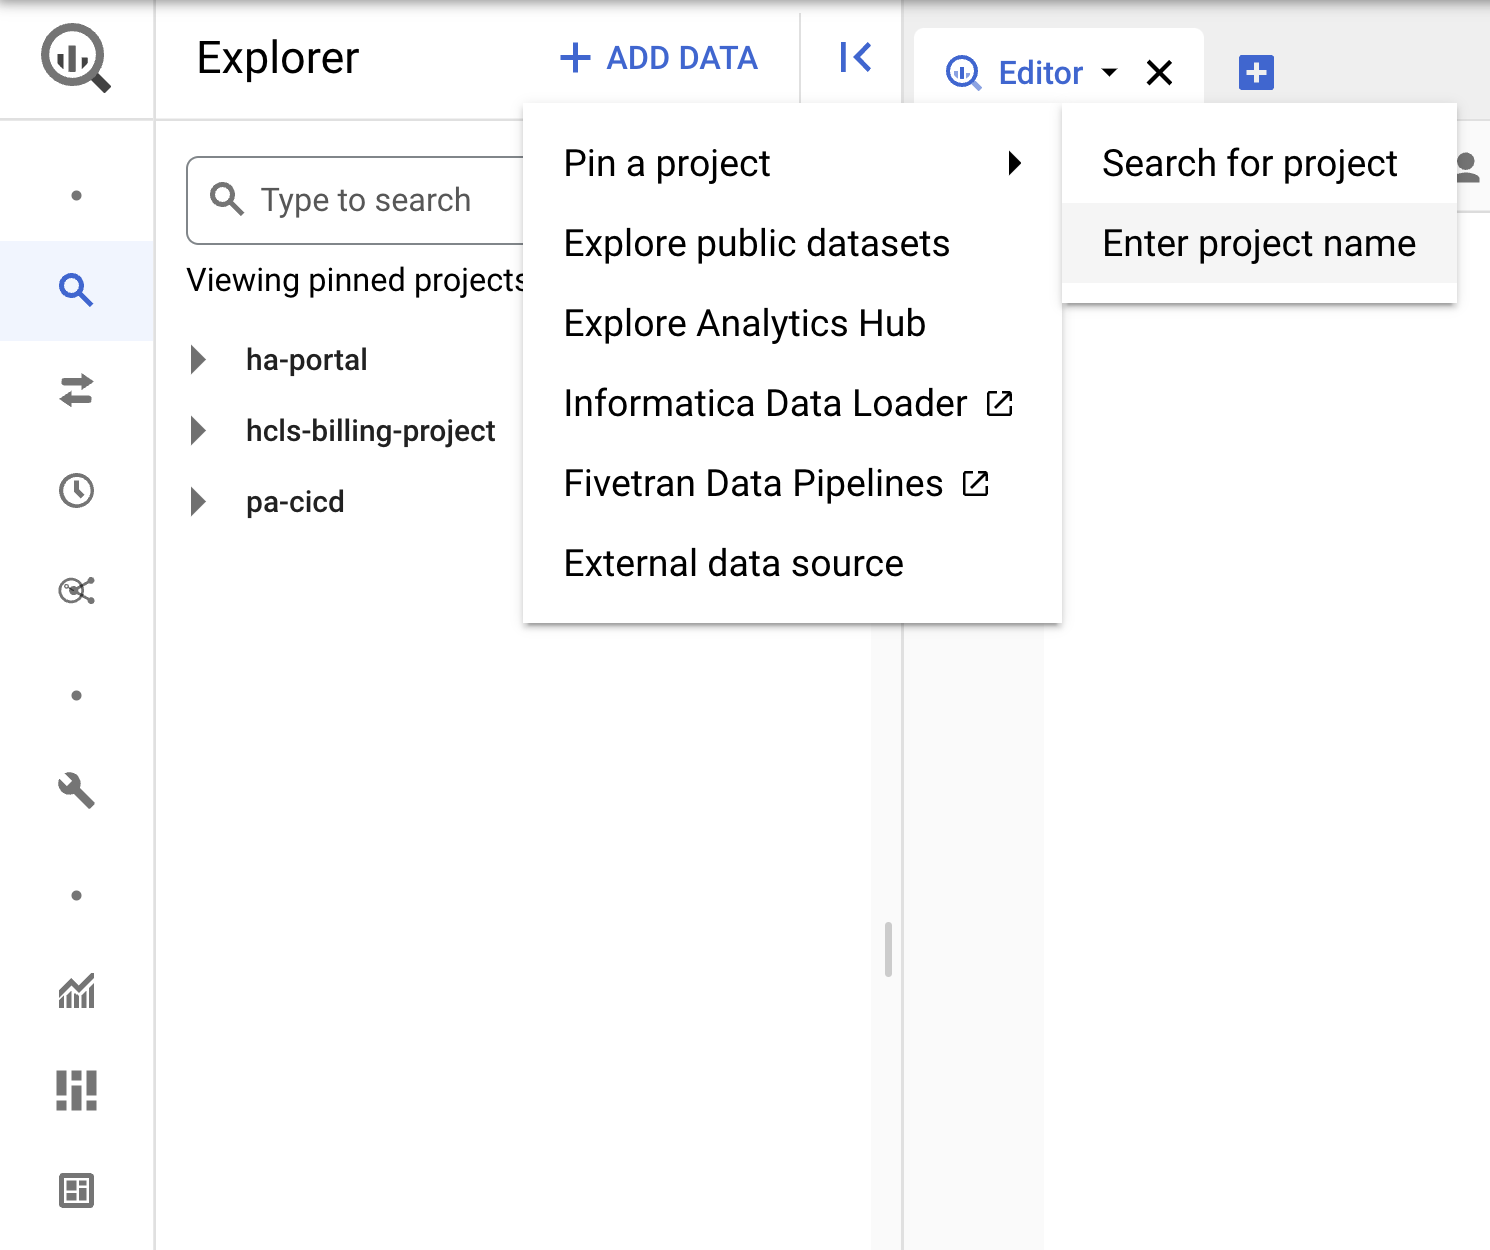
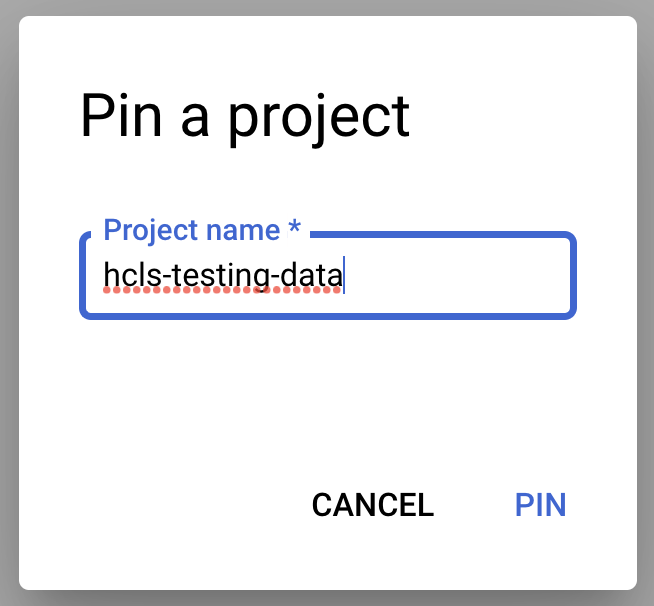
- Enter the project name, "hcls-testing-data", then click PIN. The BigQuery test dataset "fhir_20k_patients_analytics" is available for use.
3. Develop queries using BigQuery UI
BigQuery UI setting
- Navigate to the BigQuery console by selecting BigQuery from the top-left-corner ("hamburger") GCP menu.
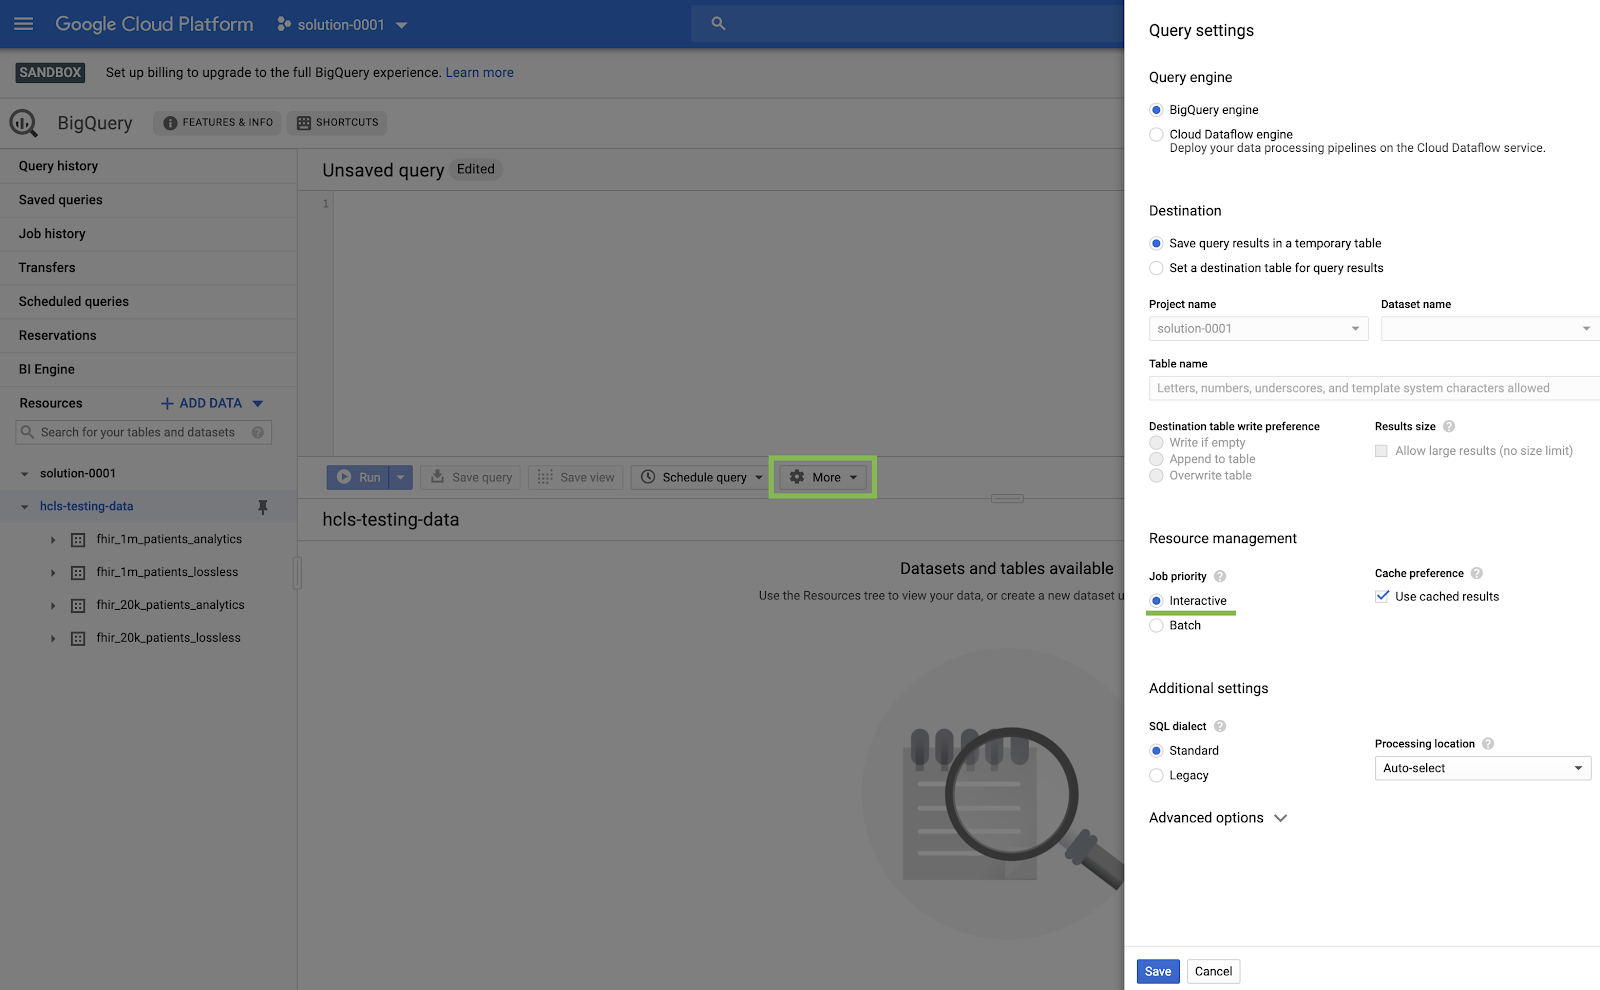
- In the BigQuery console, click More → Query settings and ensure that the Legacy SQL menu is NOT checked (we will be using Standard SQL).
Build Queries
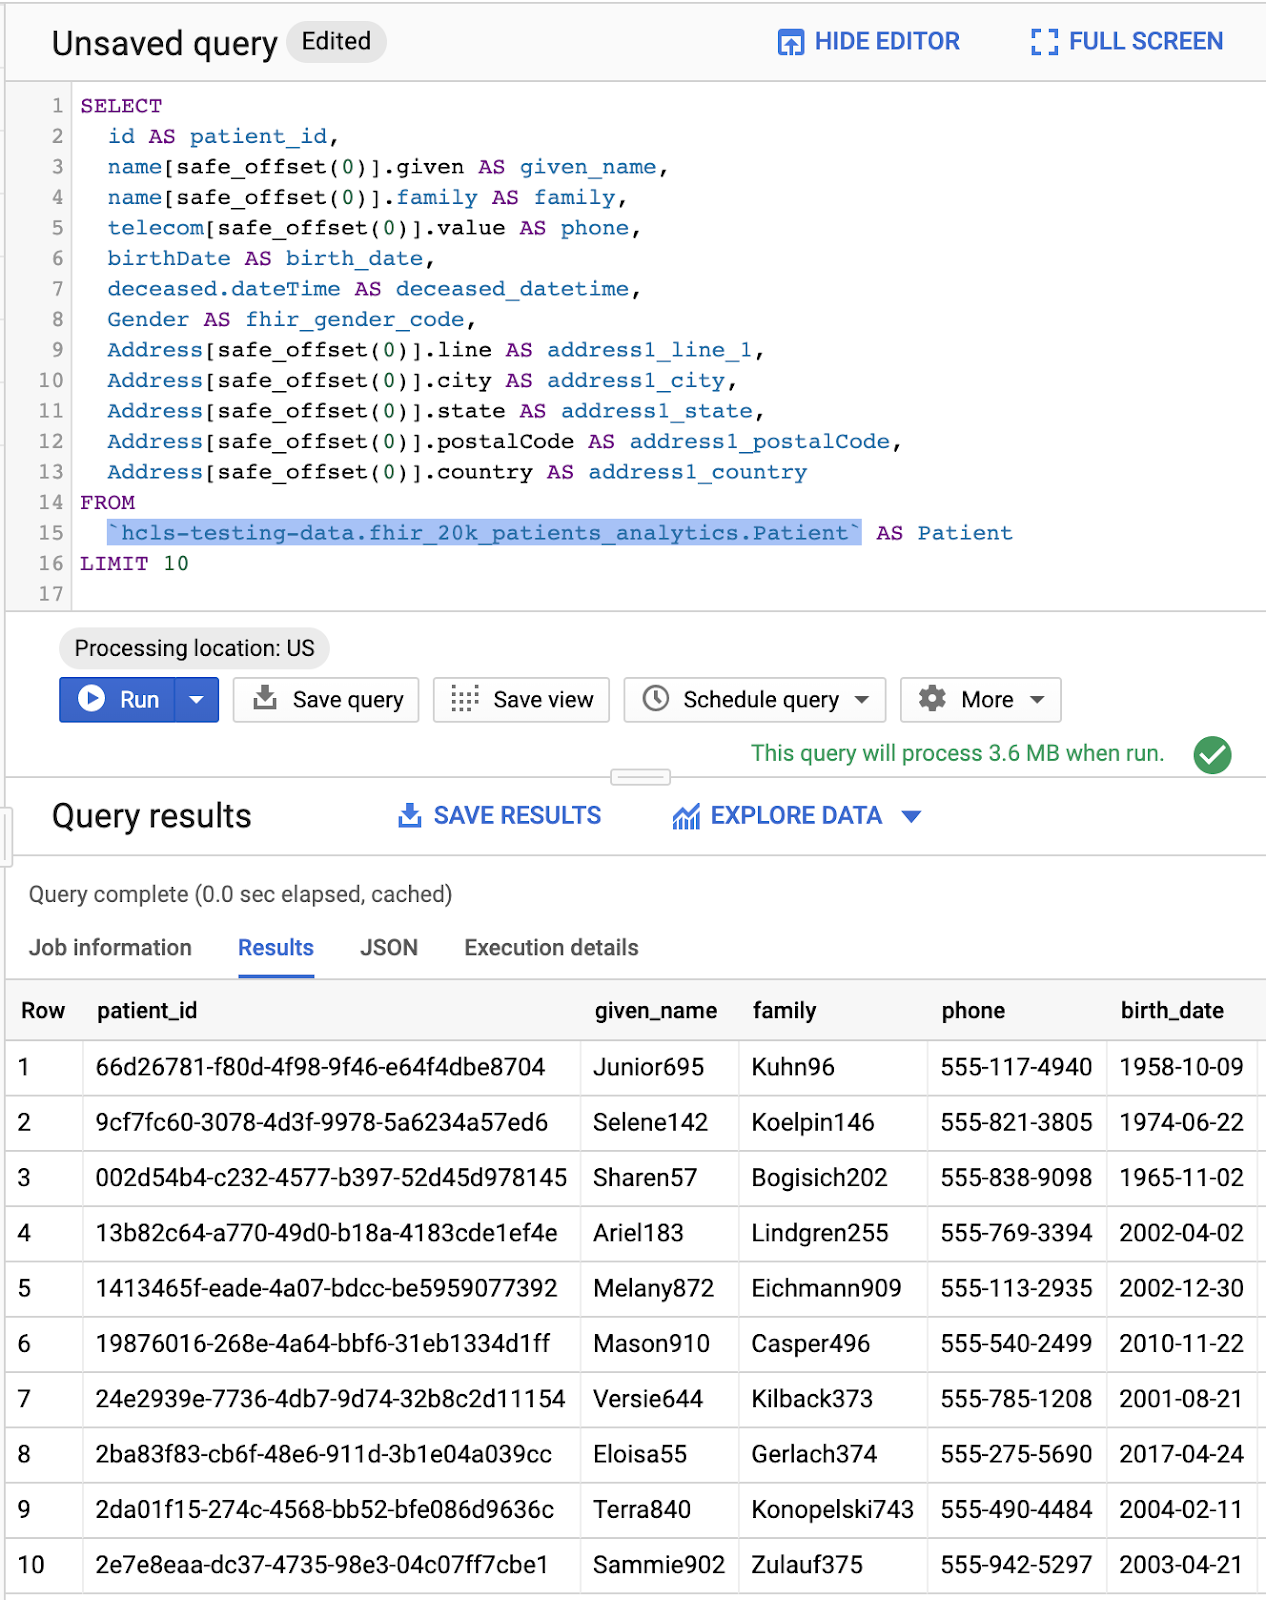
In the Query editor window, type the following query and click "Run" to execute it. Then, view the results in the "Query results" window.
QUERY PATIENTS
#standardSQL - Query Patients
SELECT
  id AS patient_id,
  name[safe_offset(0)].given AS given_name,
  name[safe_offset(0)].family AS family,
  telecom[safe_offset(0)].value AS phone,
  birthDate AS birth_date,
  deceased.dateTime AS deceased_datetime,
  Gender AS fhir_gender_code,
  Address[safe_offset(0)].line AS address1_line_1,
  Address[safe_offset(0)].city AS address1_city,
  Address[safe_offset(0)].state AS address1_state,
  Address[safe_offset(0)].postalCode AS address1_postalCode,
  Address[safe_offset(0)].country AS address1_country
FROM
  `hcls-testing-data.fhir_20k_patients_analytics.Patient` AS Patient
LIMIT 10
Query in "Query editor" and results:
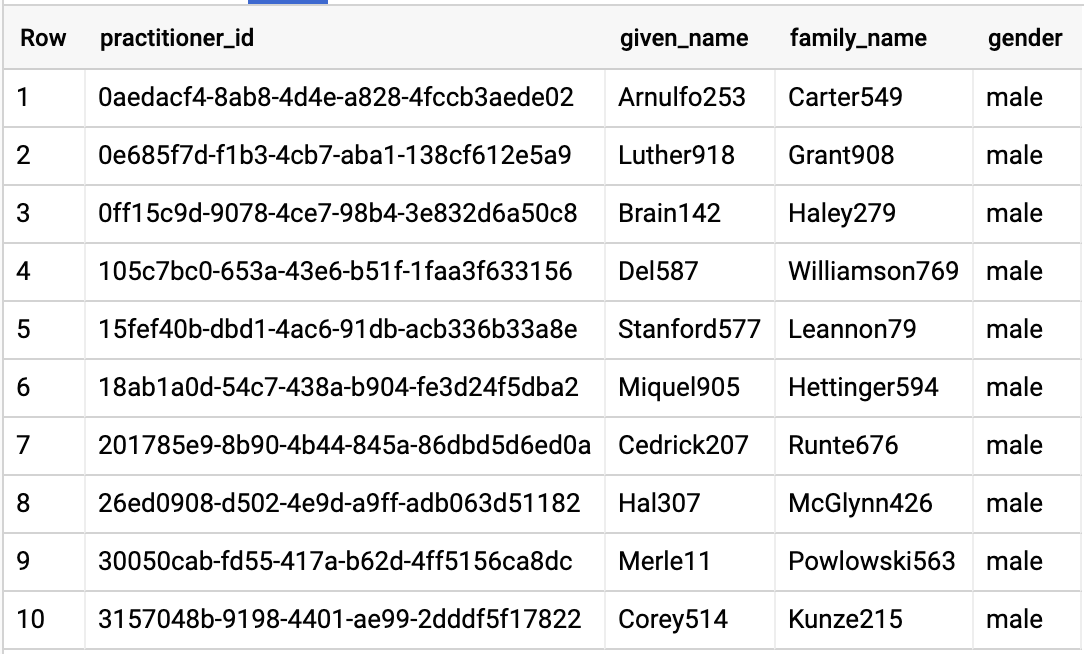
QUERY PRACTITIONERS
#standardSQL - Query Practitioners
SELECT
  id AS practitioner_id,
  name[safe_offset(0)].given AS given_name,
  name[safe_offset(0)].family AS family_name,
  gender
FROM
  `hcls-testing-data.fhir_20k_patients_analytics.Practitioner`
LIMIT 10
Query results:
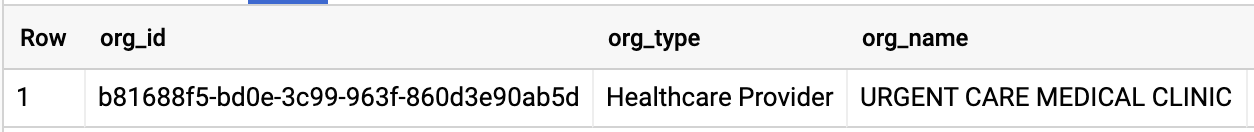
QUERY ORGANIZATION
Change the organization id to match your dataset.
#standardSQL - Query Organization
SELECT
  id AS org_id,
  type[safe_offset(0)].text AS org_type,
  name AS org_name,
  address[safe_offset(0)].line AS org_addr,
  address[safe_offset(0)].city AS org_addr_city,
  address[safe_offset(0)].state AS org_addr_state,
  address[safe_offset(0)].postalCode AS org_addr_postalCode,
  address[safe_offset(0)].country AS org_addr_country
FROM
  `hcls-testing-data.fhir_20k_patients_analytics.Organization` AS Organization
WHERE
  id = "b81688f5-bd0e-3c99-963f-860d3e90ab5d"
Query results:
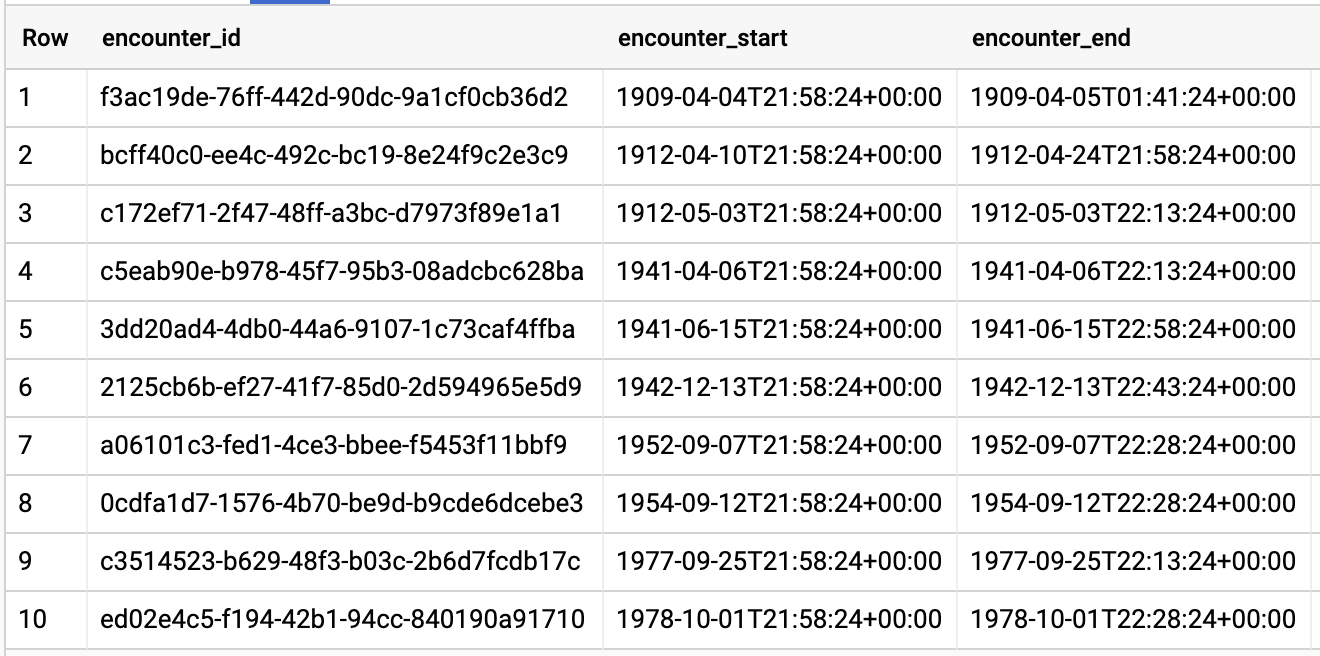
QUERY ENCOUNTERS BY PATIENT
#standardSQL - Query Encounters by Patient
SELECT
  id AS encounter_id,
  period.start AS encounter_start,
  period.end AS encounter_end,
  status AS encounter_status,
  class.code AS encounter_type,
  subject.patientId as patient_id,
  participant[safe_OFFSET(0)].individual.practitionerId as parctitioner_id,
  serviceProvider.organizationId as encounter_location_id,
  type[safe_OFFSET(0)].text AS encounter_reason
FROM
  `hcls-testing-data.fhir_20k_patients_analytics.Encounter` AS Encounter
WHERE
  subject.patientId = "900820eb-4166-4981-ae2d-b183a064ac18"
ORDER BY
  encounter_end
Query results:
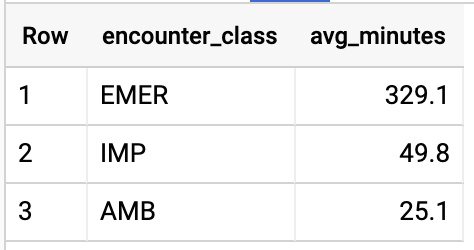
GET AVG LENGTH OF ENCOUNTERS BY ENCOUNTER TYPE
#standardSQL - Get Average length of Encounters by Encounter type
SELECT
  class.code encounter_class,
  ROUND(AVG(TIMESTAMP_DIFF(TIMESTAMP(period.end),    TIMESTAMP(period.start), HOUR)),1) as avg_minutes
FROM
  `hcls-testing-data.fhir_20k_patients_analytics.Encounter` AS Encounter
WHERE
  period.end >= period.start
GROUP BY
  1
ORDER BY
  2 DESC
Query results:
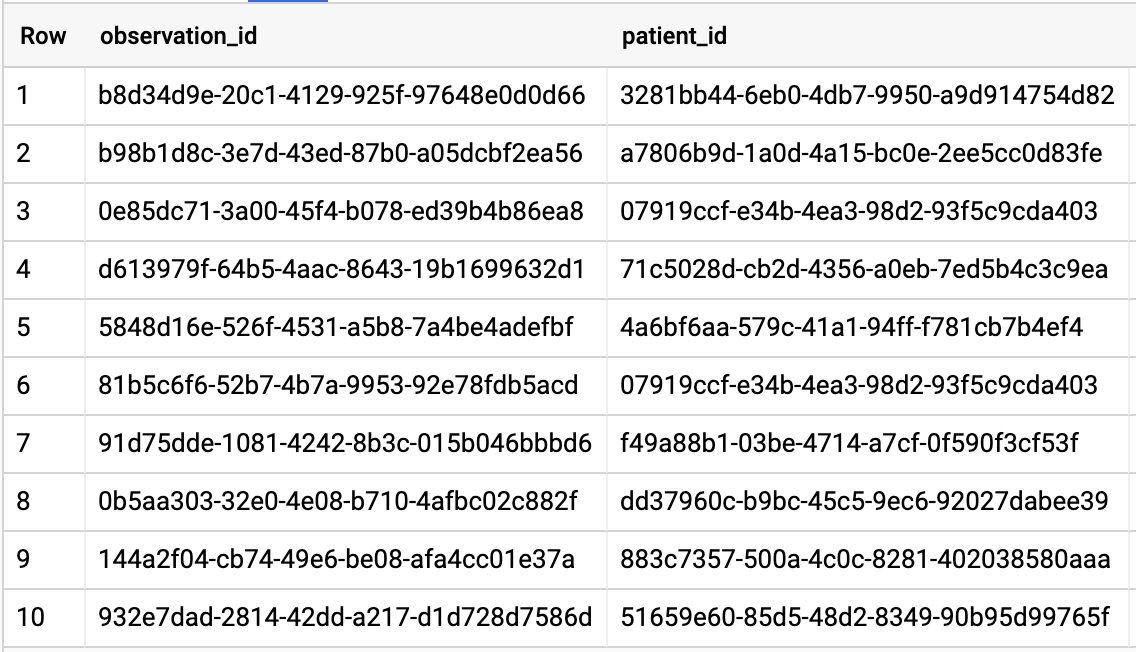
GET ALL PATIENTS WHO HAVE A1C RATE >= 6.5
# Query Patients who have A1C rate >= 6.5
SELECT
  id AS observation_id,
  subject.patientId AS patient_id,
  context.encounterId AS encounter_id,
  value.quantity.value,
  value.quantity.unit,
  code.coding[safe_offset(0)].code,
  code.coding[safe_offset(0)].display AS description
FROM
  `hcls-testing-data.fhir_20k_patients_analytics.Observation`
WHERE
  code.text like '%A1c/Hemoglobin%' AND
  value.quantity.value >= 6.5 AND
  status = 'final'
Query results:
4. Create AI Platform Notebooks instance
Follow the instructions in this link to create a new AI Platform Notebooks (JupyterLab) instance.
Please make sure to enable Compute Engine API.
You can choose " Create a new notebook with default options" or " Create a new notebook and specify your options".
5. Build a Data Analytics Notebook
Open AI Platform Notebooks instance
In this section we will author and code a new Jupyter notebook from scratch.
- Open a notebook instance by navigating to the AI Platform Notebooks page in the Google Cloud Platform Console. GO TO THE AI PLATFORM NOTEBOOKS PAGE
- Select Open JupyterLab for the instance that you want to open.
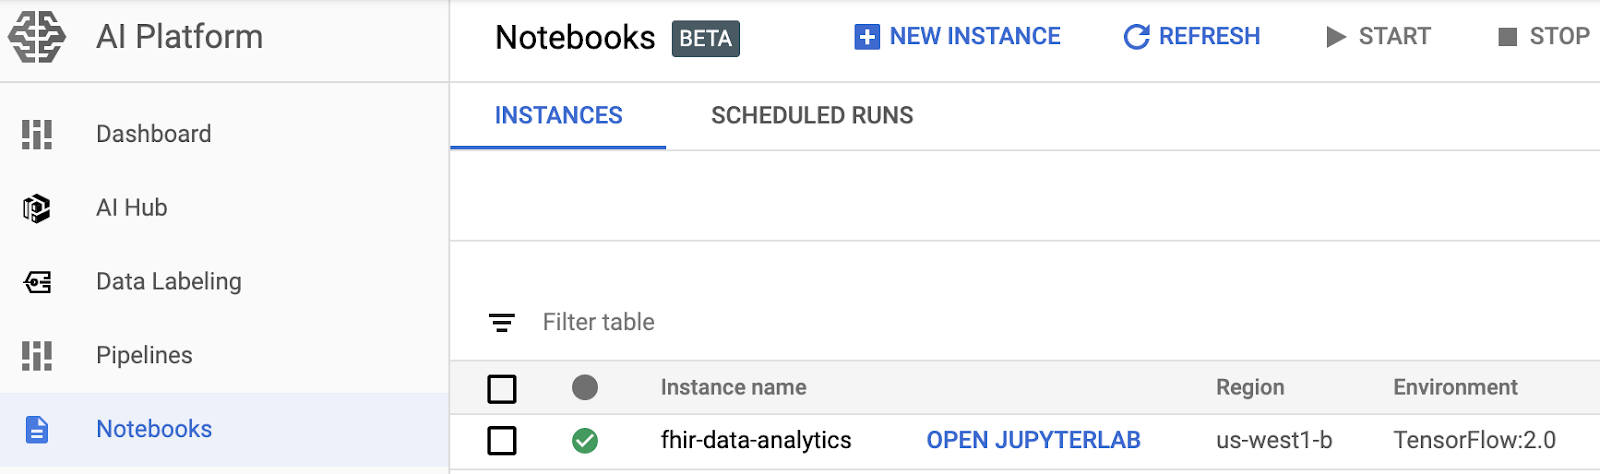
- AI Platform Notebooks directs you to a URL for your notebook instance.
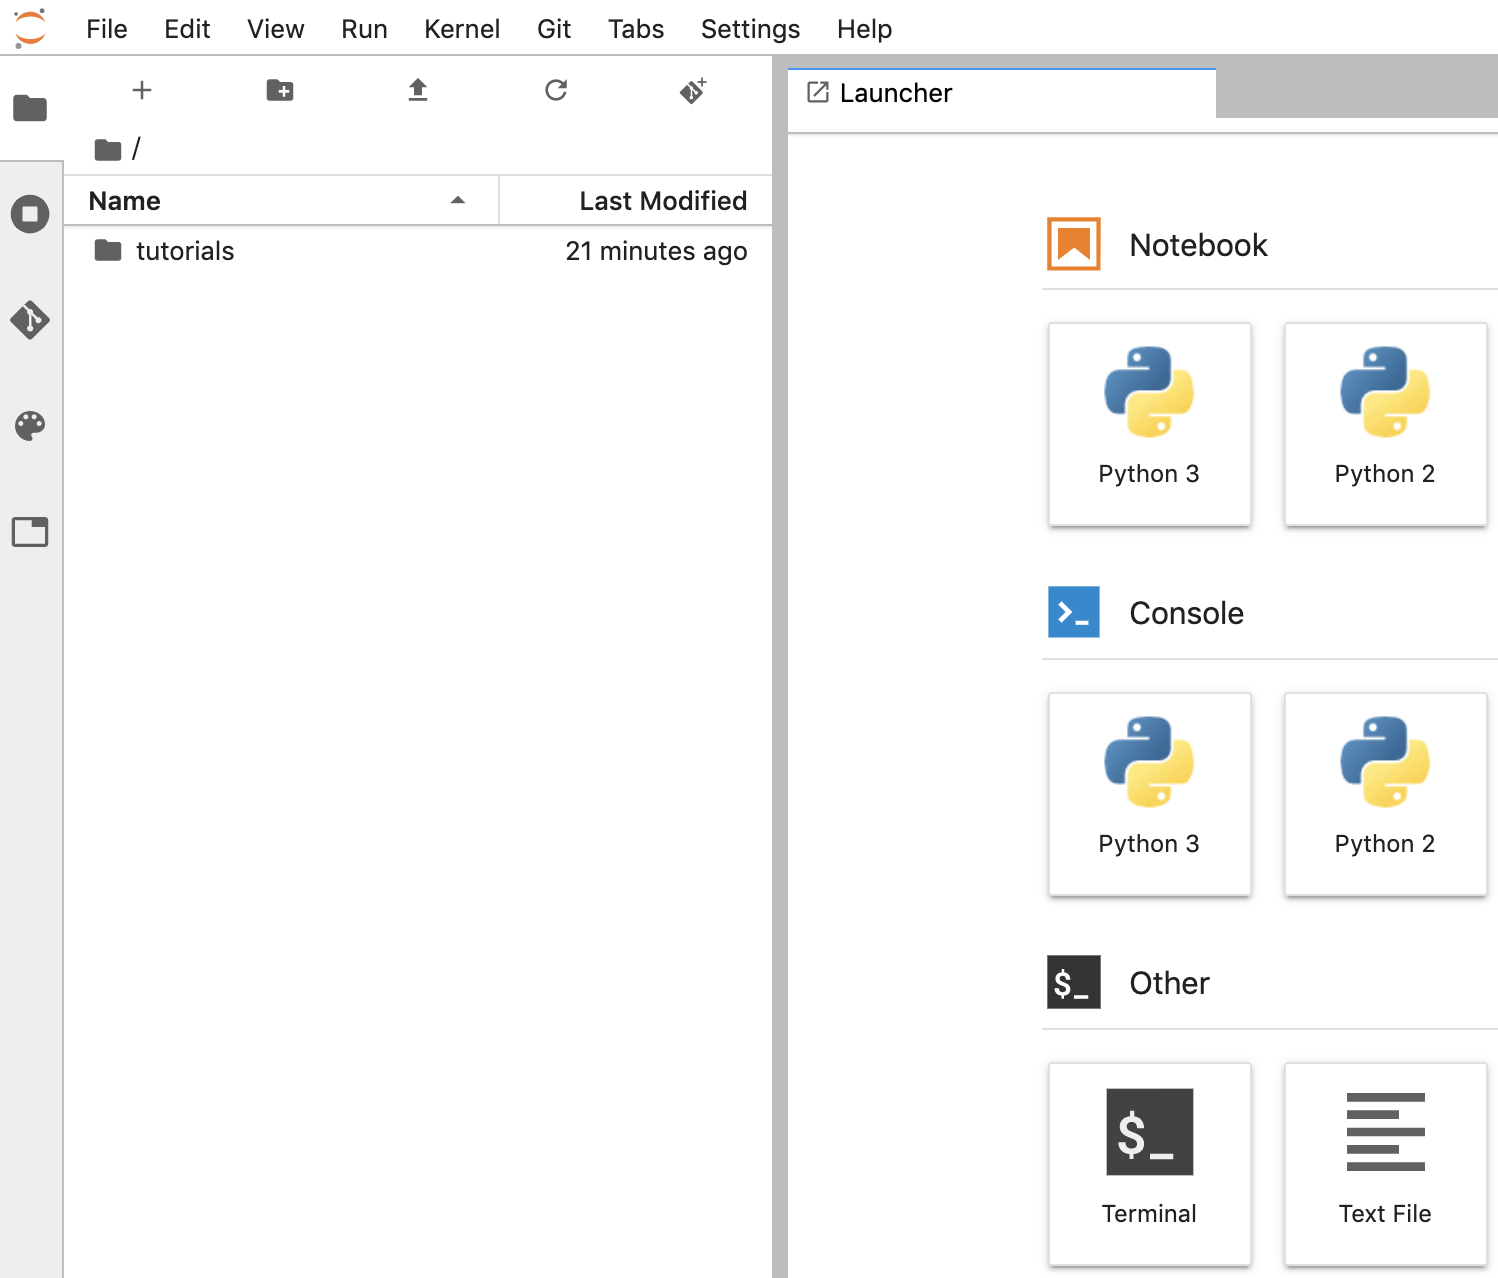
Create a notebook
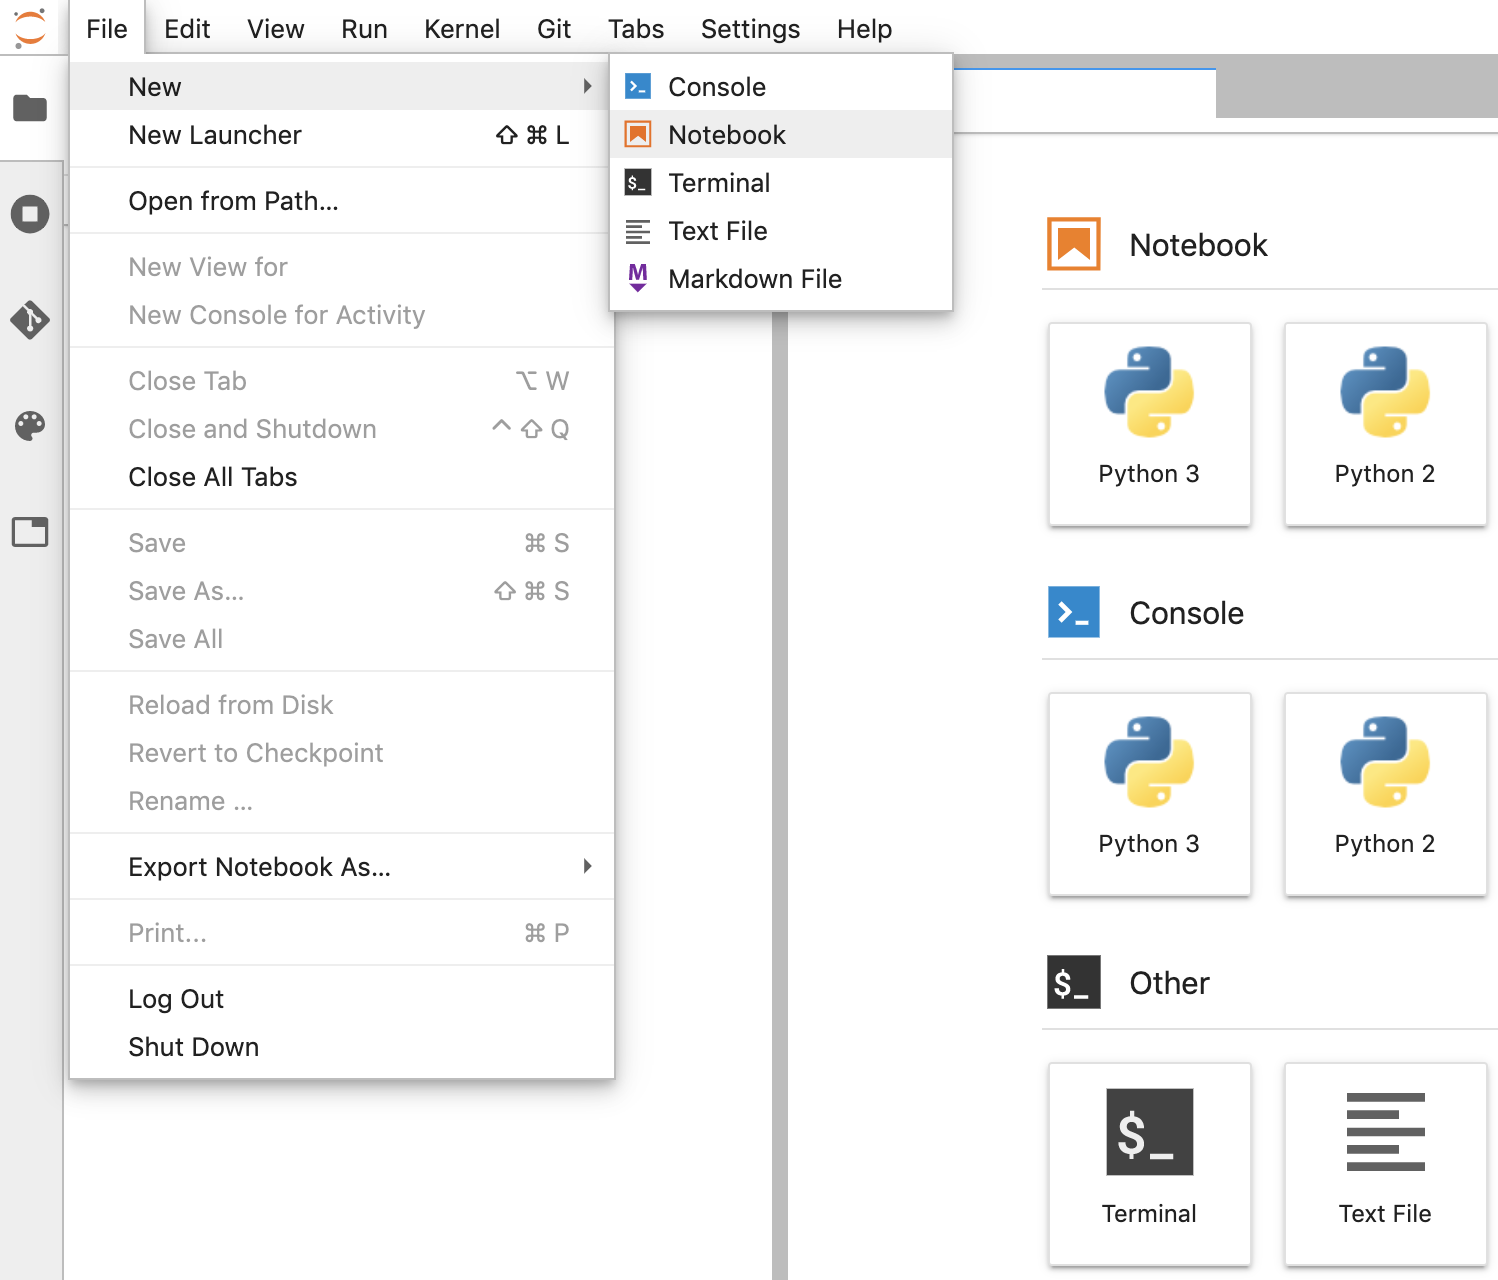
- In JupyterLab, go to File -> New -> Notebook and select the Kernel "Python 3" in the popup, or select "Python 3" under the Notebook section in the launcher window to create an Untitled.ipynbnotebook.
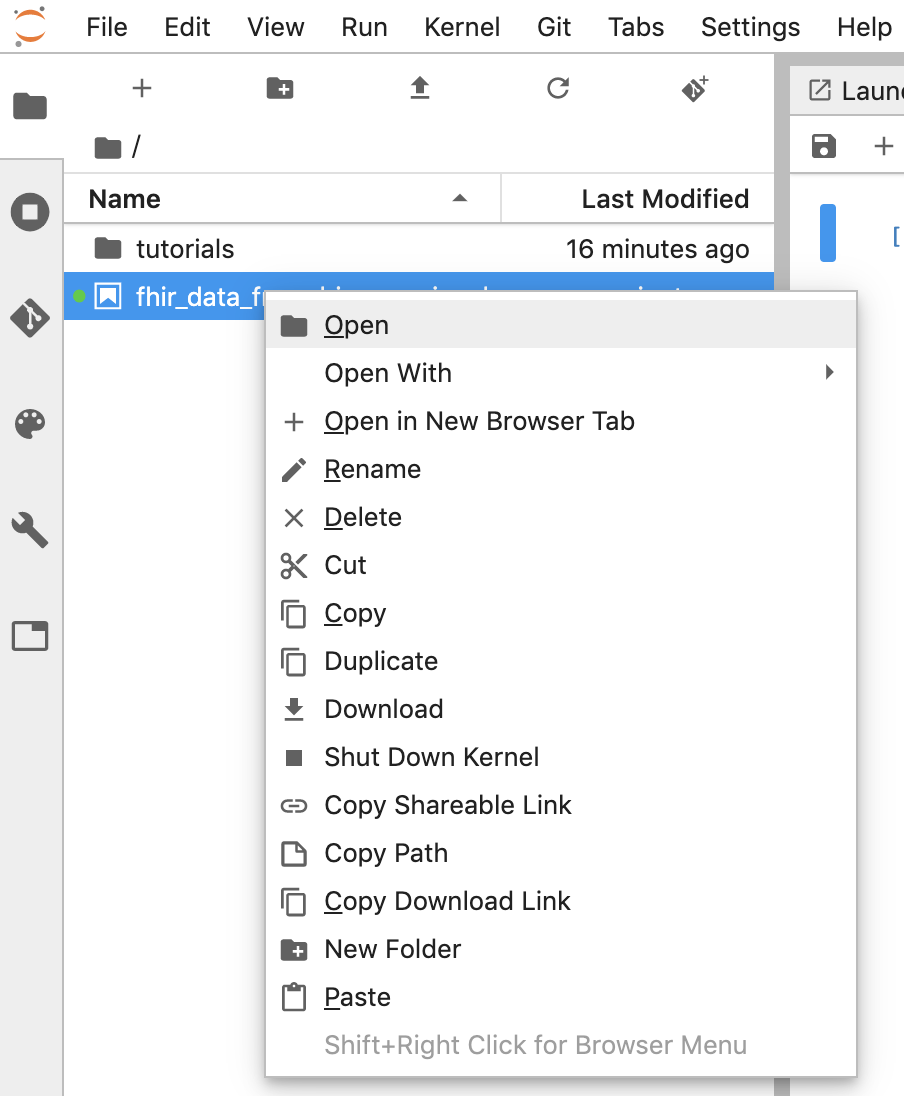
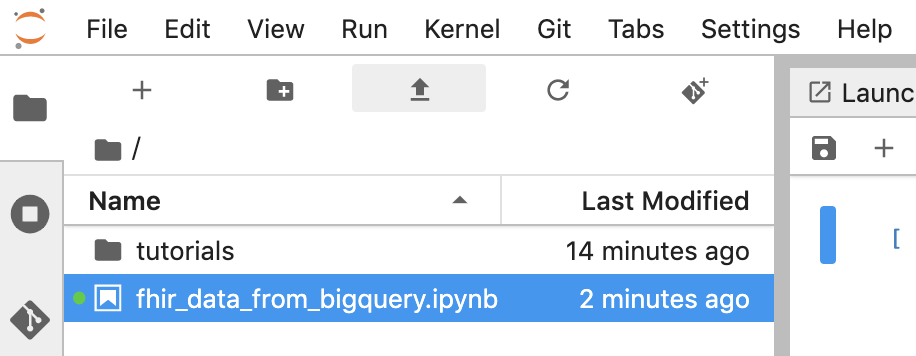
- Right click Untitled.ipynb and rename the notebook to "fhir_data_from_bigquery.ipynb". Double click to open it, build the queries, and save the notebook.
- You can download a notebook by right clicking the *.ipynb file and select Download from the menu.
- You can also upload an existing notebook by clicking the "Up arrow" button.
Build and execute each code block in the notebook
Copy and execute each code block provided in this section one by one. To execute the code click "Run" (Triangle).
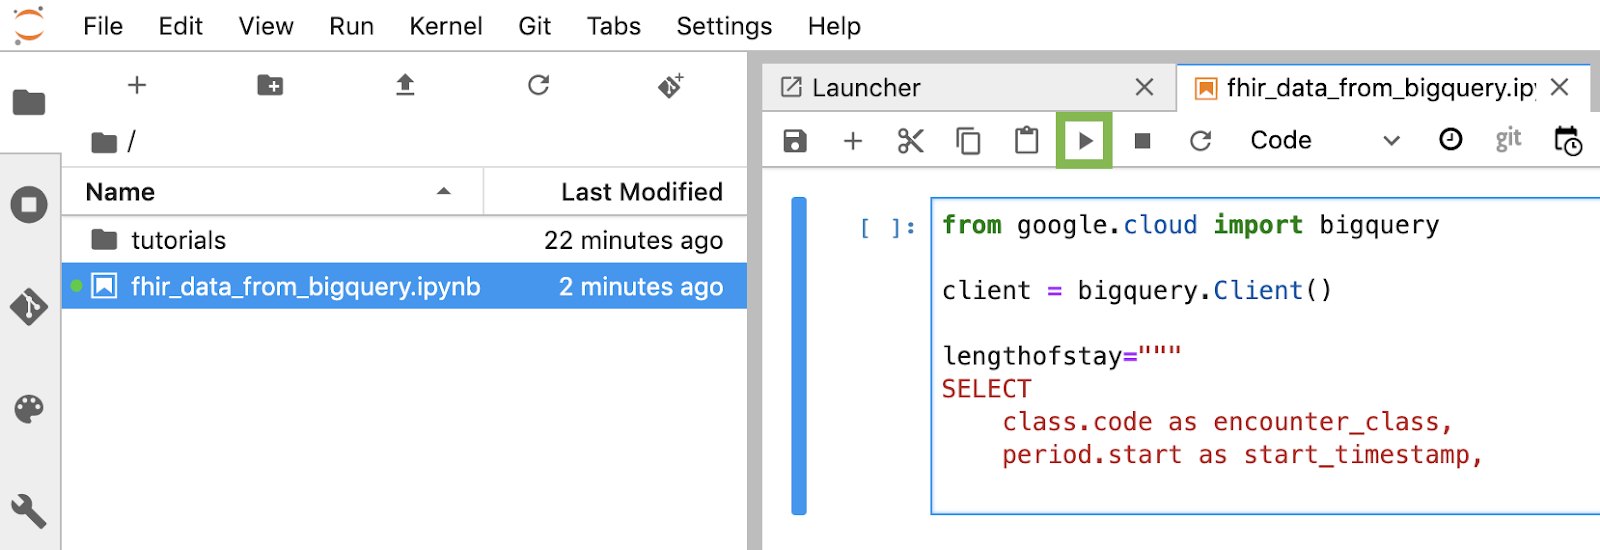
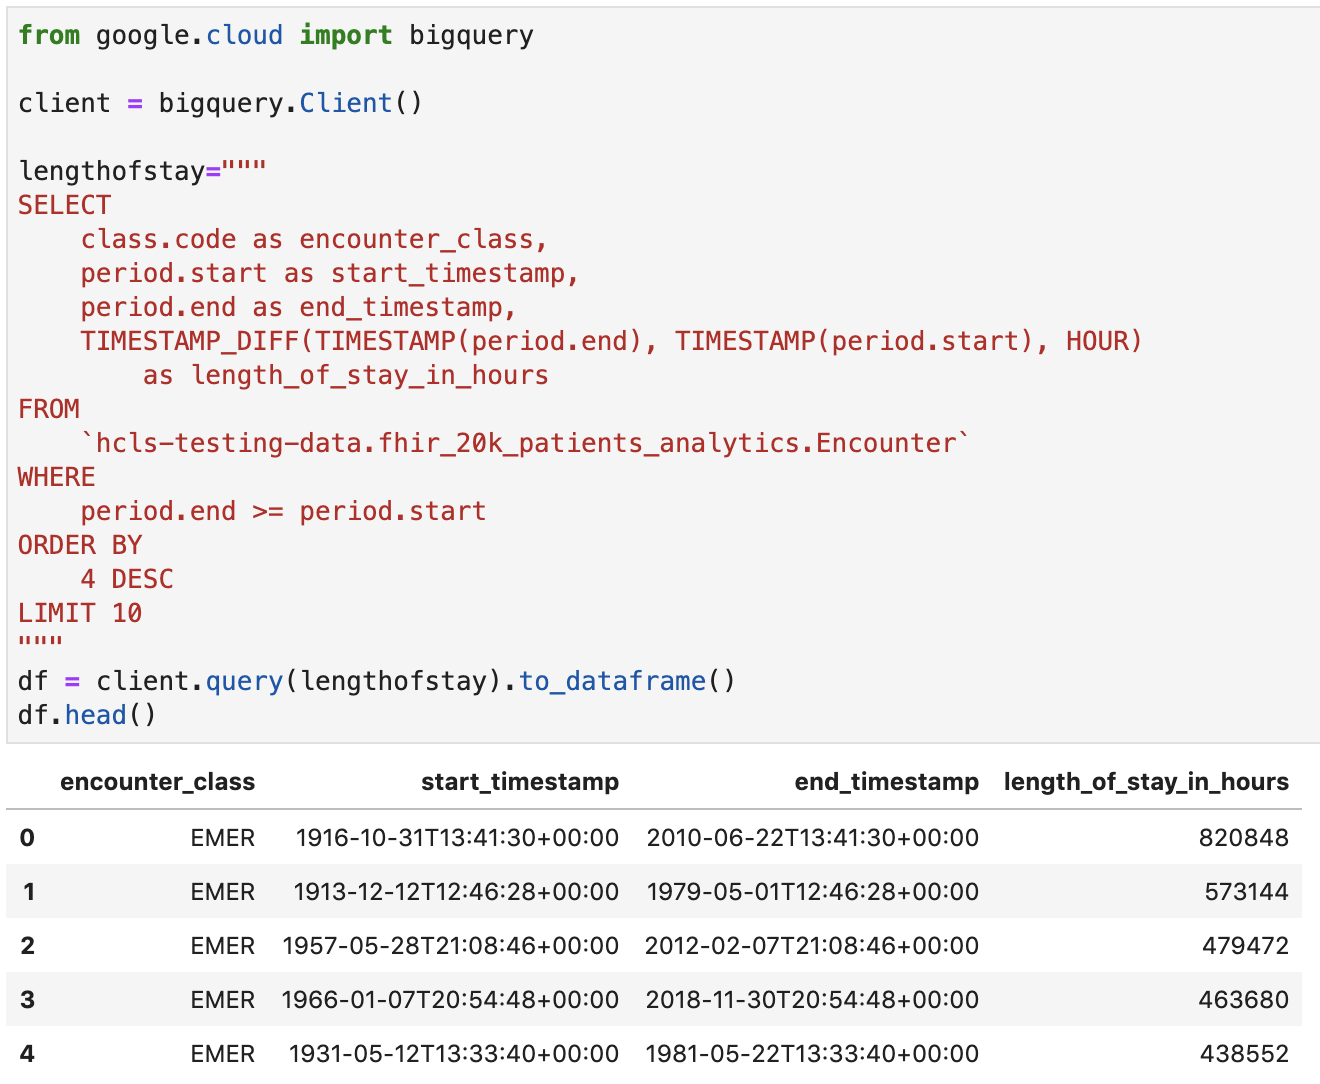
Get length of stay for encounters in hours
from google.cloud import bigquery

client = bigquery.Client()

lengthofstay="""
SELECT
    class.code as encounter_class,
    period.start as start_timestamp,
    period.end as end_timestamp,
    TIMESTAMP_DIFF(TIMESTAMP(period.end), TIMESTAMP(period.start), HOUR)
        as length_of_stay_in_hours
FROM
    `hcls-testing-data.fhir_20k_patients_analytics.Encounter`
WHERE
    period.end >= period.start
ORDER BY
    4 DESC
LIMIT 10
"""
df = client.query(lengthofstay).to_dataframe()
df.head()
Code and execution output:
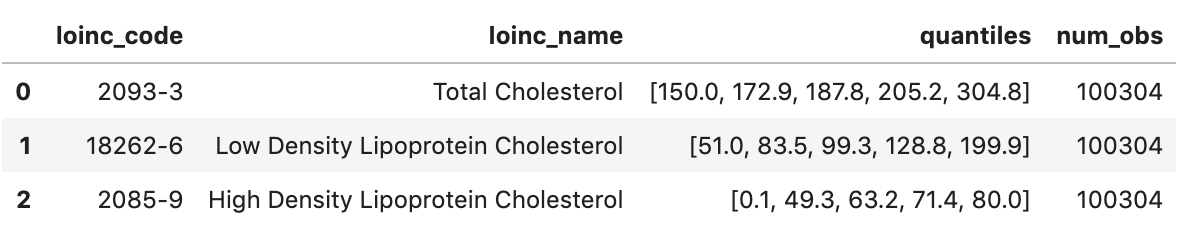
Get Observations - Cholesterol values
observation="""
SELECT
  cc.code loinc_code,
  cc.display loinc_name,
  approx_quantiles(round(o.value.quantity.value,1),4) as quantiles,
  count(*) as num_obs
FROM
  `hcls-testing-data.fhir_20k_patients_analytics.Observation` o, o.code.coding cc
WHERE
  cc.system like '%loinc%' and lower(cc.display) like '%cholesterol%'
GROUP BY 1,2
ORDER BY 4 desc
"""
df2 = client.query(observation).to_dataframe()
df2.head()
Execution output:
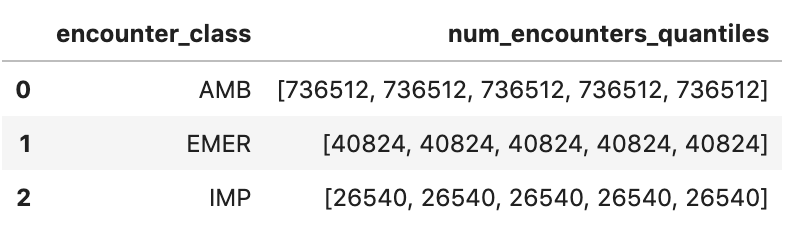
Get Approximate encounter quantiles
encounters="""
SELECT
  encounter_class,
  APPROX_QUANTILES(num_encounters, 4) num_encounters_quantiles
FROM (
  SELECT
    class.code encounter_class,
    subject.reference patient_id,
    COUNT(DISTINCT id) AS num_encounters
  FROM
    `hcls-testing-data.fhir_20k_patients_analytics.Encounter`
  GROUP BY
    1,2
  )
GROUP BY 1
ORDER BY 1
"""
df3 = client.query(encounters).to_dataframe()
df3.head()
Execution output:
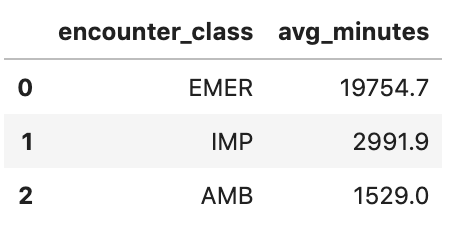
Get Average length of encounters in minutes
avgstay="""
SELECT
  class.code encounter_class,
  ROUND(AVG(TIMESTAMP_DIFF(TIMESTAMP(period.end), TIMESTAMP(period.start), MINUTE)),1) as avg_minutes
FROM
  `hcls-testing-data.fhir_20k_patients_analytics.Encounter`
WHERE
  period.end >= period.start
GROUP BY
  1
ORDER BY
  2 DESC
  """
df4 = client.query(avgstay).to_dataframe()
df4.head()
Execution output:
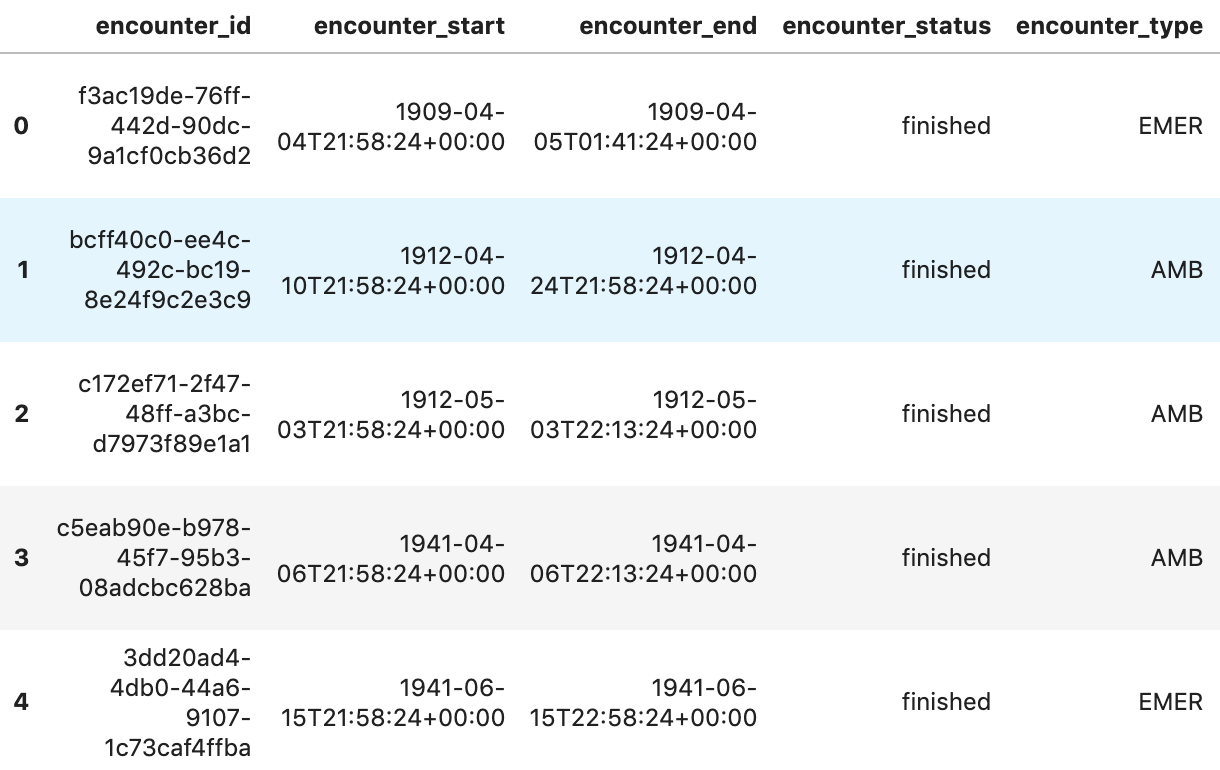
Get Encounters per patient
patientencounters="""
SELECT
  id AS encounter_id,
  period.start AS encounter_start,
  period.end AS encounter_end,
  status AS encounter_status,
  class.code AS encounter_type,
  subject.patientId as patient_id,
  participant[safe_OFFSET(0)].individual.practitionerId as parctitioner_id,
  serviceProvider.organizationId as encounter_location_id,
  type[safe_OFFSET(0)].text AS encounter_reason
FROM
  `hcls-testing-data.fhir_20k_patients_analytics.Encounter` AS Encounter
WHERE
  subject.patientId = "900820eb-4166-4981-ae2d-b183a064ac18"
ORDER BY
  encounter_end
"""

df5 = client.query(patientencounters).to_dataframe()
df5.head()
Execution output:
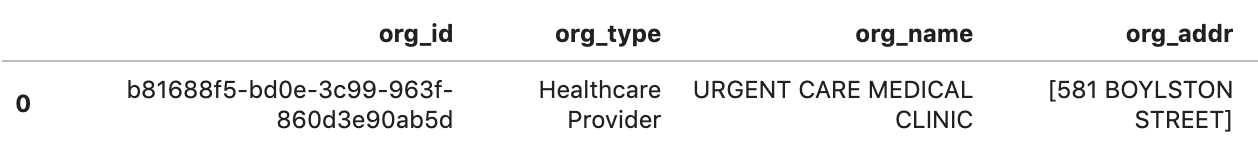
Get Organizations
orgs="""
SELECT
  id AS org_id,
  type[safe_offset(0)].text AS org_type,
  name AS org_name,
  address[safe_offset(0)].line AS org_addr,
  address[safe_offset(0)].city AS org_addr_city,
  address[safe_offset(0)].state AS org_addr_state,
  address[safe_offset(0)].postalCode AS org_addr_postalCode,
  address[safe_offset(0)].country AS org_addr_country
FROM
  `hcls-testing-data.fhir_20k_patients_analytics.Organization` AS Organization
WHERE
  id = "b81688f5-bd0e-3c99-963f-860d3e90ab5d"
"""

df6 = client.query(orgs).to_dataframe()
df6.head()
Execution result:
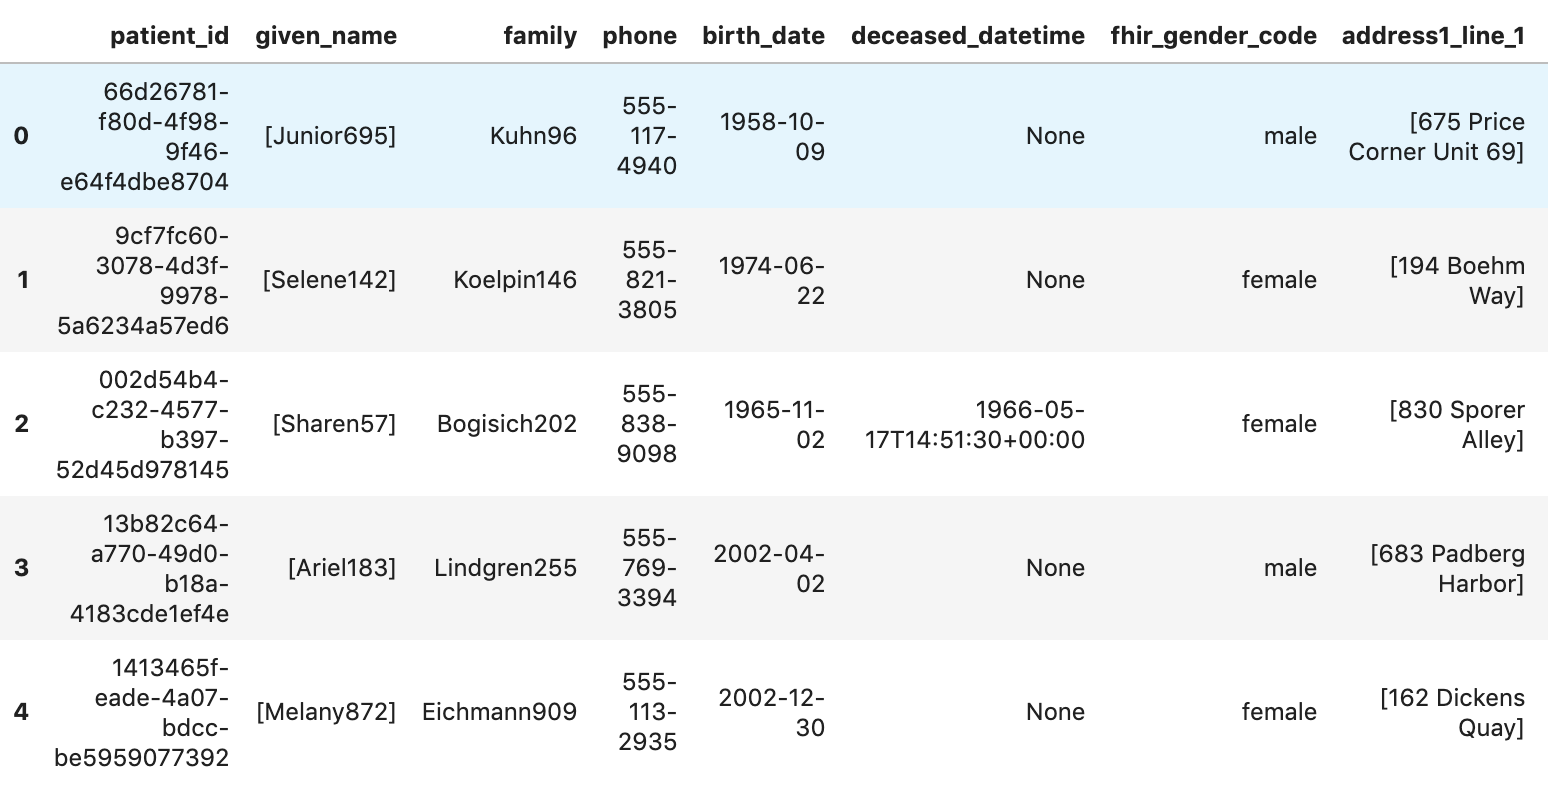
Get Patients
patients="""
SELECT
  id AS patient_id,
  name[safe_offset(0)].given AS given_name,
  name[safe_offset(0)].family AS family,
  telecom[safe_offset(0)].value AS phone,
  birthDate AS birth_date,
  deceased.dateTime AS deceased_datetime,
  Gender AS fhir_gender_code,
  Address[safe_offset(0)].line AS address1_line_1,
  Address[safe_offset(0)].city AS address1_city,
  Address[safe_offset(0)].state AS address1_state,
  Address[safe_offset(0)].postalCode AS address1_postalCode,
  Address[safe_offset(0)].country AS address1_country
FROM
  `hcls-testing-data.fhir_20k_patients_analytics.Patient` AS Patient
LIMIT 10
"""

df7 = client.query(patients).to_dataframe()
df7.head()
Execution results:
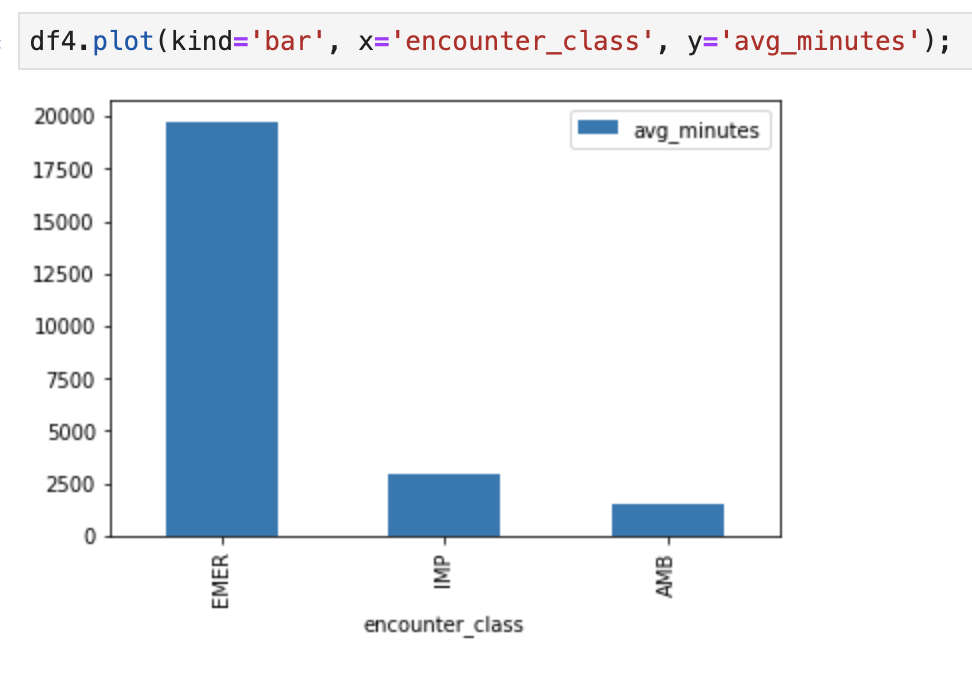
6. Create Charts and Graphs in AI Platform Notebooks
Execute code cells in notebook "fhir_data_from_bigquery.ipynb" to draw a bar graph.
For example, get the average length of Encounters in minutes.
df4.plot(kind='bar', x='encounter_class', y='avg_minutes');
Code and execution results:
7. Commit Notebook to Cloud Source Repository
- In the GCP Console, navigate to Source Repositories. If it is the first time you use it, click Get started, then Create repository.
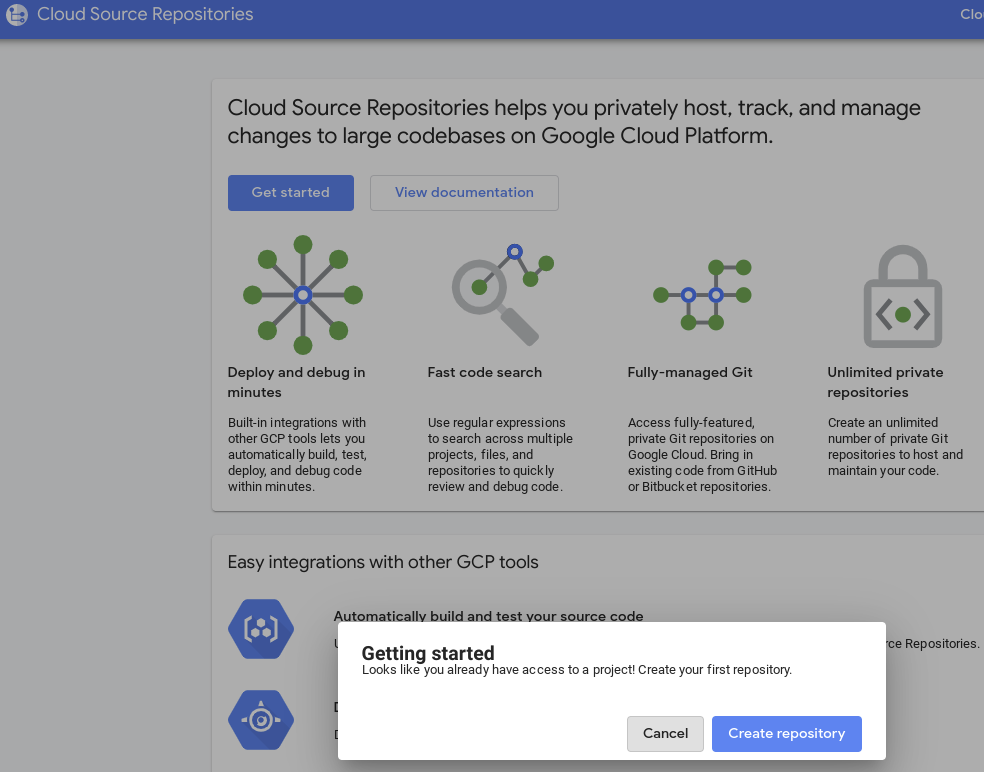
- For a subsequent time, navigate to GCP -> Cloud Source Repositories, and click +Add repository to create a new repository.

- Select "Create a new Repository", then click Continue.
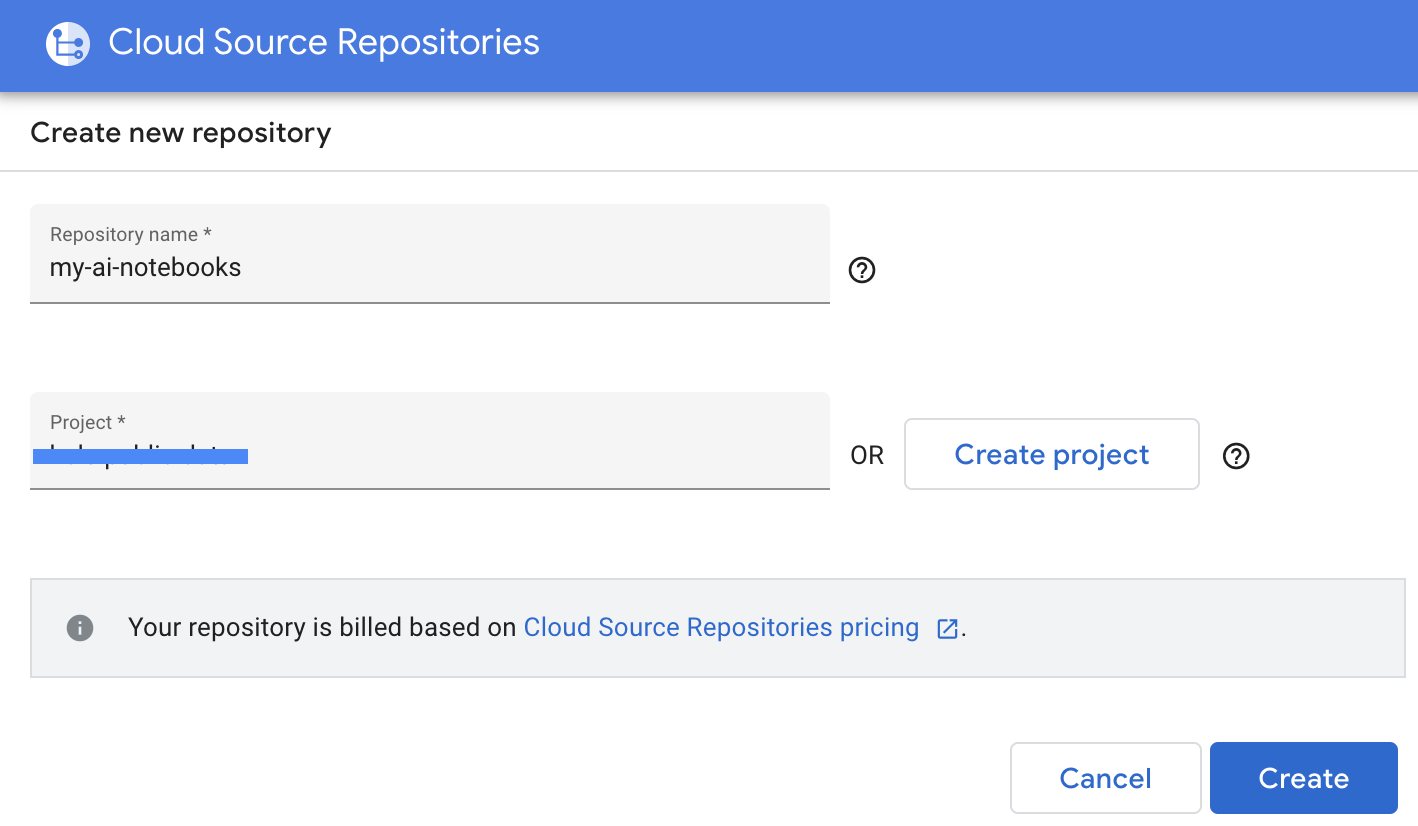
- Provide Repository name and Project name, then click Create.
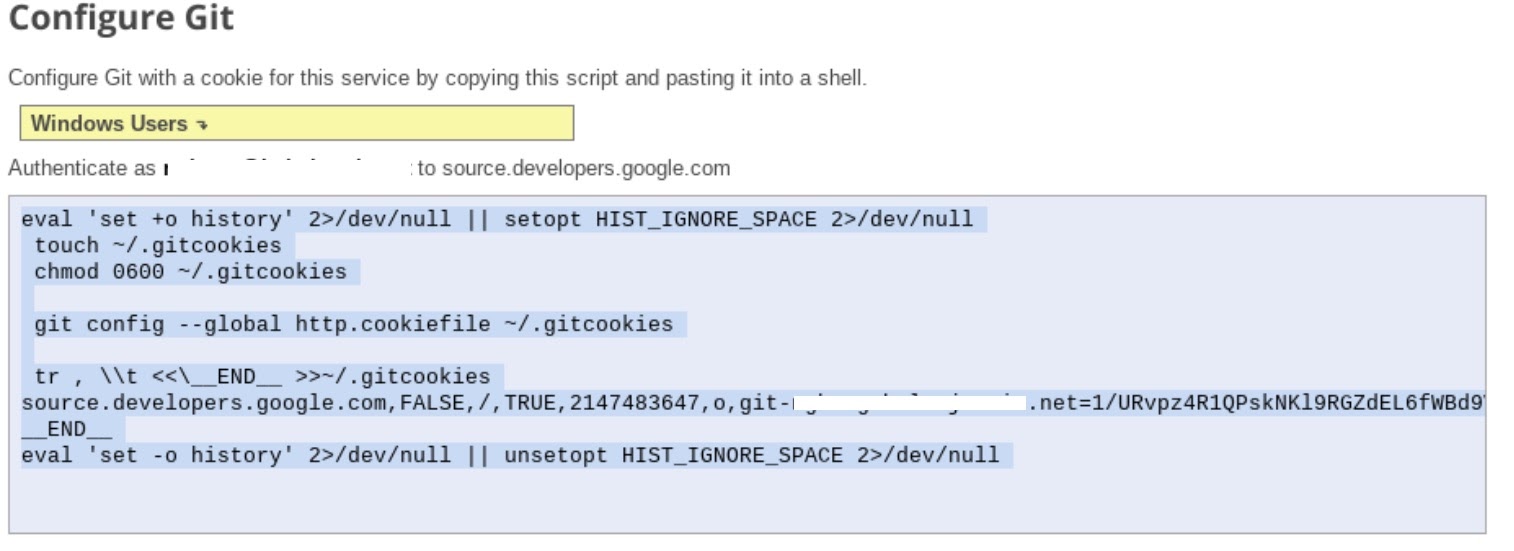
- Select "Clone your repository to a local Git repository", then select Manually generated credentials.
- Follow step 1 "Generate and store Git credentials" instructions (see below). Copy the script that appears on your screen.
- Start terminal session in Jupyter.
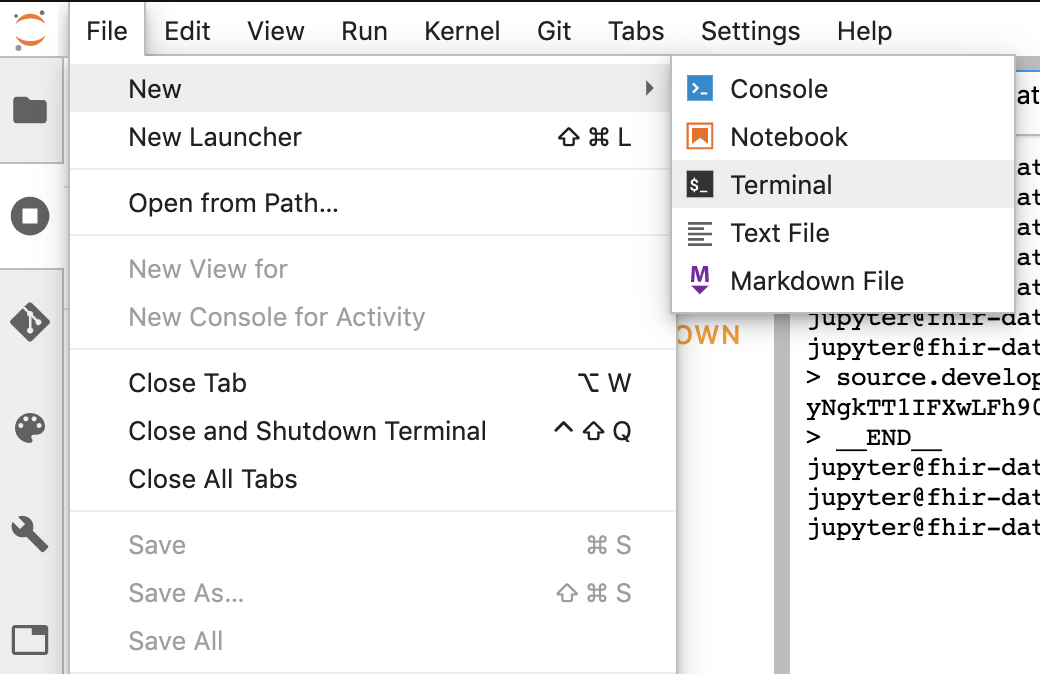
- Paste all commands from your "Configure Git" window into the Jupyter terminal.
- Copy the repository clone path from the GCP Cloud source repositories (step 2 in screenshot below).
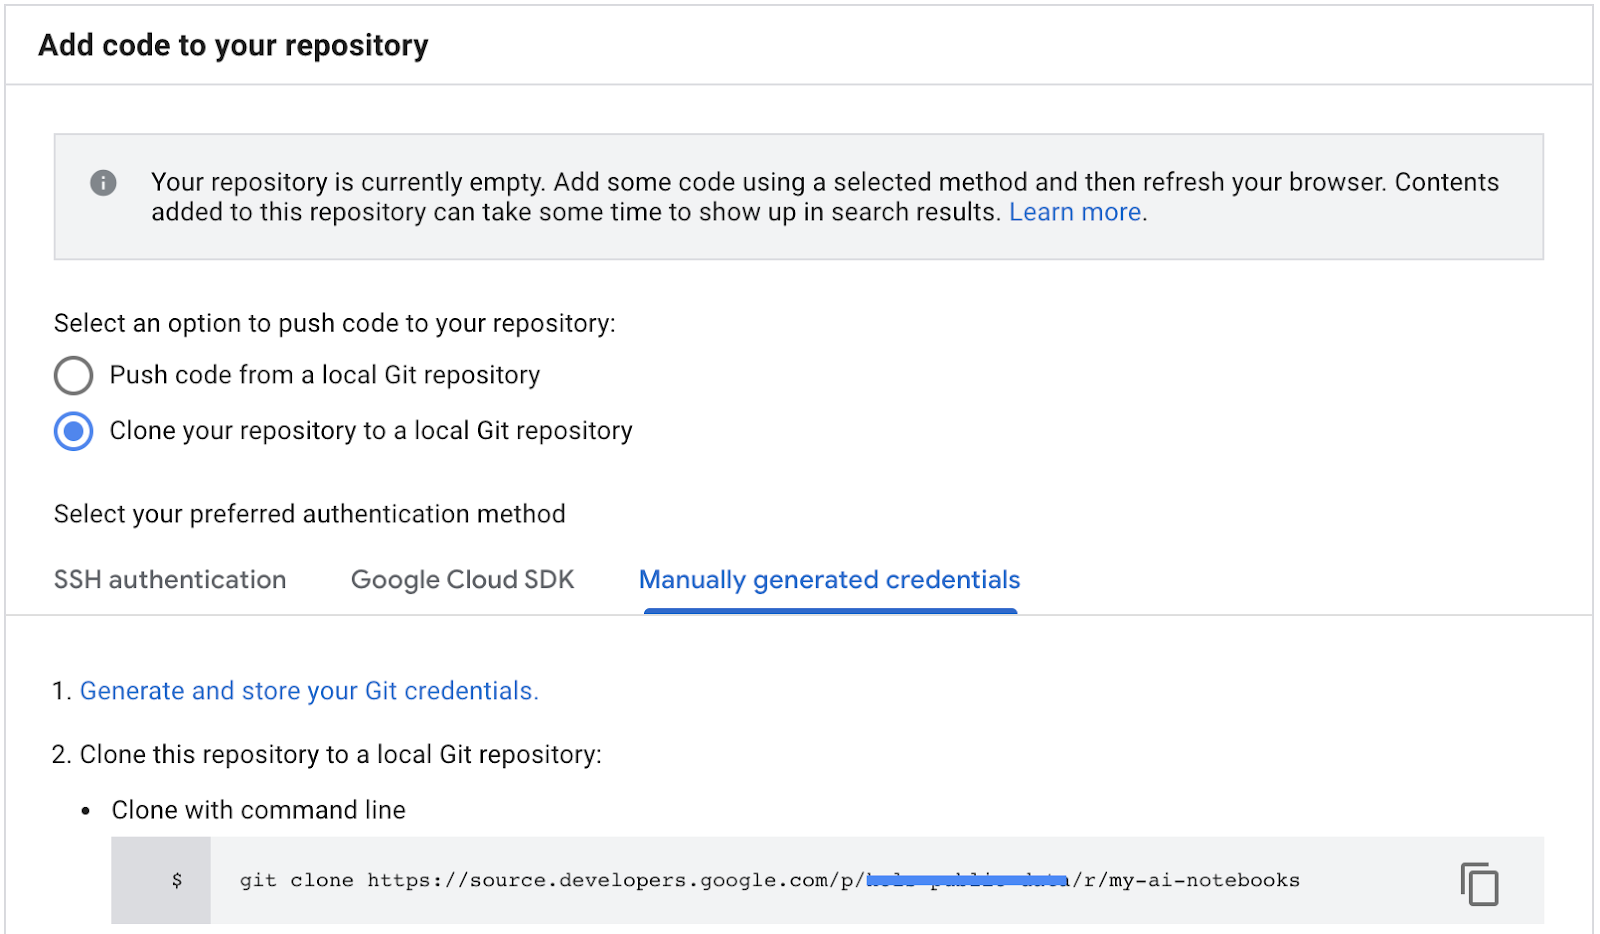
- Paste this command in JupiterLab terminal. Command will look like following one:
git clone https://source.developers.google.com/p/<your -project-name>/r/my-ai-notebooks
- The "my-ai-notebooks" folder is created in Jupyterlab.
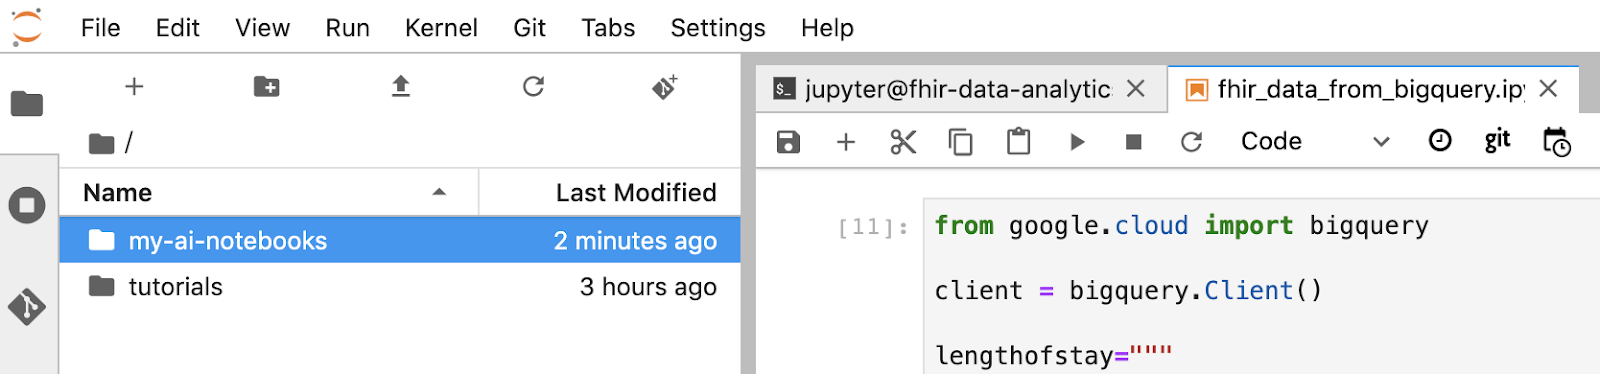
- Move your notebook (fhir_data_from_bigquery.ipynb) into the folder "my-ai-notebooks".
- In the Jupyter terminal, change the directory to "cd my-ai-notebooks".
- Stage your changes using the Jupyter terminal. Alternatively you can use the Jupyter UI (right click the files in the Untracked area, select Track, then the files are moved into the Tracked area, and vice versa. Changed area contains the modified files).
git remote add my-ai-notebooks https://source.developers.google.com/p/<your -project-name>/r/my-ai-notebooks
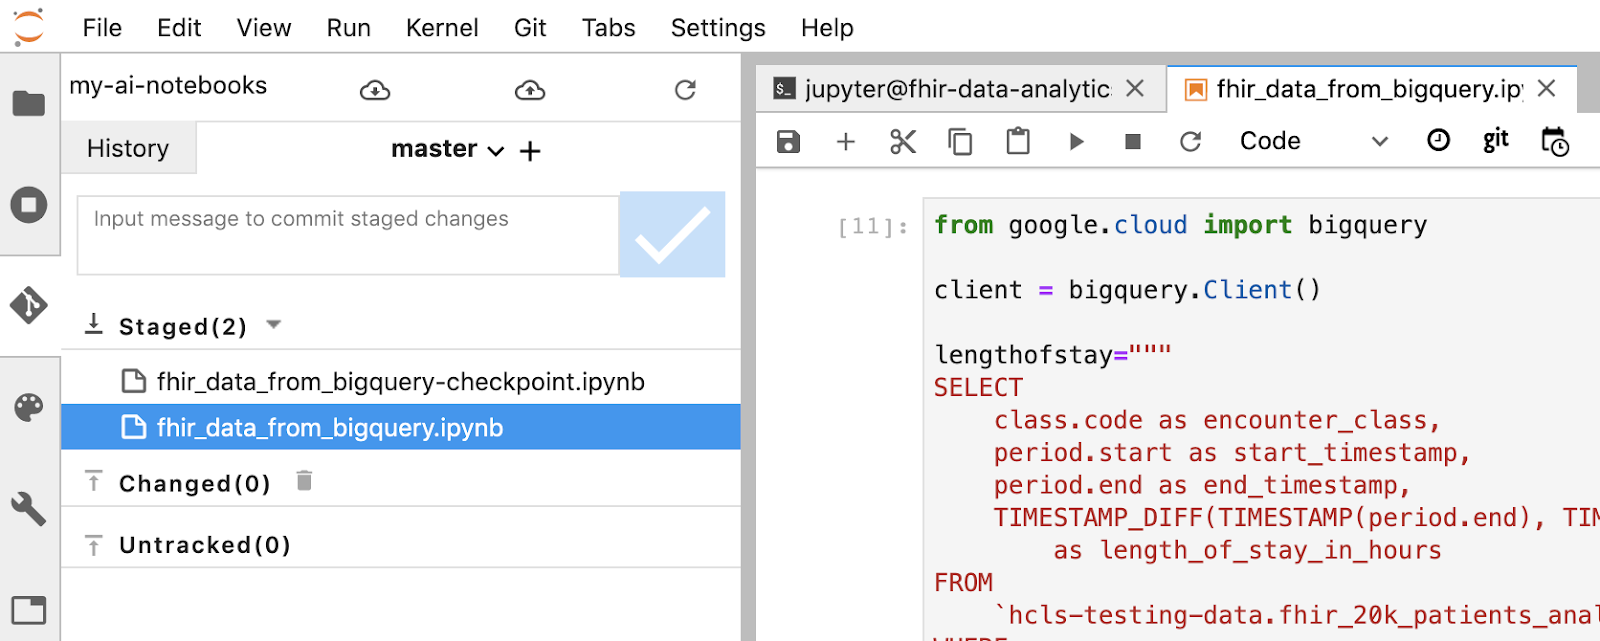
- Commit your changes using the Jupyter terminal or the Jupyter UI (type in the message, then click the "Checked" button).
git commit -m "message goes here"
- Push your changes to the remote repository using the Jupyter terminal or the Jupyter UI (click the "push committed changes" icon
 ).
).
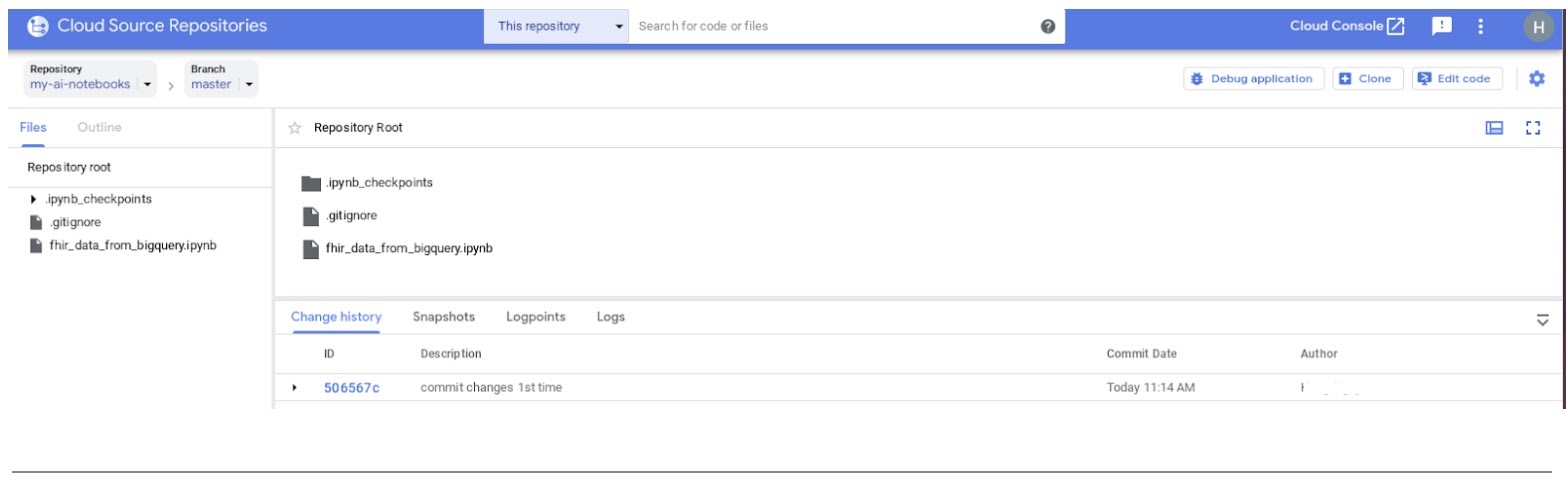
git push --all
- In the GCP console, navigate to Source Repositories. Click on my-ai-notebooks. Notice that "fhir_data_from_bigquery.ipynb" is now saved in the GCP Source Repository.
8. Cleanup
To avoid incurring charges to your Google Cloud Platform account for the resources used in this codelab, after you've finished the tutorial, you can clean up the resources that you created on GCP so they won't take up your quota, and you won't be billed for them in the future. The following sections describe how to delete or turn off these resources.
Deleting the BigQuery dataset
Follow these instructions to delete the BigQuery dataset you created as part of this tutorial. Or, navigate to the BigQuery console, UnPIN project hcls-testing-data, if you used the test dataset fhir_20k_patients_analytics.
Shutting down AI Platform Notebooks instance
Follow instructions in this link Shut down a notebook instance | AI Platform Notebooks to shutdown an AI Platform Notebooks instance.
Deleting the project
The easiest way to eliminate billing is to delete the project that you created for the tutorial.
To delete the project:
- In the GCP Console, go to the Projects page. GO TO THE PROJECTS PAGE
- In the project list, select the project you want to delete and click Delete.
- In the dialog, type the project ID, then click Shut down to delete the project.
9. Congratulations
Congratulations, you've successfully completed the code lab to access, query, and analyze FHIR formatted healthcare data using BigQuery and AI Platform Notebooks.
You accessed a public BigQuery dataset in GCP.
You developed and tested SQL queries using BigQuery UI.
You created and launched an AI Platform Notebooks instance.
You executed SQL queries in JupyterLab and stored the query results in Pandas DataFrame.
You created charts and graphs using Matplotlib.
You committed and pushed your notebook to a Cloud Source Repository in GCP.
You now know the key steps required to start your Healthcare Data Analytics journey with BigQuery and AI Platform Notebooks on the Google Cloud Platform.
©Google, Inc. or its affiliates. All rights reserved. Do not distribute.